
Houses for sale & to rent in Whittlesford, Royston
House Prices in Whittlesford
Properties in Whittlesford have an average house price of £935k and had 12 Property Transactions within the last 3 years¹.
Whittlesford is an area in Royston, Cambridgeshire with 203 households², where the most expensive property was sold for £1.75M.
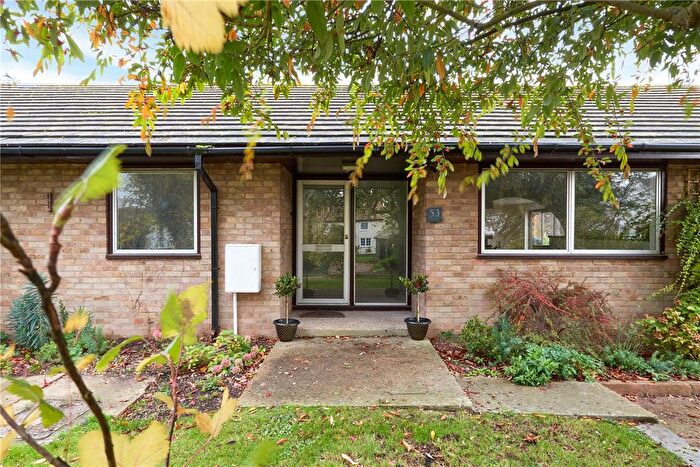
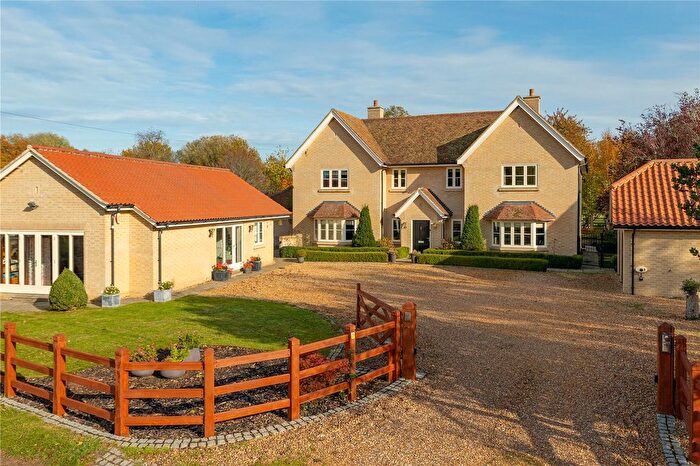
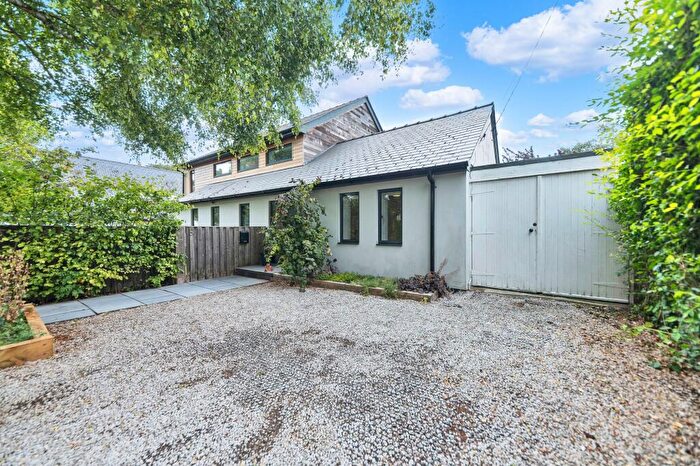
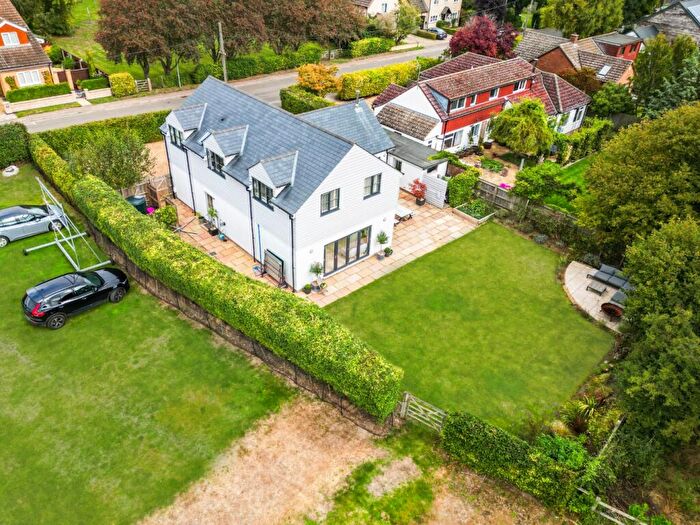
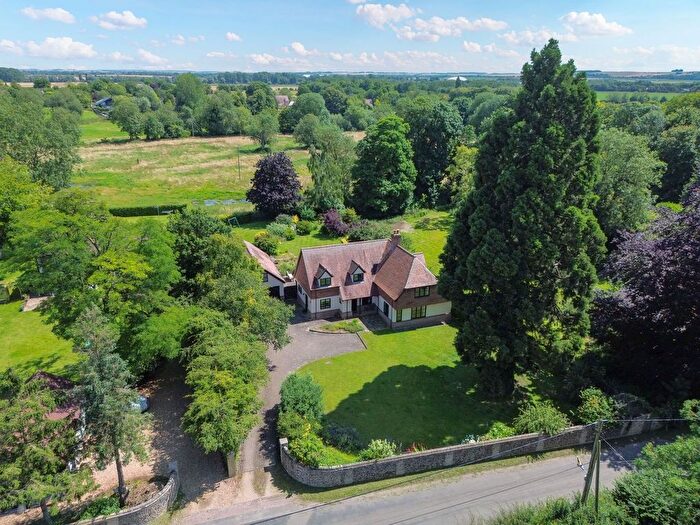
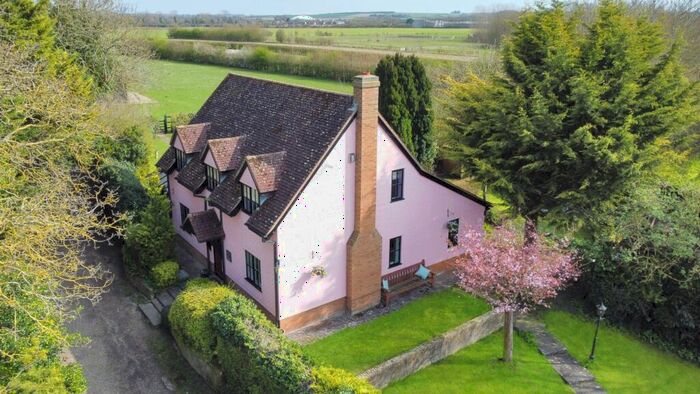
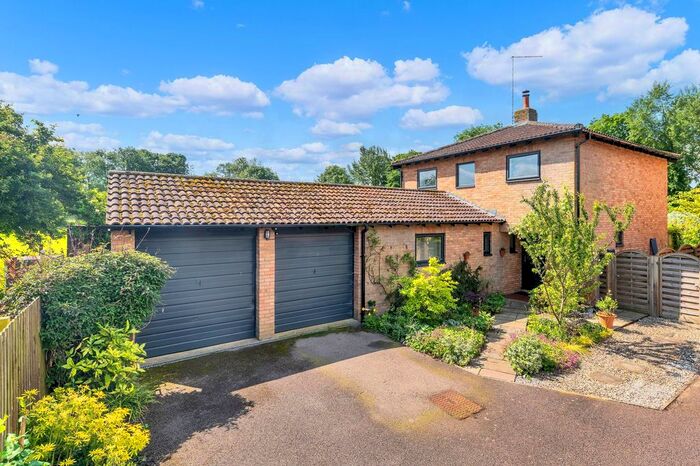
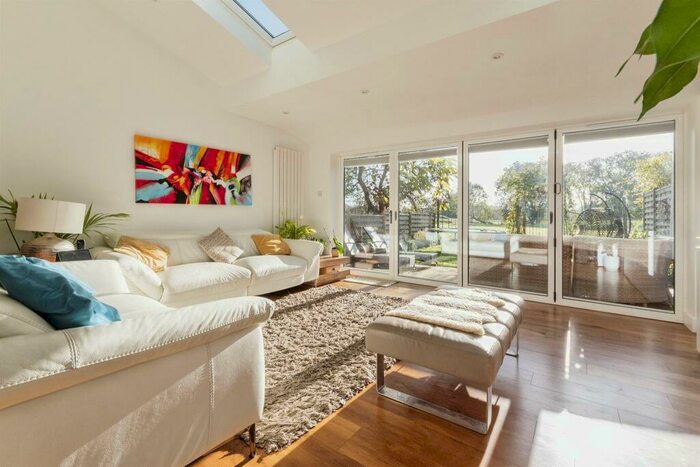
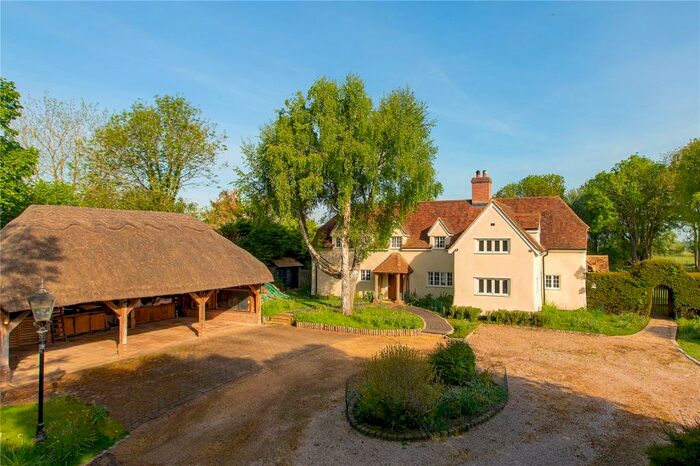
Properties for sale in Whittlesford
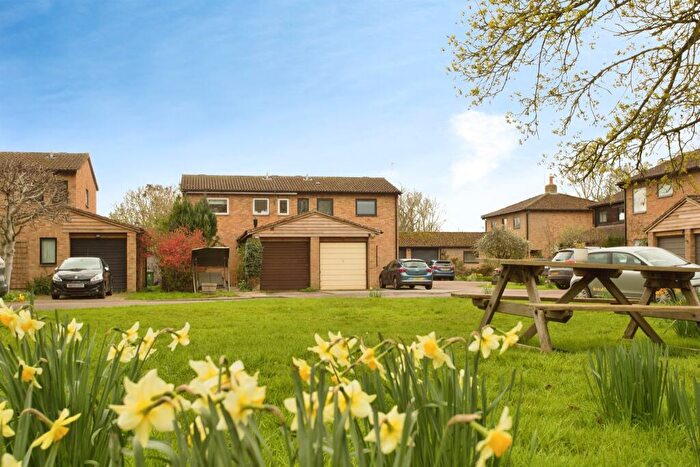
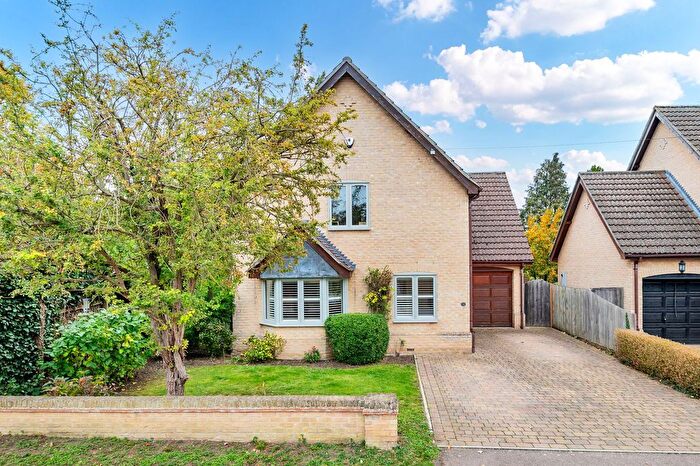
Previously listed properties in Whittlesford
![]()
If you are looking to sell your house, let it out, or receive a property valuation, an expert can help you.
Click the button below to get started.

Roads and Postcodes in Whittlesford
Navigate through our locations to find the location of your next house in Whittlesford, Royston for sale or to rent.
| Streets | Postcodes |
|---|---|
| Brook Road | SG8 7RG |
| Church Street | SG8 7RE |
| Farm Lane | SG8 7RP |
| Foremans Road | SG8 7RA |
| Fowlmere Road | SG8 7QU |
| Gravel Pit Hill | SG8 7HZ |
| Lodge Road | SG8 7RN |
| Lower Street | SG8 7RJ |
| Middle Street | SG8 7RD |
| Pigeons Close | SG8 7RF |
| School Lane | SG8 7RH |
| Sheralds Croft Lane | SG8 7RB |
| The Green | SG8 7QX SG8 7QY SG8 7QZ |
| Thriplow Heath | SG8 7RS |
| SG8 7RR |
Transport near Whittlesford
-
 Foxton Station
 -
Whittlesford Station
-
Shepreth Station
-
Meldreth Station
-
Shelford Station
-
Great Chesterford Station
- FAQ
- Price Paid By Year
- Property Type Price
Frequently asked questions about Whittlesford
What is the average price for a property for sale in Whittlesford?
The average price for a property for sale in Whittlesford is £934,741. This amount is 79% higher than the average price in Royston. There are 12 property listings for sale in Whittlesford.
What streets have the most expensive properties for sale in Whittlesford?
The streets with the most expensive properties for sale in Whittlesford are The Green at an average of £1,750,000, Middle Street at an average of £1,300,000 and Church Street at an average of £1,245,000.
What streets have the most affordable properties for sale in Whittlesford?
The streets with the most affordable properties for sale in Whittlesford are Sheralds Croft Lane at an average of £315,000, School Lane at an average of £466,950 and Pigeons Close at an average of £592,500.
Which train stations are available in or near Whittlesford?
Some of the train stations available in or near Whittlesford are Foxton, Whittlesford and Shepreth.
Property Price Paid in Whittlesford by Year
The average sold property price by year was:
| Year | Average Sold Price | Price Change |
Sold Properties
|
|---|---|---|---|
| 2025 | £736,700 | -50% |
7 Properties |
| 2024 | £1,103,333 | -25% |
3 Properties |
| 2023 | £1,375,000 | 58% |
2 Properties |
| 2022 | £580,000 | -23% |
2 Properties |
| 2021 | £715,214 | -10% |
7 Properties |
| 2020 | £789,400 | -25% |
5 Properties |
| 2019 | £983,000 | -12% |
5 Properties |
| 2018 | £1,101,906 | 32% |
8 Properties |
| 2016 | £750,000 | 20% |
1 Property |
| 2015 | £596,414 | 64% |
8 Properties |
| 2014 | £216,247 | -85% |
2 Properties |
| 2013 | £400,999 | -29% |
5 Properties |
| 2012 | £518,285 | -14% |
7 Properties |
| 2011 | £588,799 | 6% |
5 Properties |
| 2010 | £552,500 | 49% |
6 Properties |
| 2009 | £281,250 | -86% |
2 Properties |
| 2008 | £523,333 | 9% |
3 Properties |
| 2007 | £473,749 | 26% |
12 Properties |
| 2006 | £351,200 | -28% |
5 Properties |
| 2005 | £450,111 | 11% |
9 Properties |
| 2004 | £398,961 | 10% |
13 Properties |
| 2003 | £359,083 | -3% |
6 Properties |
| 2002 | £369,833 | 0,5% |
6 Properties |
| 2001 | £368,125 | 23% |
4 Properties |
| 2000 | £284,600 | 52% |
2 Properties |
| 1999 | £137,266 | -67% |
6 Properties |
| 1998 | £229,900 | 25% |
5 Properties |
| 1997 | £171,750 | 12% |
4 Properties |
| 1996 | £151,350 | -60% |
4 Properties |
| 1995 | £242,000 | - |
3 Properties |
Property Price per Property Type in Whittlesford
Here you can find historic sold price data in order to help with your property search.
The average Property Paid Price for specific property types in the last three years are:
| Property Type | Average Sold Price | Sold Properties |
|---|---|---|
| Semi Detached House | £390,000.00 | 2 Semi Detached Houses |
| Detached House | £1,043,690.00 | 10 Detached Houses |