Houses for sale & to rent in Parson Drove And Wisbech St Mary, Wisbech
House Prices in Parson Drove And Wisbech St Mary
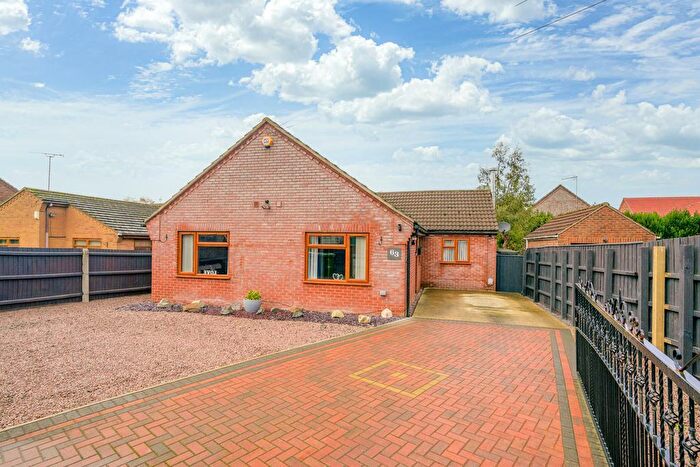
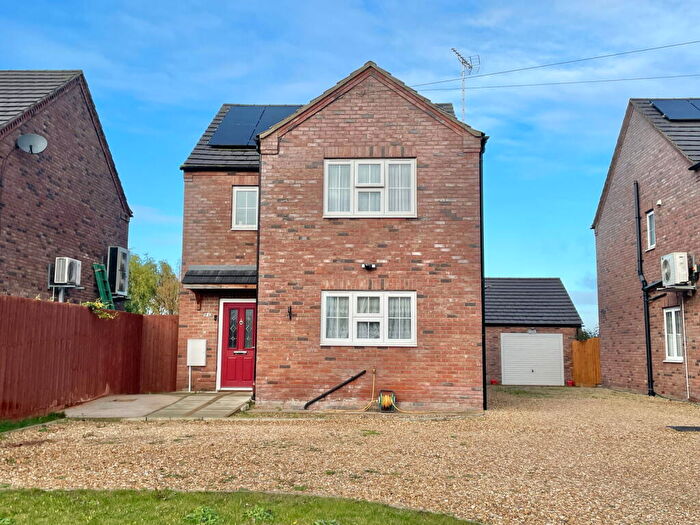
Properties in Parson Drove And Wisbech St Mary have an average house price of £292,332.00 and had 286 Property Transactions within the last 3 years¹.
Parson Drove And Wisbech St Mary is an area in Wisbech, Cambridgeshire with 1,945 households², where the most expensive property was sold for £1,000,000.00.
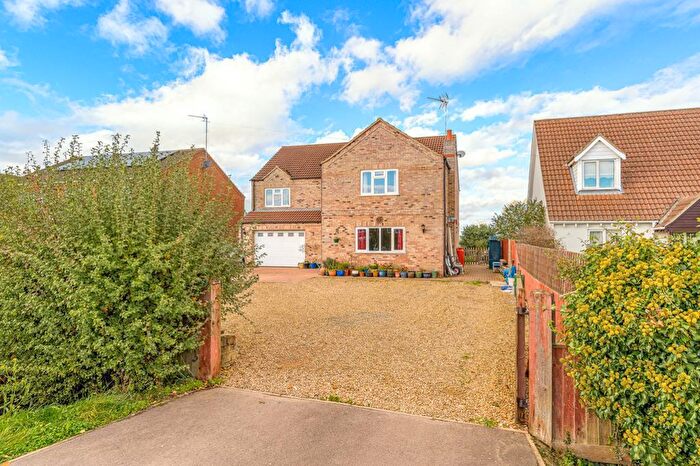
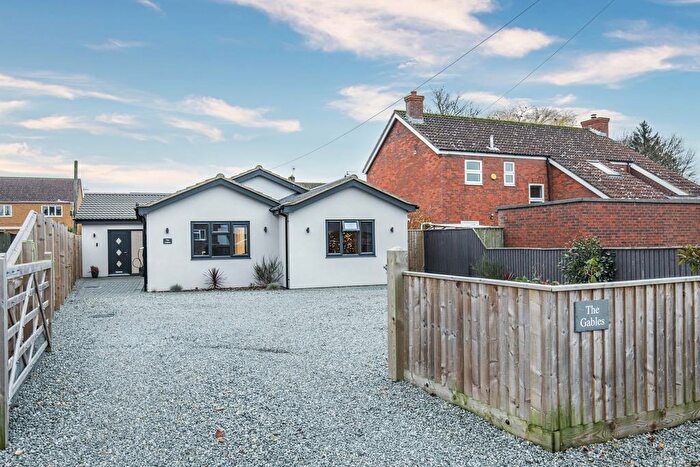
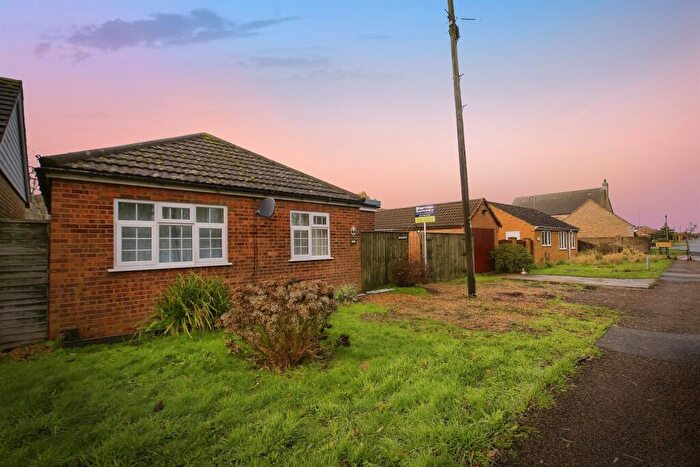
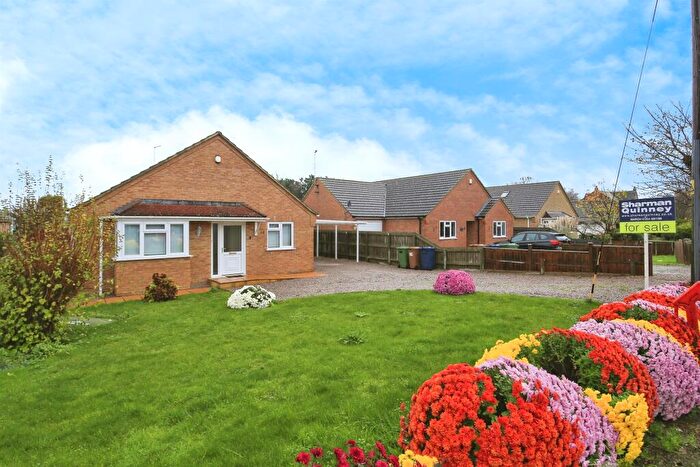
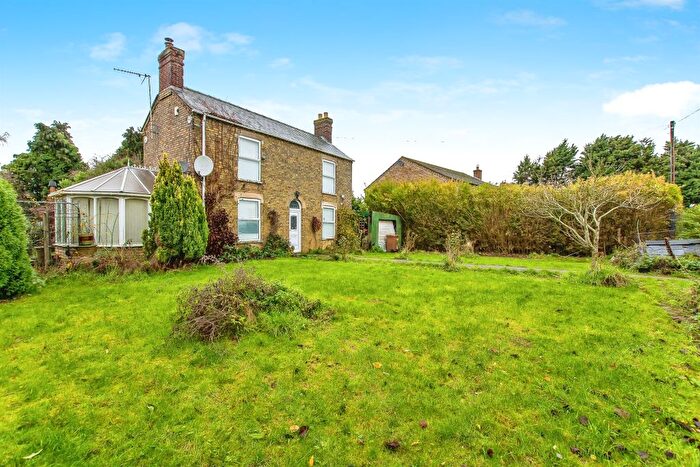
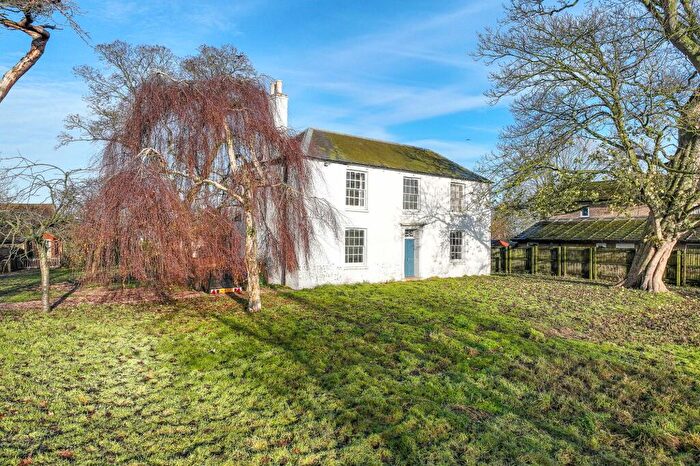
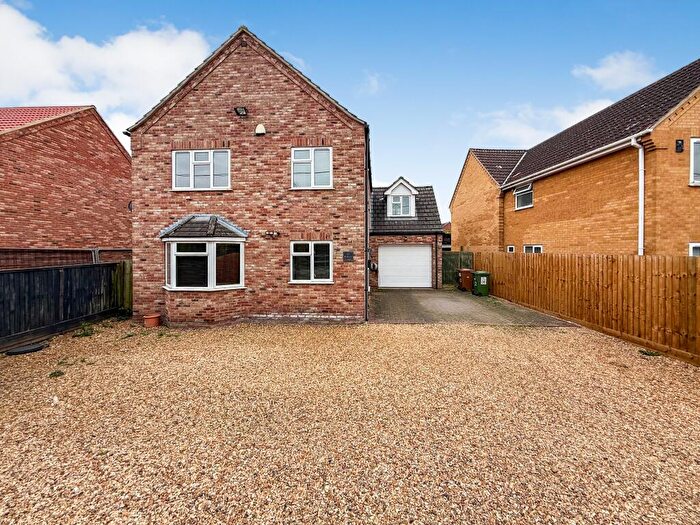
Properties for sale in Parson Drove And Wisbech St Mary
Roads and Postcodes in Parson Drove And Wisbech St Mary
Navigate through our locations to find the location of your next house in Parson Drove And Wisbech St Mary, Wisbech for sale or to rent.
| Streets | Postcodes |
|---|---|
| Back Road | PE13 4JW |
| Beechings Close | PE13 4SS |
| Bevis Lane | PE13 4RR |
| Black Drove | PE13 4BB |
| Brewery Close | PE13 4LW |
| Bridge Drove | PE13 4JR |
| Bunkers Hill | PE13 4SQ |
| Cannon Close | PE13 4RB |
| Cants Drove | PE13 4HN |
| Chapel Avenue | PE13 4RD |
| Chapelfield Road | PE13 4EE |
| Church Road | PE13 4RL PE13 4RN |
| Churchfield Way | PE13 4SY |
| Churchgate | PE13 4XG |
| Council Houses | PE13 4HQ |
| Elbow Lane | PE13 4LG |
| Fen Road | PE13 4AB PE13 4JP |
| Folleys Drove | PE13 4EL |
| Front Road | PE13 4HU PE13 4JQ |
| Galls Drove | PE13 4UF |
| Garden Lane | PE13 4RZ |
| Glebe Gardens | PE13 4EW |
| Gull Drove | PE13 4BH PE13 4BJ |
| Gull Road | PE13 4EP PE13 4ER |
| Harolds Bank | PE13 4PT |
| High Road | PE13 4EA PE13 4ED PE13 4EQ PE13 4RA PE13 4RF PE13 4RG PE13 4RH PE13 4RQ PE13 4SG PE13 4SL PE13 4SW |
| High Side | PE13 4LJ PE13 4SA |
| Hillcrest Drive | PE13 4ET |
| Homelands | PE13 4AJ |
| Hooks Drove | PE13 4HH |
| Ingham Hall Gardens | PE13 4JY |
| Inhams Close | PE13 4HS |
| Jackson Close | PE13 4AP |
| John Bends Way | PE13 4PS |
| Johnsons Drove | PE13 4JS |
| Lakeside Close | PE13 4LL |
| Leverington Common | PE13 5JR |
| Lindens Close | PE13 4AR |
| Long Drove | PE13 4HG PE13 4JT |
| Main Road | PE13 4AU PE13 4JA PE13 4LA PE13 4LF |
| Mayfair Gardens | PE13 4XA |
| Mill Close | PE13 4HX |
| Mill Road | PE13 4HF |
| Mouth Lane | PE13 4EH PE13 4ES PE13 4UG PE13 4UQ |
| Mowbray Close | PE13 4SX |
| Murrow Bank | PE13 4HB PE13 4HD PE13 4HR |
| Murrow Lane | PE13 4JH |
| Nene Close | PE13 4EX |
| New Drove | PE13 4UA |
| Newlands Road | PE13 4LB |
| North Brink | PE13 4UH PE13 4UJ |
| Panswell Lane | PE13 5JS |
| Parnall Road | PE13 4AQ |
| Pentelow Close | PE13 4HT |
| Plash Drove | PE13 4SP |
| Riverbank Close | PE13 4DY |
| Riverside Gardens | PE13 4JX |
| Rummers Lane | PE13 4UB |
| Sandbank | PE13 4SE |
| Sayers Crescent | PE13 4AS |
| School Close | PE13 4ST |
| Seadyke Bank | PE13 4AF |
| Seadyke Road | PE13 4SD |
| Sealeys Lane | PE13 4LD |
| Selwyn Corner | PE13 4EG |
| Silvers Lane | PE13 4JJ PE13 4JL |
| Spencer Drove | PE13 4EU |
| St Audreys Terrace | PE13 4RE |
| St Marys Close | PE13 4RS |
| Station Avenue | PE13 4HE |
| Station Drive | PE13 4RX |
| Station Road | PE13 4HA PE13 4RT PE13 4RW PE13 4RY PE13 4US |
| Swan Bridge | PE13 4JG |
| Swan Gardens | PE13 4HY |
| The Bank | PE13 4JD |
| The Birches | PE13 4QZ |
| The Pigeons | PE13 4JU |
| Thorney Road | PE13 4AA PE13 4AD PE13 4AG |
| Walnut Close | PE13 4SZ |
| Waverley Close | PE13 4EF |
| Whitecroft Bungalows | PE13 4RU |
| Wisbech Road | PE13 4AT |
| Woodhouse Close | PE13 4SF |
| Woodland Gardens | PE13 4EZ |
| Wykes Drive | PE13 4SU |
| Yokine Gardens | PE13 4EY |
Transport near Parson Drove And Wisbech St Mary
-
March Station
-
Whittlesea Station
-
Manea Station
-
Downham Market Station
-
Spalding Station
-
Watlington Station
-
Peterborough Station
- FAQ
- Price Paid By Year
- Property Type Price
Frequently asked questions about Parson Drove And Wisbech St Mary
What is the average price for a property for sale in Parson Drove And Wisbech St Mary?
The average price for a property for sale in Parson Drove And Wisbech St Mary is £292,332. This amount is 27% higher than the average price in Wisbech. There are 1,034 property listings for sale in Parson Drove And Wisbech St Mary.
What streets have the most expensive properties for sale in Parson Drove And Wisbech St Mary?
The streets with the most expensive properties for sale in Parson Drove And Wisbech St Mary are Gull Drove at an average of £617,500, Woodland Gardens at an average of £600,000 and Harolds Bank at an average of £600,000.
What streets have the most affordable properties for sale in Parson Drove And Wisbech St Mary?
The streets with the most affordable properties for sale in Parson Drove And Wisbech St Mary are Homelands at an average of £87,250, Bridge Drove at an average of £110,000 and Sandbank at an average of £158,316.
Which train stations are available in or near Parson Drove And Wisbech St Mary?
Some of the train stations available in or near Parson Drove And Wisbech St Mary are March, Whittlesea and Manea.
Property Price Paid in Parson Drove And Wisbech St Mary by Year
The average sold property price by year was:
| Year | Average Sold Price | Price Change |
Sold Properties
|
|---|---|---|---|
| 2025 | £266,042 | -15% |
45 Properties |
| 2024 | £305,633 | 1% |
56 Properties |
| 2023 | £301,097 | 4% |
89 Properties |
| 2022 | £288,771 | 3% |
96 Properties |
| 2021 | £280,921 | 13% |
132 Properties |
| 2020 | £244,727 | 5% |
79 Properties |
| 2019 | £233,165 | 4% |
95 Properties |
| 2018 | £223,374 | -3% |
118 Properties |
| 2017 | £230,459 | 17% |
101 Properties |
| 2016 | £190,757 | 8% |
115 Properties |
| 2015 | £175,617 | 12% |
101 Properties |
| 2014 | £154,220 | -7% |
120 Properties |
| 2013 | £164,442 | 13% |
85 Properties |
| 2012 | £143,233 | -3% |
65 Properties |
| 2011 | £147,210 | -7% |
68 Properties |
| 2010 | £156,839 | 2% |
72 Properties |
| 2009 | £154,163 | -22% |
73 Properties |
| 2008 | £187,406 | 6% |
70 Properties |
| 2007 | £175,414 | 4% |
134 Properties |
| 2006 | £168,186 | 5% |
125 Properties |
| 2005 | £159,110 | 6% |
132 Properties |
| 2004 | £149,617 | 10% |
100 Properties |
| 2003 | £134,244 | 17% |
101 Properties |
| 2002 | £110,757 | 20% |
127 Properties |
| 2001 | £88,673 | 13% |
100 Properties |
| 2000 | £77,426 | 14% |
82 Properties |
| 1999 | £66,460 | 10% |
75 Properties |
| 1998 | £60,009 | 18% |
86 Properties |
| 1997 | £49,297 | 20% |
115 Properties |
| 1996 | £39,622 | -10% |
49 Properties |
| 1995 | £43,523 | - |
62 Properties |
Property Price per Property Type in Parson Drove And Wisbech St Mary
Here you can find historic sold price data in order to help with your property search.
The average Property Paid Price for specific property types in the last three years are:
| Property Type | Average Sold Price | Sold Properties |
|---|---|---|
| Semi Detached House | £212,256.00 | 76 Semi Detached Houses |
| Detached House | £331,067.00 | 193 Detached Houses |
| Terraced House | £210,565.00 | 17 Terraced Houses |

