
Houses for sale in Wisbech, Cambridgeshire
House Prices in Wisbech
Properties in Wisbech have an average house price of £225k and had 1,600 Property Transactions within the last 3 years.¹
Wisbech is an area in Cambridgeshire with 18,013 households², where the most expensive property was sold for £978k.
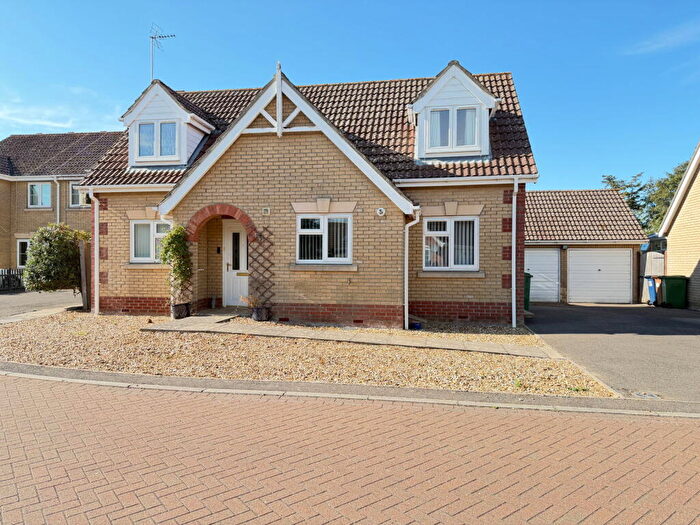
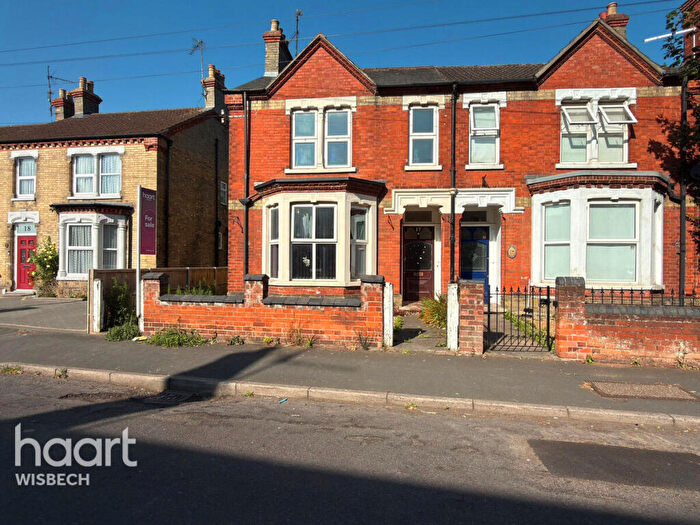
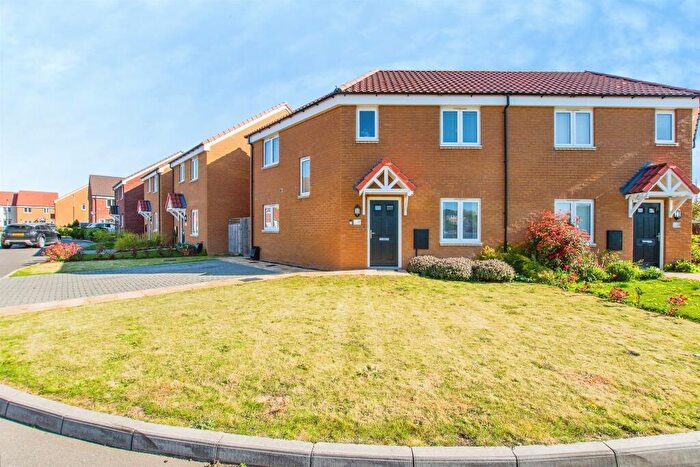
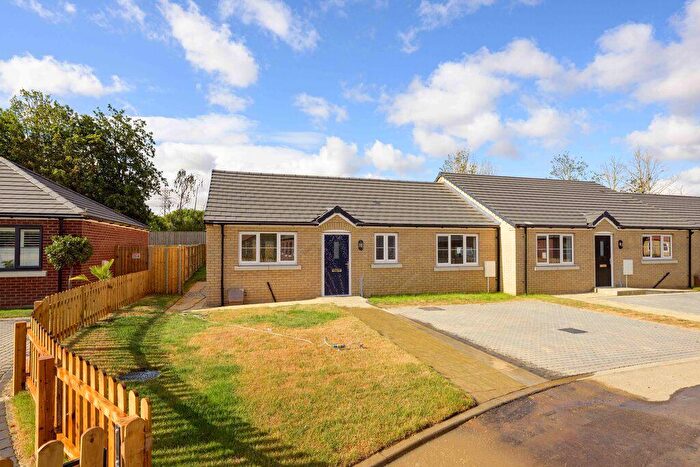
Properties for sale in Wisbech
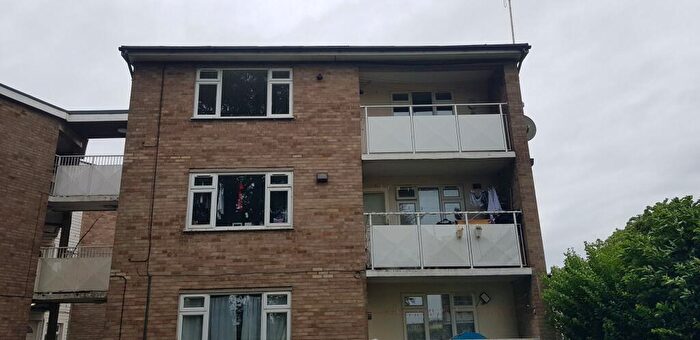

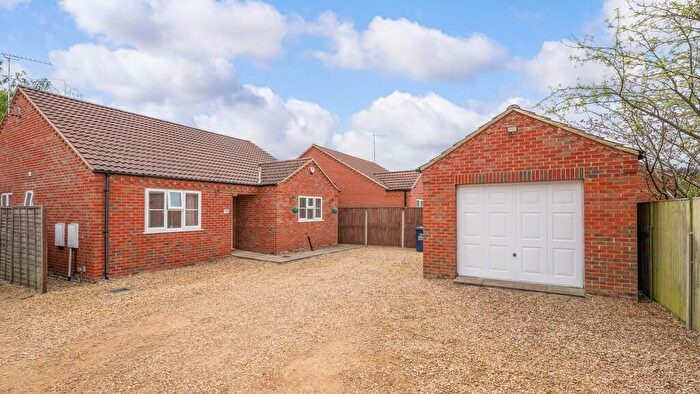
![]()
If you are looking to sell your house, let it out, or receive a property valuation, an expert can help you.
Click the button below to get started.
Neighbourhoods in Wisbech
Navigate through our locations to find the location of your next house in Wisbech, Cambridgeshire for sale or to rent.
- Clarkson
- Elm And Christchurch
- Hill
- Kirkgate
- Littleport West
- Manea
- March East
- March North
- Medworth
- Parson Drove And Wisbech St Mary
- Peckover
- Roman Bank
- Staithe
- Waterlees
- Octavia Hill
- Waterlees Village
- Parson Drove & Wisbech St Mary
- Elm & Christchurch
- Wisbech Riverside
- Wisbech Walsoken & Waterlees
- Leverington & Wisbech Rural
- Wisbech South
Property price trends in Wisbech
According to the latest Land Registry data, the average home in Wisbech sold for £208,175 in 2026. That figure comes from a substantial record of 23,056 sales logged over the past 31 years.
Prices have fallen back over the last three years. Compared with 2023, when the typical sale came in around £230,656, that's a fall of roughly 9.7%.
Looking back five years, average prices are down about 9.6% since 2021, a drop of around £22,074 in cash terms.
Zoom out to the past decade for the fuller picture. Back in 2016, homes here averaged £168,355, so the typical sold price has climbed about 23.7% since then, roughly 2.1% a year. Stretch the view to fifteen years and that annual pace edges up closer to 2.9%.
Frequently asked questions about Wisbech
What is the average price for a property for sale in Wisbech?
The average price for a property for sale in Wisbech is £224,679. This amount is 43% lower than the average price in Cambridgeshire. There are more than 10,000 property listings for sale in Wisbech.
What locations have the most expensive properties for sale in Wisbech?
The locations with the most expensive properties for sale in Wisbech are March East at an average of £630,000, Elm & Christchurch at an average of £566,817 and March North at an average of £359,250.
What locations have the most affordable properties for sale in Wisbech?
The locations with the most affordable properties for sale in Wisbech are Waterlees Village at an average of £128,500, Waterlees at an average of £164,405 and Medworth at an average of £183,822.
Which train stations are available in or near Wisbech?
Some of the train stations available in or near Wisbech are March, Downham Market and Watlington.
Property Price Paid in Wisbech by Year
The average sold property price by year was:
| Year | Average Sold Price | Price Change |
Sold Properties
|
|---|---|---|---|
| 2026 | £208,175 | -8% |
37 Properties |
| 2025 | £224,533 | 2% |
509 Properties |
| 2024 | £220,122 | -5% |
533 Properties |
| 2023 | £230,656 | -5% |
521 Properties |
| 2022 | £241,992 | 5% |
717 Properties |
| 2021 | £230,249 | 6% |
886 Properties |
| 2020 | £216,530 | 11% |
550 Properties |
| 2019 | £192,772 | 4% |
733 Properties |
| 2018 | £184,800 | -1% |
789 Properties |
| 2017 | £187,143 | 10% |
791 Properties |
Property Price per Property Type in Wisbech
Here you can find historic sold price data in order to help with your property search.
The average Property Paid Price for specific property types in the last three years are:
| Property Type | Average Sold Price | Sold Properties |
|---|---|---|
| Semi Detached House | £187,030.00 | 501 Semi Detached Houses |
| Terraced House | £149,907.00 | 300 Terraced Houses |
| Detached House | £291,707.00 | 741 Detached Houses |
| Flat | £80,301.00 | 58 Flats |
Transport in Wisbech
Please see below transportation links in this area:
