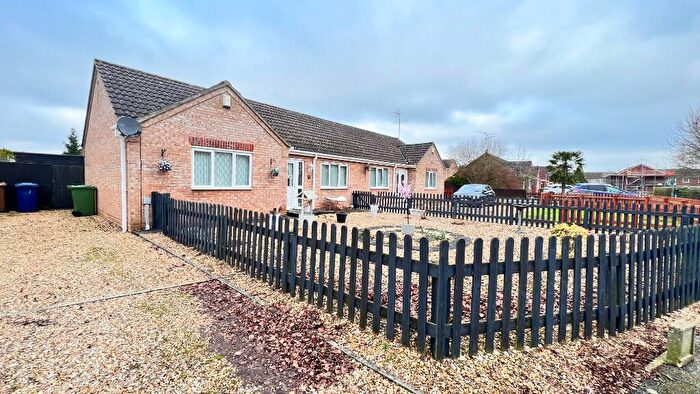
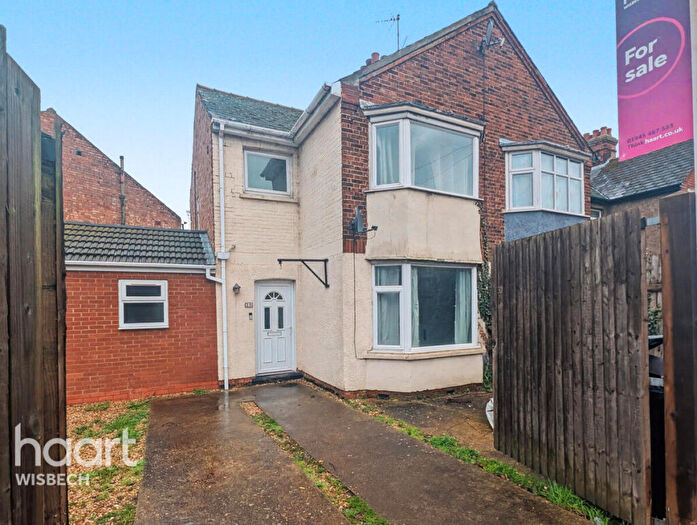
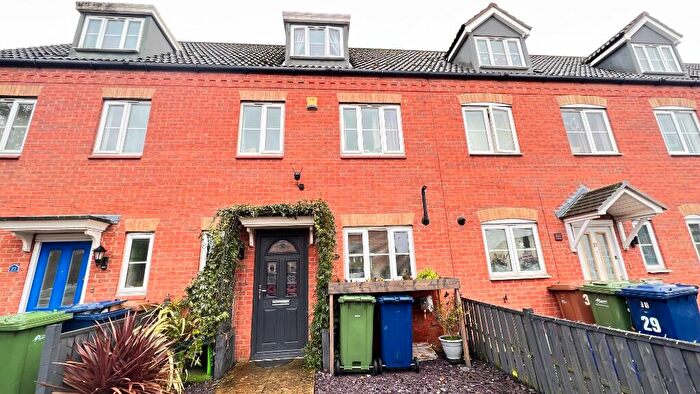
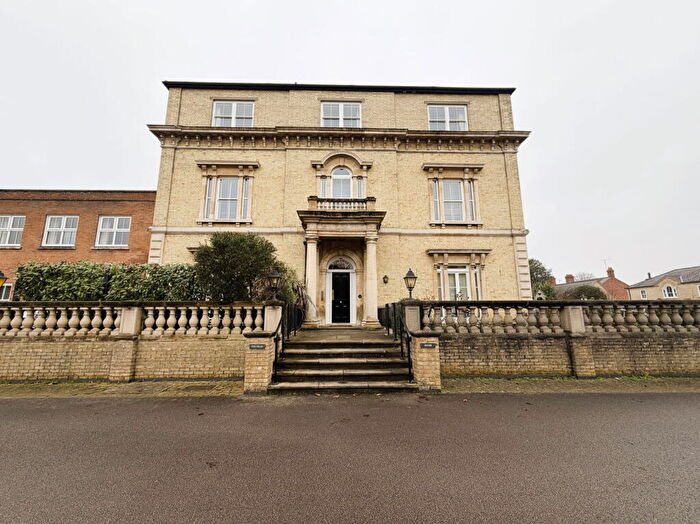
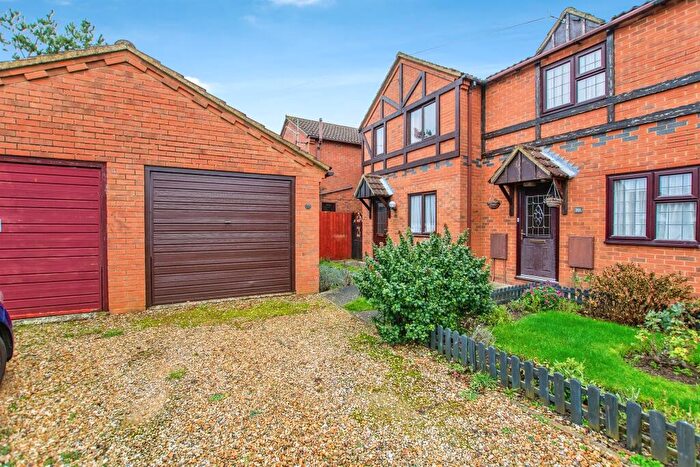
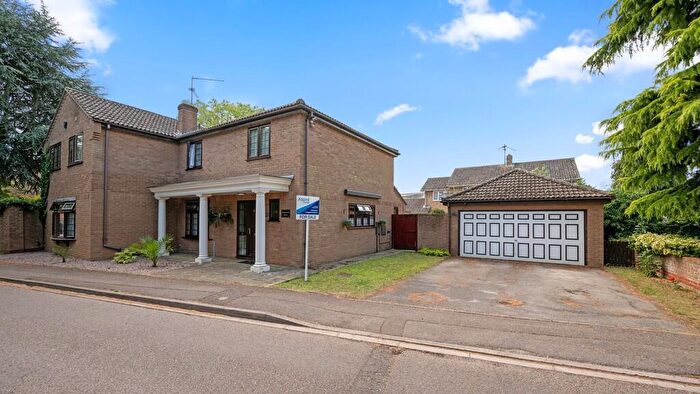
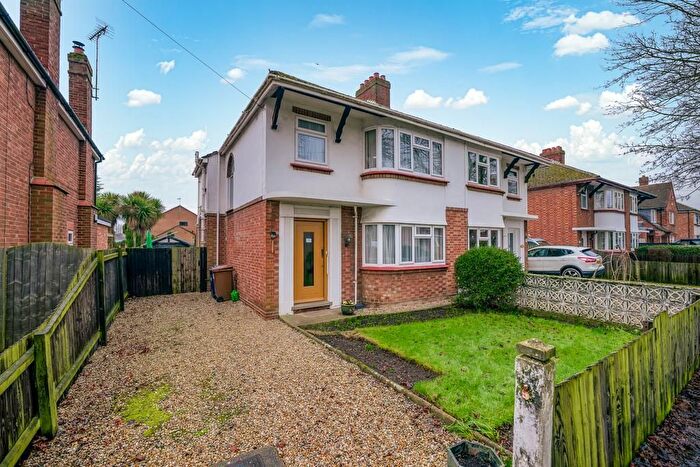
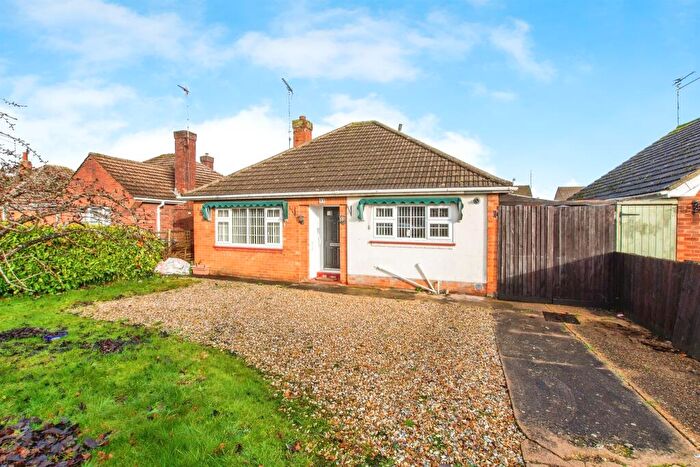
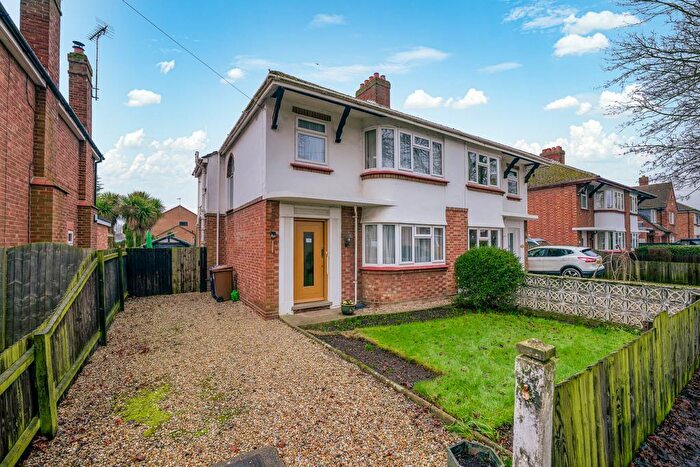
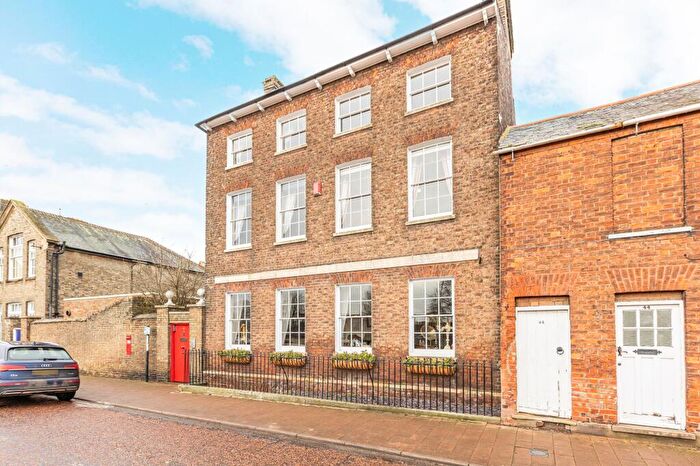
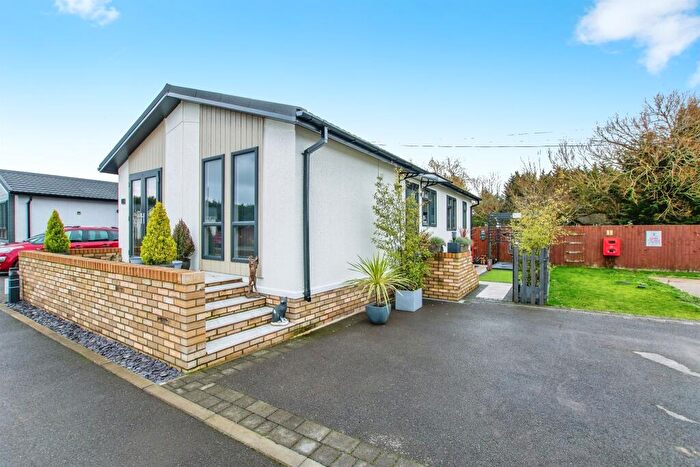
Houses for sale & to rent in Peckover, Wisbech
House Prices in Peckover
Properties in Peckover have an average house price of £270,340.00 and had 88 Property Transactions within the last 3 years¹.
Peckover is an area in Wisbech, Cambridgeshire with 1,002 households², where the most expensive property was sold for £935,000.00.
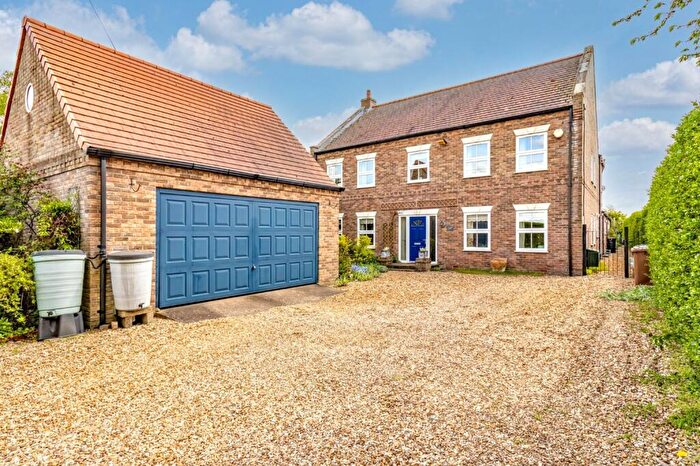
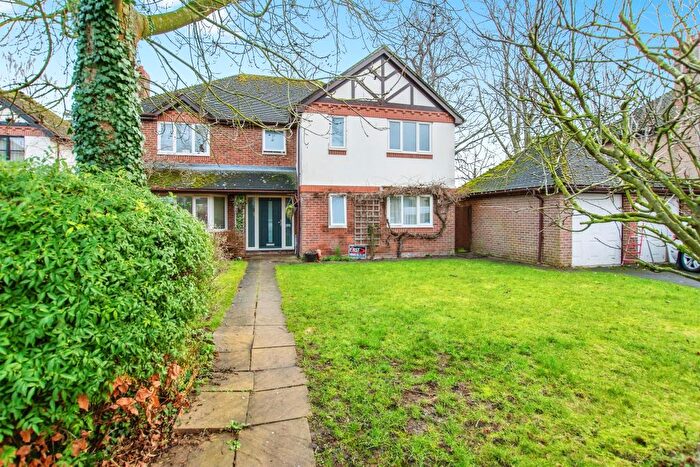
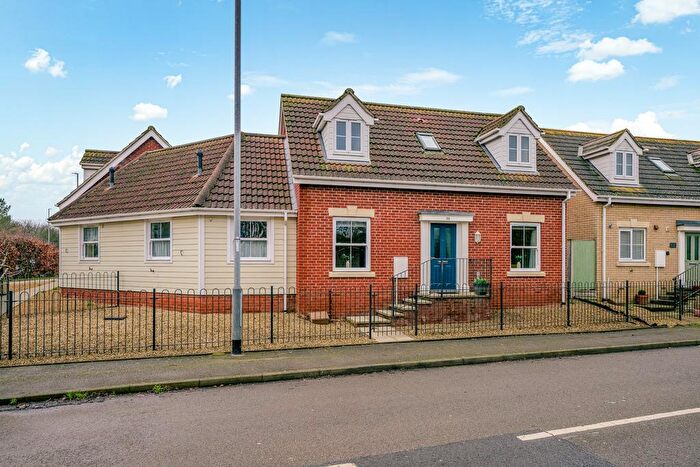
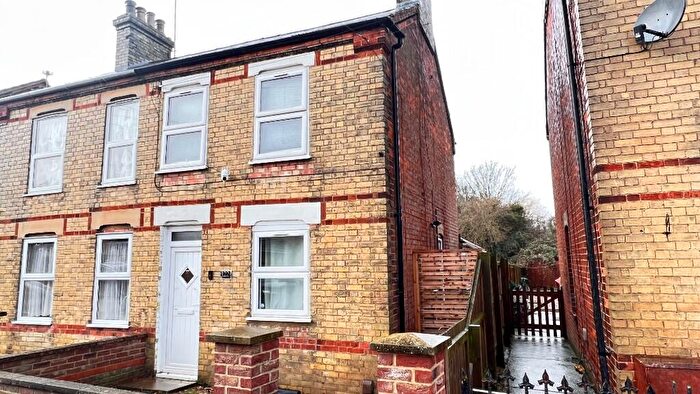
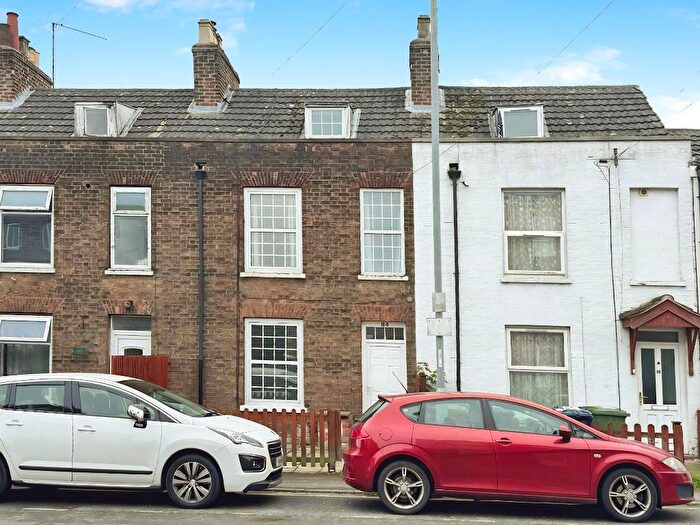
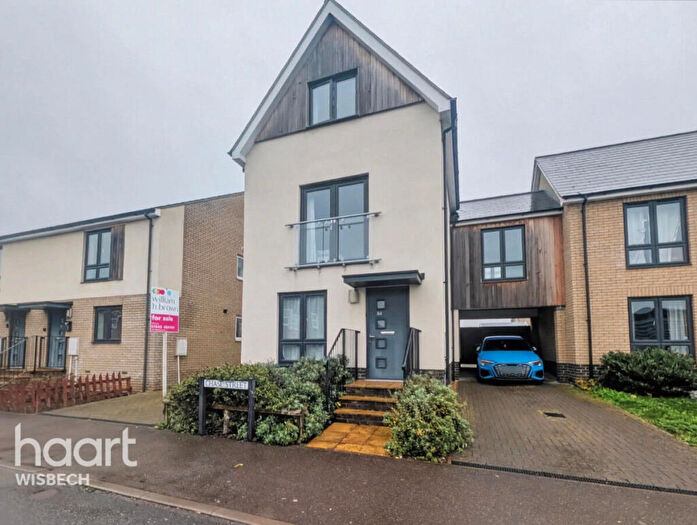
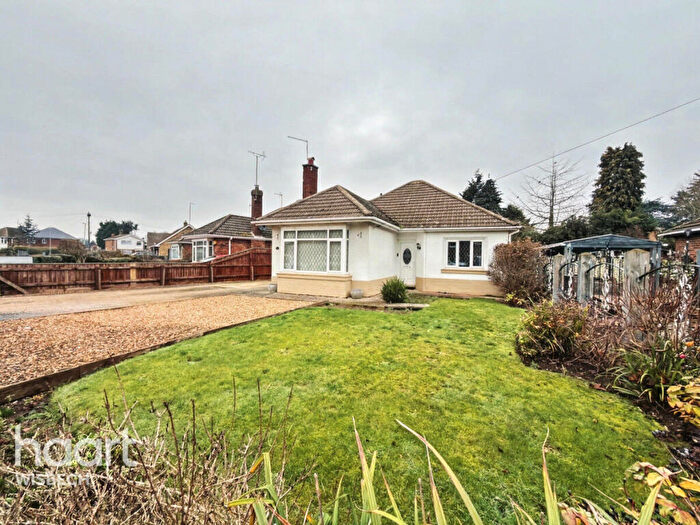
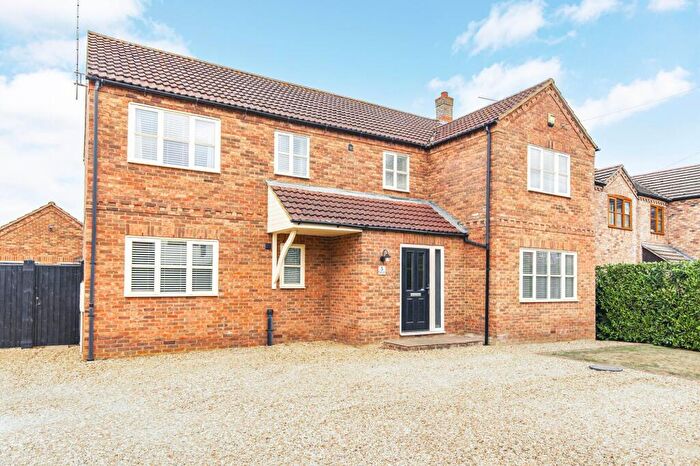
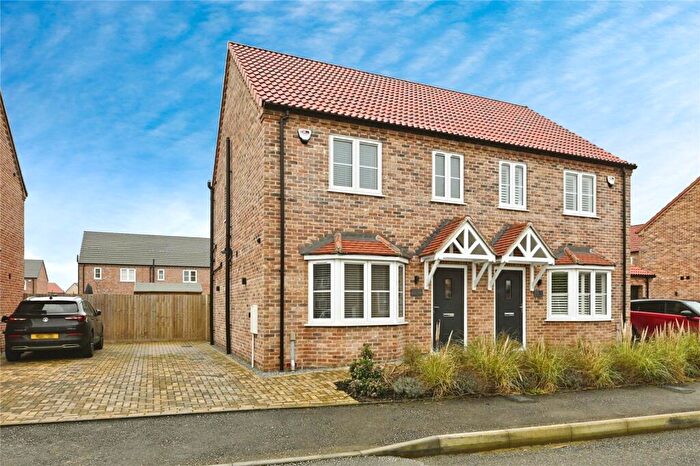
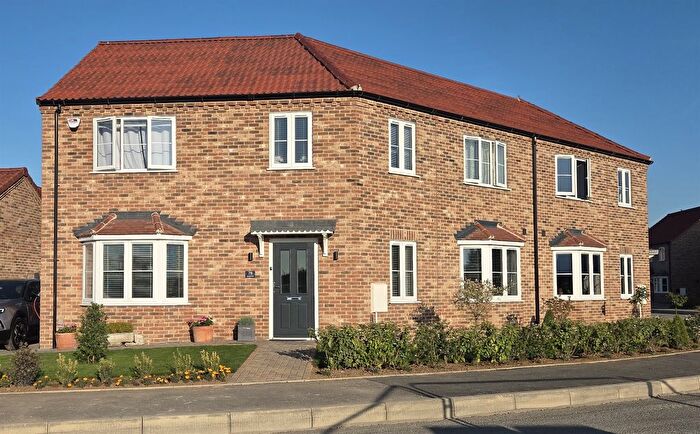
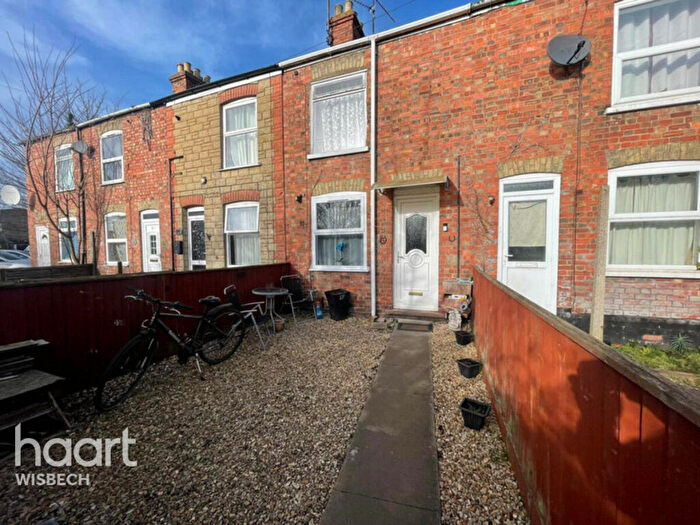
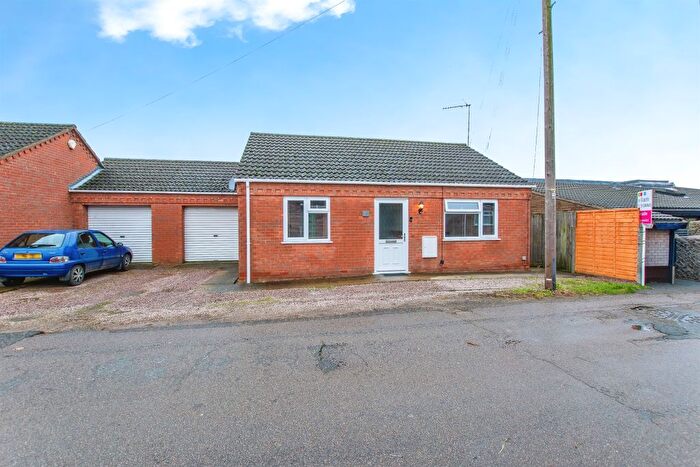
Properties for sale in Peckover
Roads and Postcodes in Peckover
Navigate through our locations to find the location of your next house in Peckover, Wisbech for sale or to rent.
| Streets | Postcodes |
|---|---|
| Ashdale Park | PE13 1JH |
| Barton Green | PE13 4UP |
| Barton Road | PE13 1LB PE13 1LE PE13 4RP PE13 4TF PE13 4TG PE13 4TL PE13 4TP PE13 4TE PE13 4TH PE13 4TW |
| Bevis Lane | PE13 4TY PE13 4TZ |
| Brampton Close | PE13 1LU |
| Bruce Court | PE13 1RW |
| Burcroft Road | PE13 1PW |
| Cambridge Drive | PE13 1SE |
| Cattle Market Chase | PE13 1RD |
| Chapel Road | PE13 1RF PE13 1RG PE13 1RH |
| Cornhill | PE13 1NA |
| Coxs Lane | PE13 4TB PE13 4TD |
| Cricketers Way | PE13 1RN |
| Cross Lane | PE13 4TX |
| Exchange Square | PE13 1RA |
| Gadds Lane | PE13 4TJ PE13 5BL |
| Grange Road | PE13 1SF |
| Grove Park | PE13 1LF |
| Harecroft Road | PE13 1RL PE13 1RS PE13 1RJ PE13 1RR |
| Leverington Road | PE13 1PH PE13 1PJ PE13 1PL PE13 1RT PE13 1TL |
| Lords Lane | PE13 4TU |
| Magazine Close | PE13 1LH |
| Magazine Lane | PE13 1LG PE13 1LJ |
| Manor Gardens | PE13 1LP |
| Marlborough Court | PE13 1LT |
| Miletree Lane | PE13 4TR |
| North Brink | PE13 1JR PE13 1JX PE13 1LL PE13 1LN PE13 4TA PE13 4TT PE13 4UN PE13 1JT PE13 1JU PE13 1LW PE13 4TS |
| North End | PE13 1PE PE13 1AZ PE13 1BF |
| North Street | PE13 1NP PE13 1NR |
| Northend | PE13 1TH |
| Octagon Drive | PE13 1SB |
| Oilmill Lane | PE13 1NW |
| Old Market | PE13 1NB PE13 1NF PE13 1NJ PE13 1NN |
| Panswell Lane | PE13 4TN PE13 5JT |
| Pedley Lane | PE13 1SN |
| Pickards Way | PE13 1SD |
| Purbeck Close | PE13 1LS |
| Richmond Court | PE13 1LR |
| Rose Walk | PE13 1SG |
| Sandy Lane | PE13 4QX |
| Sandyland | PE13 1NX |
| Sovereign Close | PE13 1SH |
| Strawberry Close | PE13 1SQ |
| Summerfield Close | PE13 1RP |
| The Lawns | PE13 1SW |
| The Water Gardens | PE13 1LD |
| Tower Gardens | PE13 1LA |
| Wares Cottages | PE13 1LQ |
| West Parade | PE13 1PP PE13 1QB PE13 1QD |
| Woodcote Park | PE13 1LX |
| PE13 1NE |
Transport near Peckover
-
March Station
-
Watlington Station
-
Downham Market Station
-
Manea Station
-
King's Lynn Station
-
Whittlesea Station
- FAQ
- Price Paid By Year
- Property Type Price
Frequently asked questions about Peckover
What is the average price for a property for sale in Peckover?
The average price for a property for sale in Peckover is £270,340. This amount is 20% higher than the average price in Wisbech. There are 2,679 property listings for sale in Peckover.
What streets have the most expensive properties for sale in Peckover?
The streets with the most expensive properties for sale in Peckover are North Brink at an average of £438,750, Woodcote Park at an average of £420,000 and Barton Road at an average of £405,625.
What streets have the most affordable properties for sale in Peckover?
The streets with the most affordable properties for sale in Peckover are North End at an average of £88,000, Burcroft Road at an average of £141,300 and Oilmill Lane at an average of £142,275.
Which train stations are available in or near Peckover?
Some of the train stations available in or near Peckover are March, Watlington and Downham Market.
Property Price Paid in Peckover by Year
The average sold property price by year was:
| Year | Average Sold Price | Price Change |
Sold Properties
|
|---|---|---|---|
| 2025 | £225,569 | -29% |
18 Properties |
| 2024 | £291,575 | 6% |
30 Properties |
| 2023 | £274,560 | 8% |
40 Properties |
| 2022 | £251,476 | -17% |
41 Properties |
| 2021 | £293,223 | 13% |
53 Properties |
| 2020 | £253,972 | 10% |
35 Properties |
| 2019 | £229,219 | 5% |
42 Properties |
| 2018 | £217,279 | -0,2% |
44 Properties |
| 2017 | £217,613 | 3% |
49 Properties |
| 2016 | £211,300 | 21% |
48 Properties |
| 2015 | £166,017 | 11% |
42 Properties |
| 2014 | £148,414 | 5% |
60 Properties |
| 2013 | £141,134 | -8% |
26 Properties |
| 2012 | £152,071 | -1% |
28 Properties |
| 2011 | £153,559 | -25% |
33 Properties |
| 2010 | £192,687 | 9% |
16 Properties |
| 2009 | £174,517 | 3% |
28 Properties |
| 2008 | £168,499 | 11% |
23 Properties |
| 2007 | £150,590 | -7% |
49 Properties |
| 2006 | £161,500 | 7% |
68 Properties |
| 2005 | £150,779 | 20% |
34 Properties |
| 2004 | £121,122 | -11% |
73 Properties |
| 2003 | £134,222 | 34% |
59 Properties |
| 2002 | £88,989 | 14% |
65 Properties |
| 2001 | £76,687 | 12% |
68 Properties |
| 2000 | £67,195 | -2% |
61 Properties |
| 1999 | £68,515 | 19% |
47 Properties |
| 1998 | £55,218 | 10% |
65 Properties |
| 1997 | £49,921 | -23% |
47 Properties |
| 1996 | £61,551 | 4% |
49 Properties |
| 1995 | £59,339 | - |
35 Properties |
Property Price per Property Type in Peckover
Here you can find historic sold price data in order to help with your property search.
The average Property Paid Price for specific property types in the last three years are:
| Property Type | Average Sold Price | Sold Properties |
|---|---|---|
| Semi Detached House | £190,625.00 | 12 Semi Detached Houses |
| Detached House | £363,704.00 | 49 Detached Houses |
| Terraced House | £151,139.00 | 21 Terraced Houses |
| Flat | £84,500.00 | 6 Flats |

