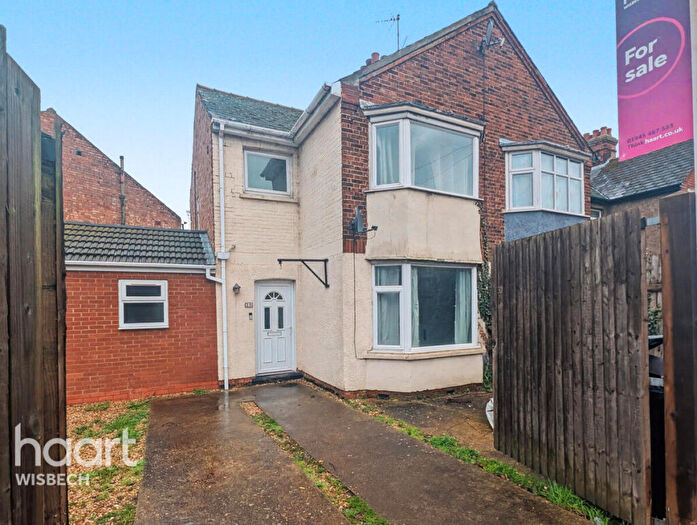
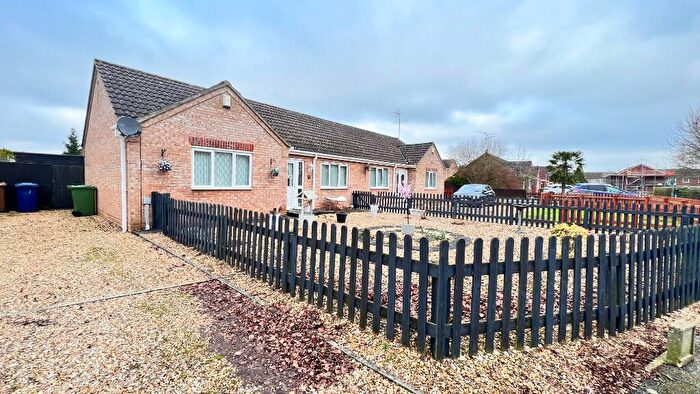
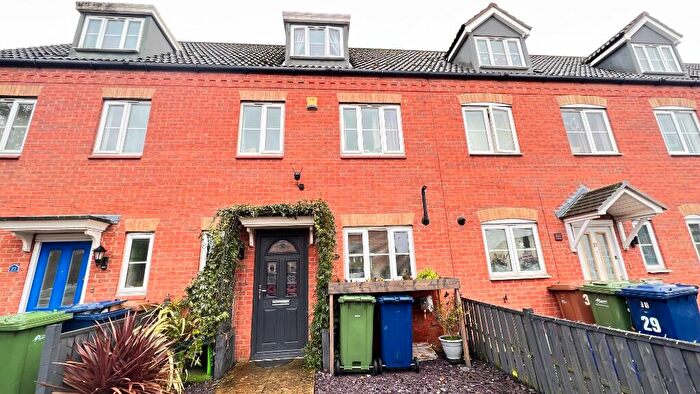
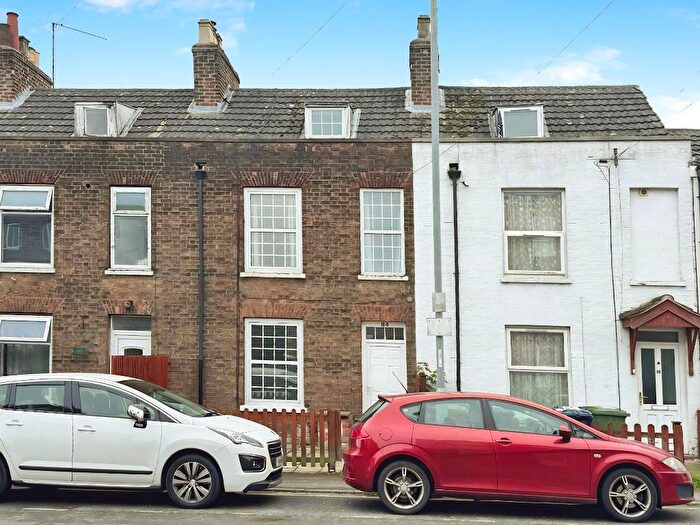
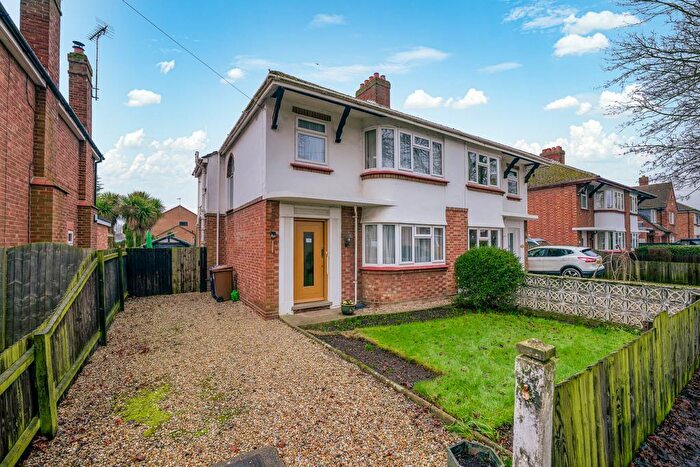
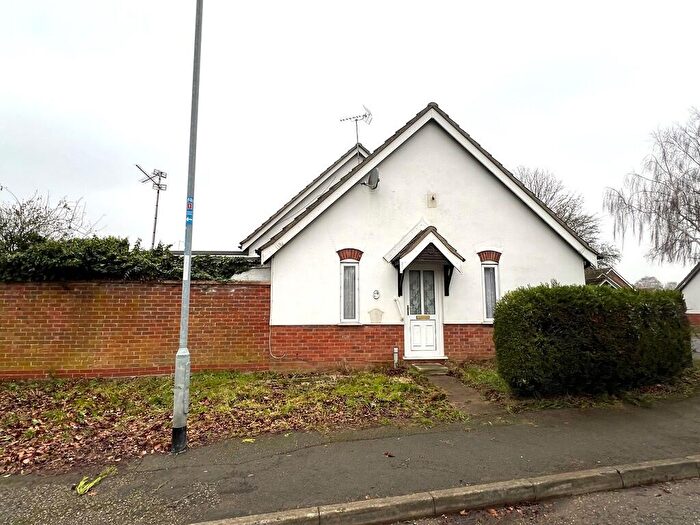
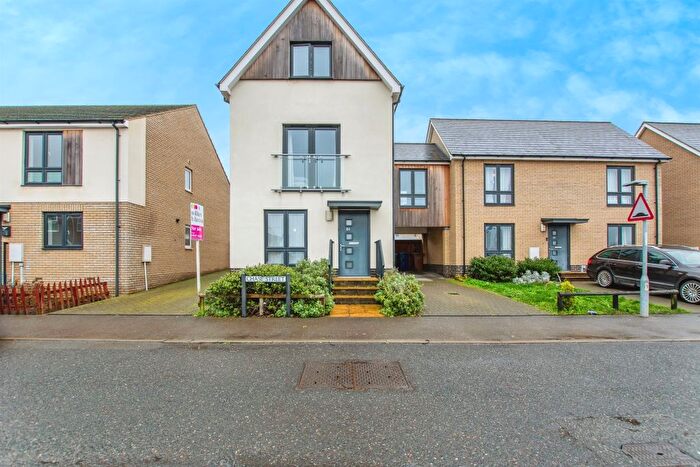
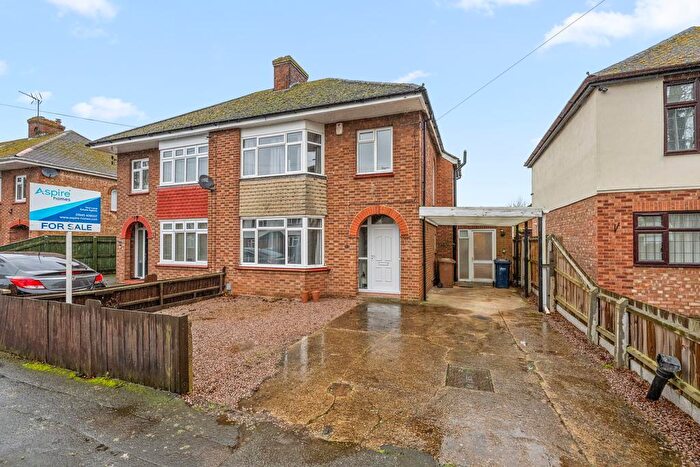
Houses for sale & to rent in Clarkson, Wisbech
House Prices in Clarkson
Properties in Clarkson have an average house price of £184,093.00 and had 87 Property Transactions within the last 3 years¹.
Clarkson is an area in Wisbech, Cambridgeshire with 952 households², where the most expensive property was sold for £670,000.00.
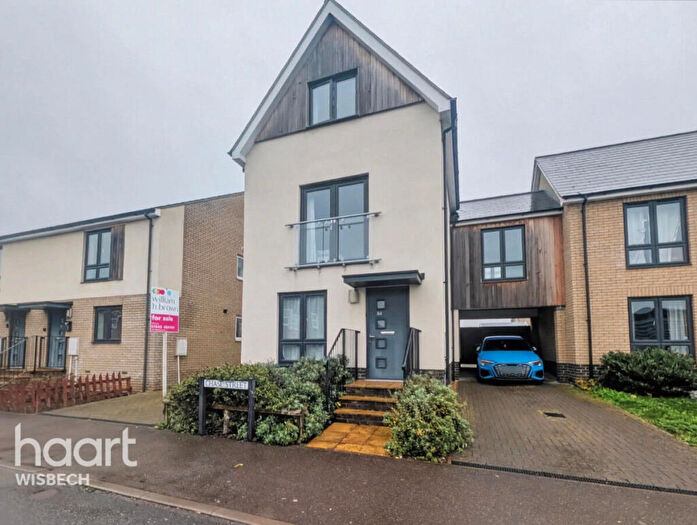
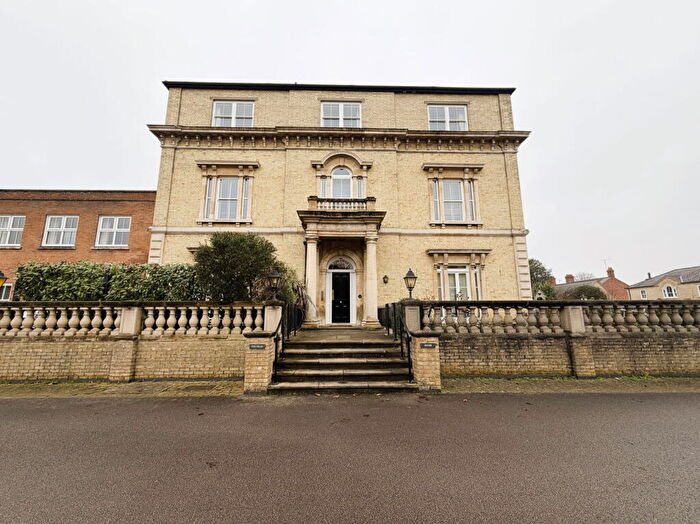
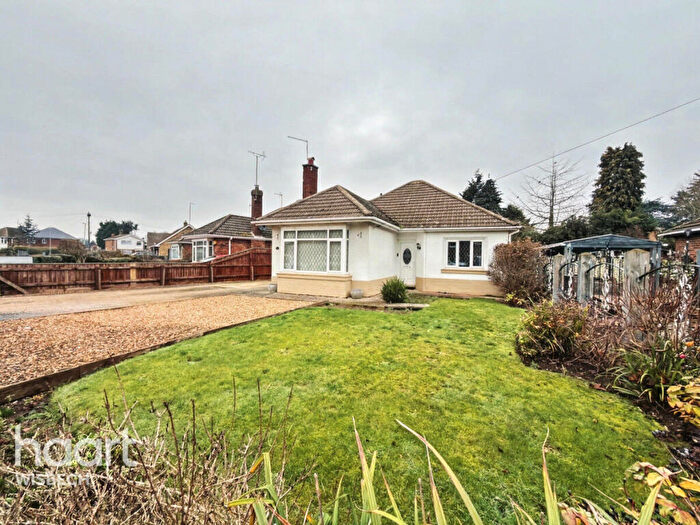
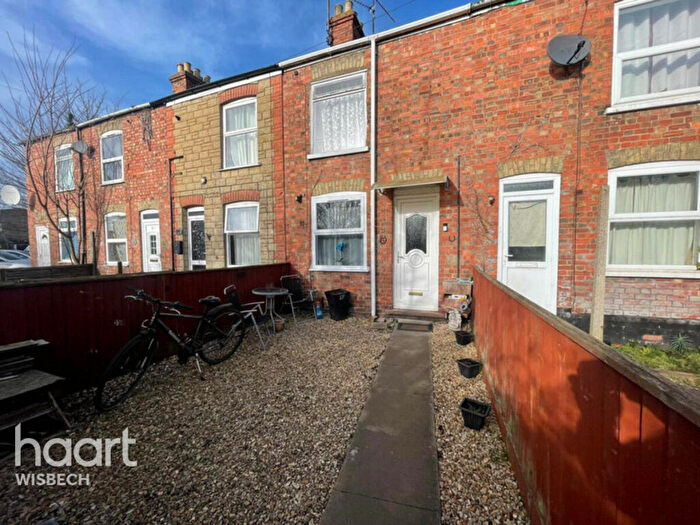
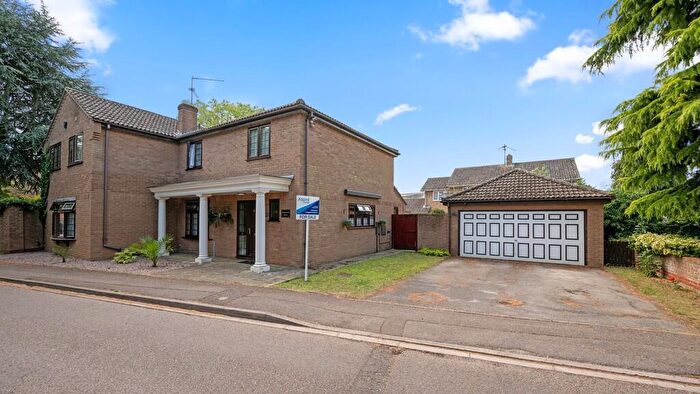
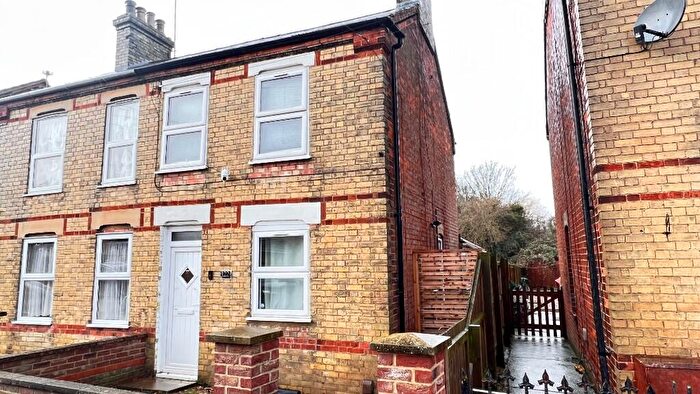
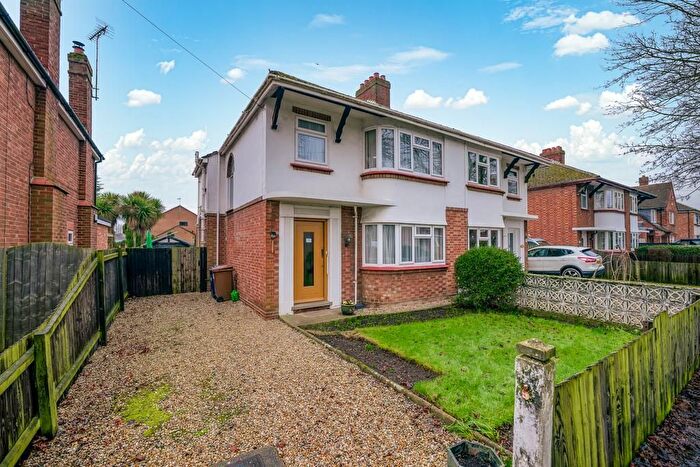
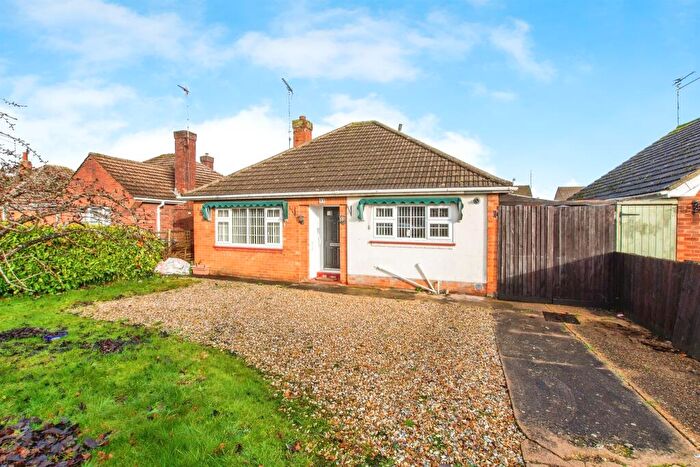
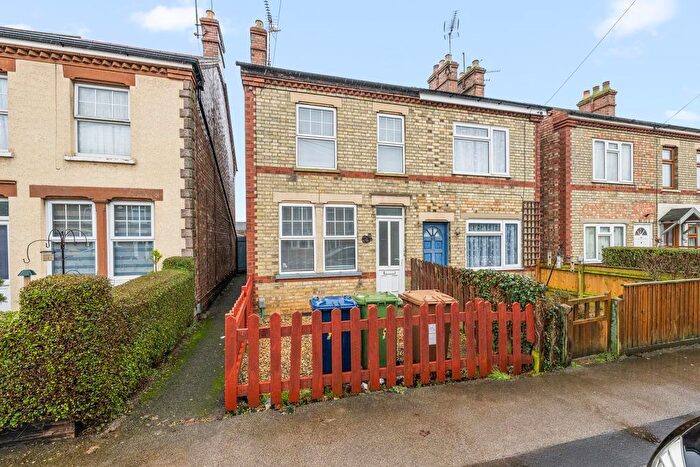
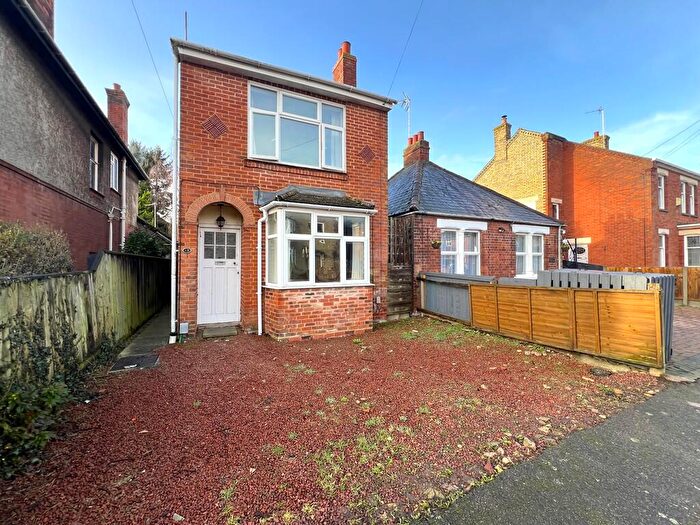
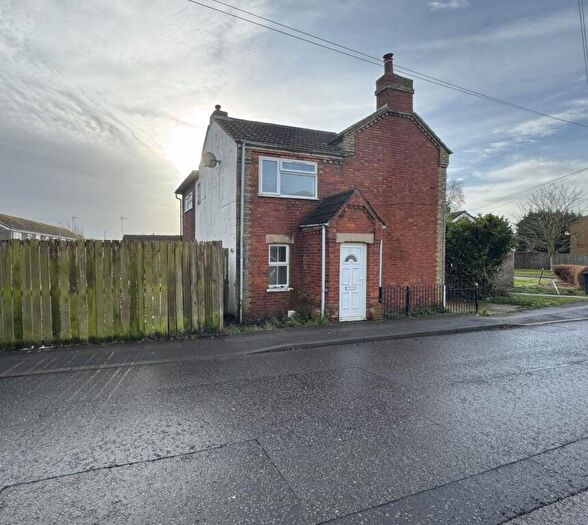
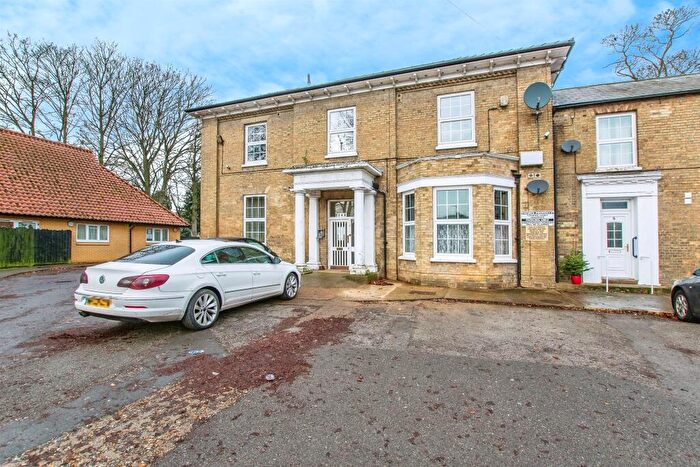
Properties for sale in Clarkson
Roads and Postcodes in Clarkson
Navigate through our locations to find the location of your next house in Clarkson, Wisbech for sale or to rent.
| Streets | Postcodes |
|---|---|
| Albany Road | PE13 3AY PE13 3AX |
| Balding Close | PE13 2AH PE13 2BE PE13 2BY |
| Bannisters Row | PE13 3HZ |
| Bedford Street | PE13 3BN |
| Blencowe Terrace | PE13 2DP |
| Bowthorpe Hall Gardens | PE13 2HF |
| Bowthorpe Road | PE13 2DH PE13 2DX |
| Brigstock Road | PE13 3JL |
| Chase Street | PE13 3AU PE13 3AE PE13 3AS |
| Churchill Road | PE13 2BZ PE13 3BJ |
| Clarkson Avenue | PE13 2EA PE13 2EF PE13 2EG PE13 2EH PE13 2EQ |
| Colvile Road | PE13 2EL PE13 2ET |
| Cotterell Way | PE13 3BL |
| De Havilland Road | PE13 3AN PE13 3AP PE13 3AL |
| Ettie Close | PE13 3BG |
| Hampden Road | PE13 2EZ |
| Harbour Square | PE13 3BH |
| Henry Street | PE13 3AG |
| Hereward Road | PE13 2HA |
| Kenlan Road | PE13 3DR |
| King Street | PE13 2HB PE13 2HE |
| Legion Walk | PE13 2DS |
| Lewellen Terrace | PE13 3AT |
| Lynn Road | PE13 3DB PE13 3DD PE13 3DE PE13 3DH PE13 3DJ PE13 3DL PE13 3DS PE13 3DW PE13 3DX PE13 3DG PE13 3DQ |
| Marsh Walk | PE13 2DR |
| Mill Close | PE13 3BD |
| Mount Pleasant Road | PE13 3NF PE13 3NQ |
| Nelson Gardens | PE13 2EW |
| Nene Parade | PE13 3BB PE13 3BT PE13 3BU PE13 3BX PE13 3BY |
| Norwich Road | PE13 2AD PE13 2AU PE13 2BB PE13 2BD PE13 3TA PE13 3TE PE13 3UX |
| Oakroyd Crescent | PE13 3AR |
| Ogden Gardens | PE13 3FE |
| Opportune Road | PE13 3AW |
| Palmers Place | PE13 2AJ |
| Park Avenue | PE13 3AQ |
| Park Road | PE13 2DT |
| Park Street | PE13 2AR |
| Queen Street | PE13 3YB |
| Silver Street | PE13 3XE |
| St Augustines Road | PE13 3AH PE13 3AD PE13 3GE PE13 3UZ |
| St Dominic Close | PE13 3AF |
| Sybil Road | PE13 3NG |
| Tavistock Road | PE13 2DY PE13 2EN PE13 2EP PE13 2ER |
| The Park | PE13 3AB |
| Townshend Road | PE13 3DN |
| Trafalgar Court | PE13 3BP |
| Trafford Road | PE13 2EJ |
| Verdun Road | PE13 2DU |
| Wellington Terrace | PE13 2AW |
| Whitby Street | PE13 3BE |
| Wilberforce Road | PE13 2EU PE13 2EX PE13 2EY |
| William Road | PE13 2AA |
| York Terrace | PE13 3AZ |
| PE13 3FF |
Transport near Clarkson
- FAQ
- Price Paid By Year
- Property Type Price
Frequently asked questions about Clarkson
What is the average price for a property for sale in Clarkson?
The average price for a property for sale in Clarkson is £184,093. This amount is 19% lower than the average price in Wisbech. There are 1,994 property listings for sale in Clarkson.
What streets have the most expensive properties for sale in Clarkson?
The streets with the most expensive properties for sale in Clarkson are Lynn Road at an average of £373,333, Townshend Road at an average of £340,000 and Bowthorpe Road at an average of £278,500.
What streets have the most affordable properties for sale in Clarkson?
The streets with the most affordable properties for sale in Clarkson are Wellington Terrace at an average of £66,000, King Street at an average of £75,750 and Mill Close at an average of £97,958.
Which train stations are available in or near Clarkson?
Some of the train stations available in or near Clarkson are March, Watlington and Downham Market.
Property Price Paid in Clarkson by Year
The average sold property price by year was:
| Year | Average Sold Price | Price Change |
Sold Properties
|
|---|---|---|---|
| 2025 | £183,794 | 16% |
17 Properties |
| 2024 | £154,376 | -38% |
34 Properties |
| 2023 | £212,300 | 18% |
36 Properties |
| 2022 | £173,289 | -18% |
44 Properties |
| 2021 | £203,955 | 10% |
56 Properties |
| 2020 | £183,294 | 7% |
34 Properties |
| 2019 | £169,620 | 2% |
58 Properties |
| 2018 | £165,669 | 1% |
63 Properties |
| 2017 | £164,657 | 27% |
68 Properties |
| 2016 | £120,880 | -4% |
67 Properties |
| 2015 | £126,035 | -16% |
42 Properties |
| 2014 | £146,392 | 5% |
28 Properties |
| 2013 | £139,129 | 7% |
17 Properties |
| 2012 | £129,185 | 4% |
20 Properties |
| 2011 | £124,613 | 5% |
22 Properties |
| 2010 | £117,818 | -4% |
27 Properties |
| 2009 | £122,666 | 2% |
31 Properties |
| 2008 | £119,761 | -13% |
44 Properties |
| 2007 | £135,463 | 3% |
70 Properties |
| 2006 | £131,442 | 6% |
65 Properties |
| 2005 | £123,240 | 4% |
48 Properties |
| 2004 | £117,746 | 24% |
64 Properties |
| 2003 | £89,475 | 10% |
60 Properties |
| 2002 | £80,426 | 14% |
86 Properties |
| 2001 | £69,468 | 32% |
86 Properties |
| 2000 | £46,947 | 6% |
60 Properties |
| 1999 | £44,187 | 7% |
40 Properties |
| 1998 | £41,283 | 11% |
48 Properties |
| 1997 | £36,889 | 10% |
53 Properties |
| 1996 | £33,337 | -19% |
42 Properties |
| 1995 | £39,686 | - |
25 Properties |
Property Price per Property Type in Clarkson
Here you can find historic sold price data in order to help with your property search.
The average Property Paid Price for specific property types in the last three years are:
| Property Type | Average Sold Price | Sold Properties |
|---|---|---|
| Semi Detached House | £198,904.00 | 41 Semi Detached Houses |
| Detached House | £295,357.00 | 14 Detached Houses |
| Terraced House | £129,790.00 | 25 Terraced Houses |
| Flat | £68,752.00 | 7 Flats |

