
Houses for sale & to rent in Shakerley, Crewe
House Prices in Shakerley
Properties in Shakerley have an average house price of £685k and had 13 Property Transactions within the last 3 years¹.
Shakerley is an area in Crewe, Cheshire with 85 households², where the most expensive property was sold for £1.19M.
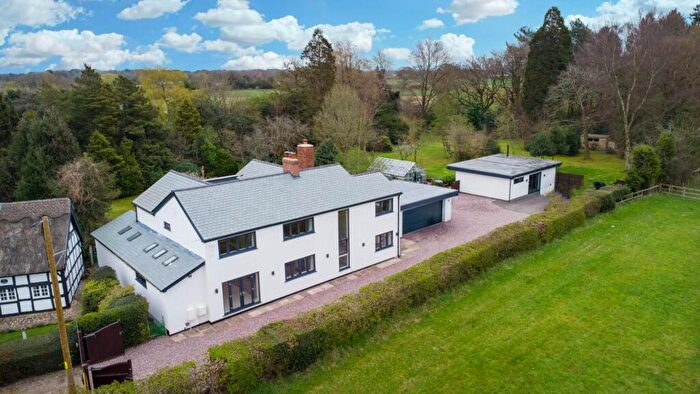
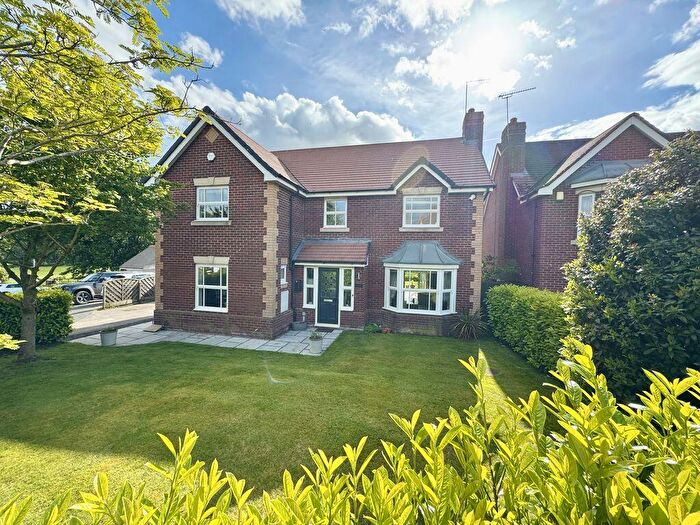
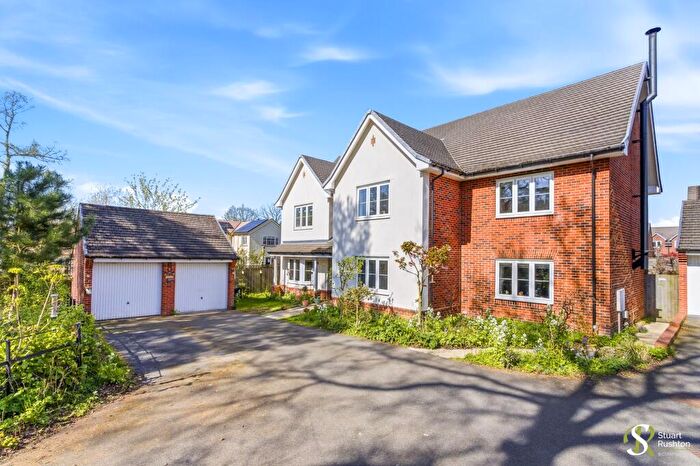
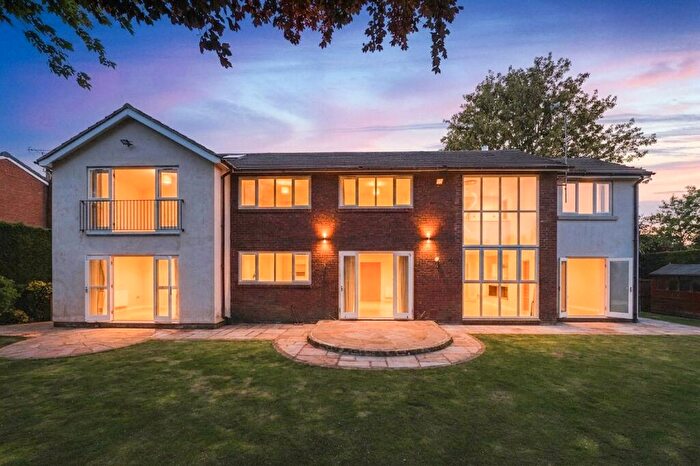
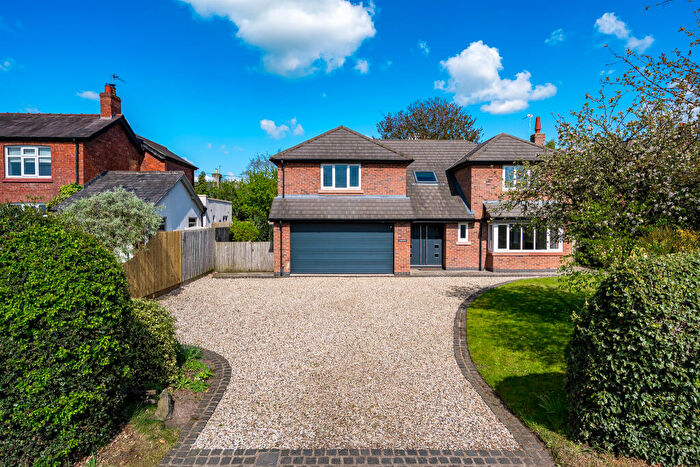
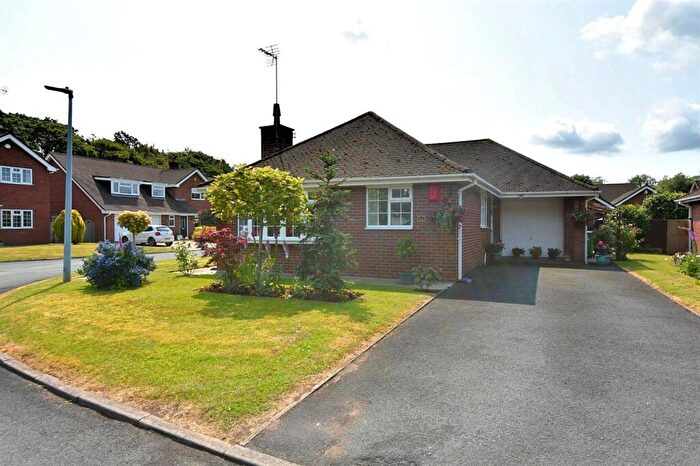
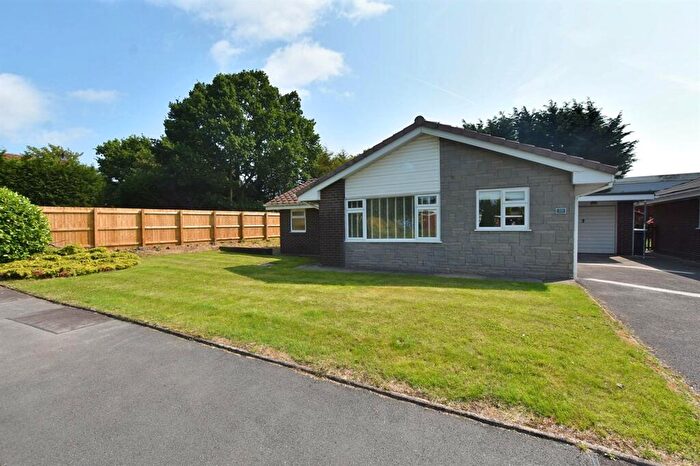
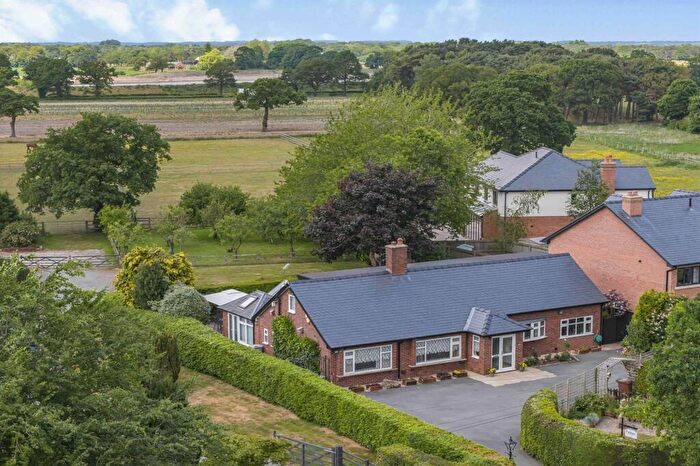
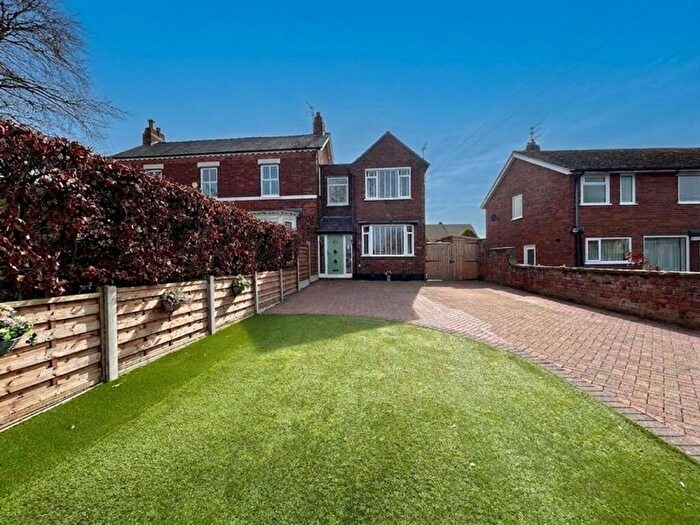
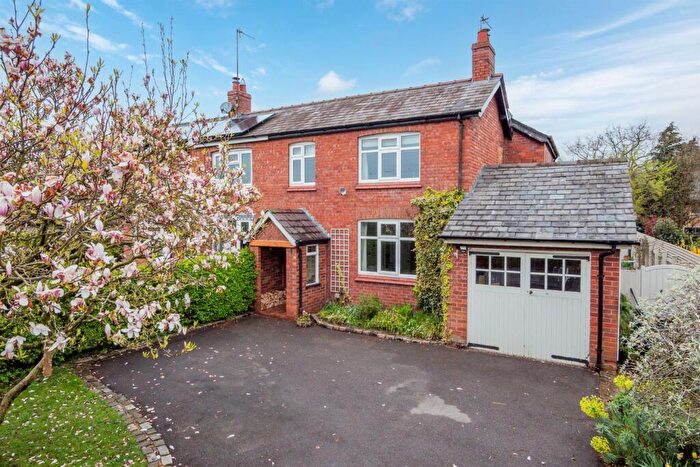
Properties for sale in Shakerley
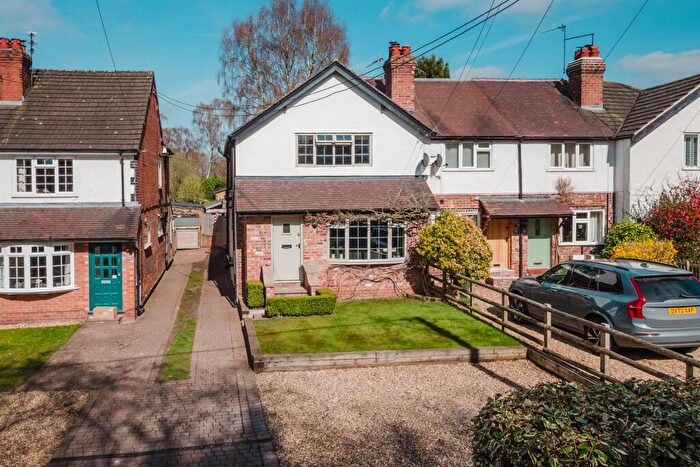
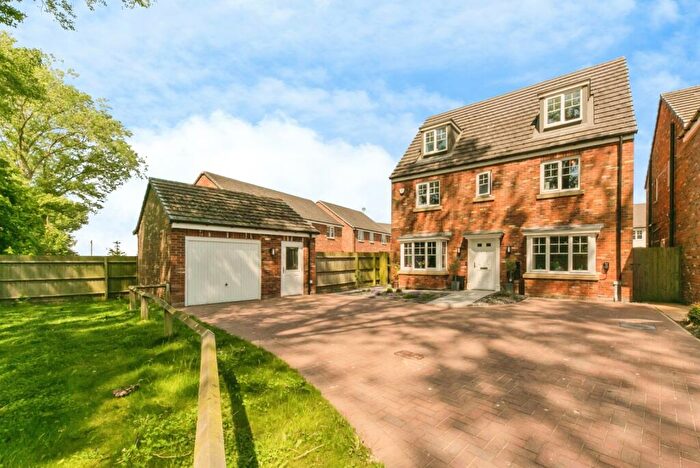
![]()
If you are looking to sell your house, let it out, or receive a property valuation, an expert can help you.
Click the button below to get started.
Roads and Postcodes in Shakerley
Navigate through our locations to find the location of your next house in Shakerley, Crewe for sale or to rent.
| Streets | Postcodes |
|---|---|
| Birch Fold | CW4 8NR |
| Blackberry Gardens | CW4 8FU |
| Brereton Lane | CW4 7LR |
| Broad Lane | CW4 7LT CW4 7LU |
| Donington Grove | CW4 8GN |
| Harrison Drive | CW4 8NP |
| Holmes Chapel Road | CW4 7LP CW4 7LW |
| Knutsford Road | CW4 8HT |
| London Road | CW4 8NQ |
| New Platt Lane | CW4 8NN CW4 8NL |
| Poolford Lane | CW4 7LX |
| Sproston Green | CW4 7LN |
| Wren Avenue | CW4 7LS |
Transport near Shakerley

- FAQ
- Price Paid By Year
- Property Type Price
Frequently asked questions about Shakerley
What is the average price for a property for sale in Shakerley?
The average price for a property for sale in Shakerley is £685,461. This amount is 197% higher than the average price in Crewe. There are 730 property listings for sale in Shakerley.
What streets have the most expensive properties for sale in Shakerley?
The streets with the most expensive properties for sale in Shakerley are Harrison Drive at an average of £878,750 and Holmes Chapel Road at an average of £642,500.
What streets have the most affordable properties for sale in Shakerley?
The streets with the most affordable properties for sale in Shakerley are Birch Fold at an average of £386,000 and Blackberry Gardens at an average of £620,833.
Which train stations are available in or near Shakerley?
Some of the train stations available in or near Shakerley are Holmes Chapel, Goostrey and Sandbach.
Property Price Paid in Shakerley by Year
The average sold property price by year was:
| Year | Average Sold Price | Price Change |
Sold Properties
|
|---|---|---|---|
| 2025 | £718,214 | 0,3% |
7 Properties |
| 2024 | £715,875 | 29% |
4 Properties |
| 2023 | £510,000 | -153% |
2 Properties |
| 2022 | £1,291,250 | 45% |
4 Properties |
| 2021 | £711,818 | -4% |
11 Properties |
| 2020 | £740,000 | 54% |
2 Properties |
| 2019 | £340,000 | 7% |
1 Property |
| 2018 | £315,806 | -34% |
8 Properties |
| 2017 | £423,892 | -5% |
24 Properties |
| 2016 | £443,385 | -20% |
18 Properties |
| 2015 | £532,000 | 20% |
5 Properties |
| 2014 | £424,250 | -92% |
4 Properties |
| 2013 | £815,000 | 85% |
1 Property |
| 2012 | £121,750 | -512% |
2 Properties |
| 2011 | £745,000 | 66% |
2 Properties |
| 2010 | £253,750 | -435% |
2 Properties |
| 2009 | £1,358,333 | 60% |
3 Properties |
| 2008 | £537,500 | 43% |
2 Properties |
| 2007 | £306,750 | 47% |
3 Properties |
| 2006 | £161,333 | -122% |
3 Properties |
| 2005 | £357,691 | 15% |
5 Properties |
| 2004 | £304,000 | 30% |
3 Properties |
| 2003 | £211,750 | 33% |
4 Properties |
| 2002 | £141,300 | 12% |
5 Properties |
| 2001 | £124,100 | -11% |
5 Properties |
| 2000 | £138,000 | 26% |
5 Properties |
| 1999 | £102,737 | 49% |
4 Properties |
| 1998 | £52,000 | -22% |
1 Property |
| 1997 | £63,500 | 26% |
2 Properties |
| 1996 | £47,087 | -52% |
4 Properties |
| 1995 | £71,666 | - |
3 Properties |
Property Price per Property Type in Shakerley
Here you can find historic sold price data in order to help with your property search.
The average Property Paid Price for specific property types in the last three years are:
| Property Type | Average Sold Price | Sold Properties |
|---|---|---|
| Semi Detached House | £365,500.00 | 2 Semi Detached Houses |
| Terraced House | £240,000.00 | 1 Terraced House |
| Detached House | £794,000.00 | 10 Detached Houses |