
Houses for sale in Shakerley, Middlewich
House Prices in Shakerley
Properties in Shakerley have an average house price of £710k and had 5 Property Transactions within the last 3 years¹.
Shakerley is an area in Middlewich, Cheshire with 117 households², where the most expensive property was sold for £1.05M.
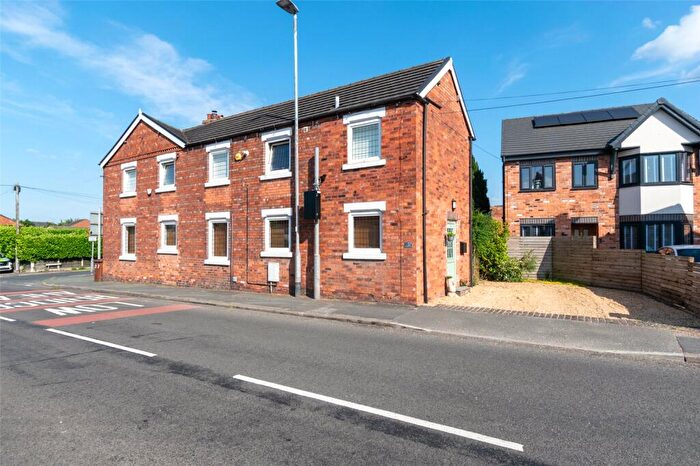
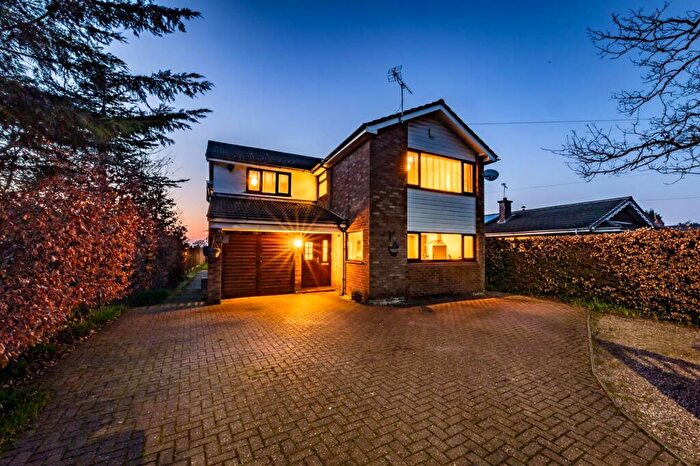
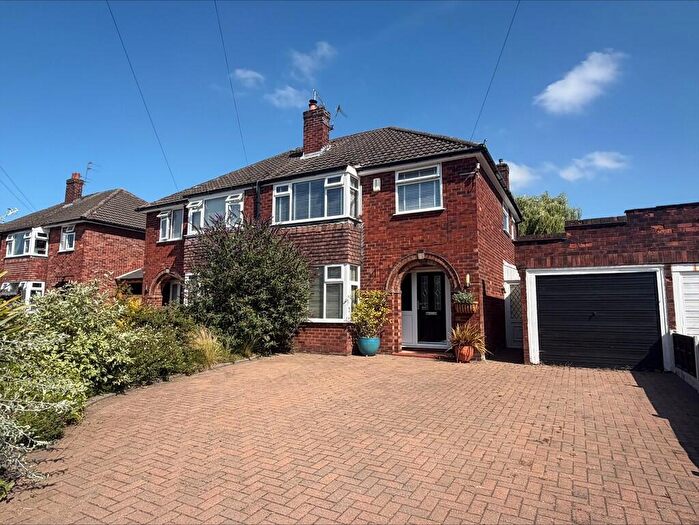
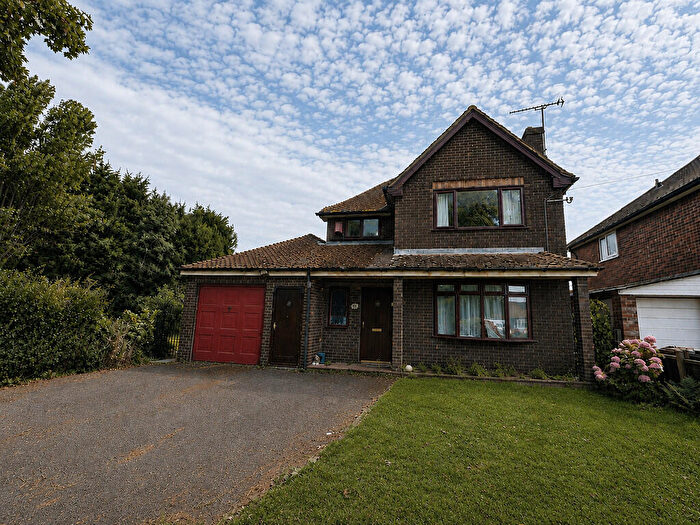
Properties for sale in Shakerley
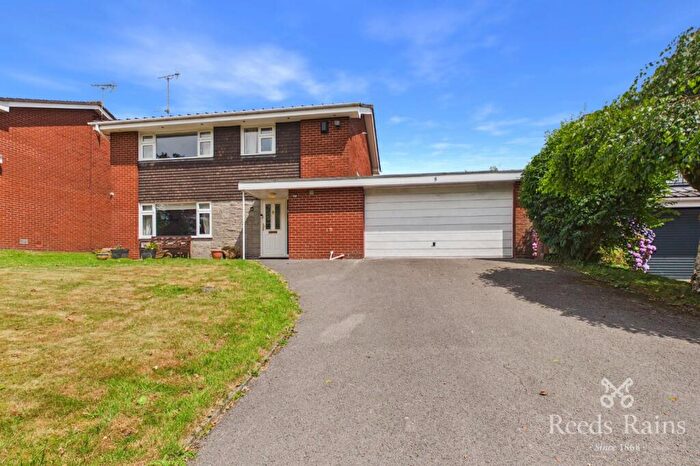
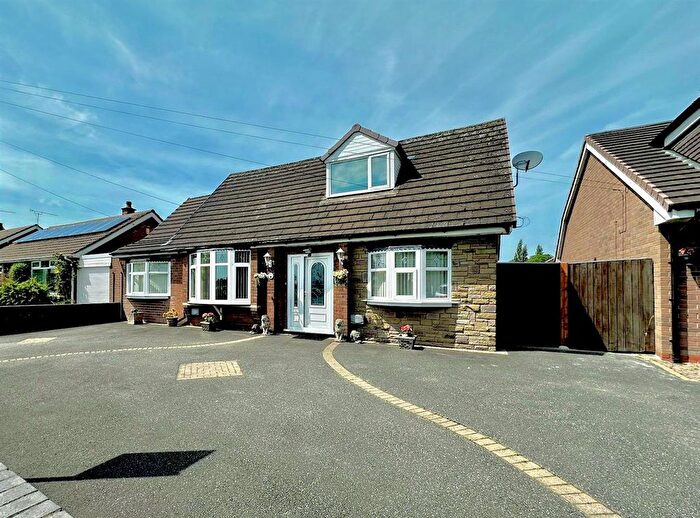
![]()
If you are looking to sell your house, let it out, or receive a property valuation, an expert can help you.
Click the button below to get started.
Roads and Postcodes in Shakerley
Navigate through our locations to find the location of your next house in Shakerley, Middlewich for sale or to rent.
| Streets | Postcodes |
|---|---|
| Bradwall Road | CW10 0LD |
| Brereton Lane | CW10 0JX |
| Buckley Avenue | CW10 9NW |
| Byley Lane | CW10 9LH CW10 9LJ CW10 9LN CW10 9NE CW10 9NL |
| Byley Road | CW10 9RJ CW10 9LL CW10 9NJ |
| Cledford Lane | CW10 0JT |
| Croxton Lane | CW10 9LA |
| Drakelow Lane | CW10 9NN |
| Holmes Chapel Road | CW10 0JD |
| Joness Lane | CW10 0JY |
| King Street | CW10 9LD CW10 9LB CW10 9LE |
| Kings Lane | CW10 9NB |
| Lily Lane | CW10 9NH |
| Middlewich Road | CW10 9NT CW10 9NX CW10 9ND |
| Moss Lane | CW10 9NG |
| Pochin Way | CW10 0QQ |
| Stublach | CW10 9NP |
| Yatehouse Lane | CW10 9NS |
| CW10 9NF CW10 9NR |
Property price trends in Shakerley
According to the latest Land Registry data, the average home in Shakerley sold for £517,500 in 2025. That figure comes from 77 sales logged over the past 30 years.
Prices have fallen back over the last three years. Compared with 2022, when the typical sale came in around £661,700, that's a fall of roughly 21.8%.
Looking back five years, average prices are down about 19.8% since 2020, a drop of around £127,500 in cash terms.
Zoom out to the past decade for the fuller picture. Back in 2015, homes here averaged £452,666, so the typical sold price has climbed about 14.3% since then, roughly 1.3% a year. Stretch the view to fifteen years and that annual pace edges up closer to 2.3%.
Frequently asked questions about Shakerley
What is the average price for a property for sale in Shakerley?
The average price for a property for sale in Shakerley is £710,300. This amount is 197% higher than the average price in Middlewich. There are 1,324 property listings for sale in Shakerley.
What streets have the most expensive properties for sale in Shakerley?
The street with the most expensive properties for sale in Shakerley is Yatehouse Lane at an average of £860,500.
What streets have the most affordable properties for sale in Shakerley?
The street with the most affordable properties for sale in Shakerley is Byley Lane at an average of £455,000.
Which train stations are available in or near Shakerley?
Some of the train stations available in or near Shakerley are Holmes Chapel, Winsford and Goostrey.
Property Price Paid in Shakerley by Year
The average sold property price by year was:
| Year | Average Sold Price | Price Change |
Sold Properties
|
|---|---|---|---|
| 2025 | £517,500 | -84% |
2 Properties |
| 2024 | £951,500 | 18% |
1 Property |
| 2023 | £782,500 | 15% |
2 Properties |
| 2022 | £661,700 | 12% |
5 Properties |
| 2021 | £580,763 | -11% |
8 Properties |
| 2020 | £645,000 | 58% |
4 Properties |
| 2019 | £271,500 | -73% |
1 Property |
| 2018 | £470,000 | -5% |
6 Properties |
| 2017 | £495,000 | -34% |
2 Properties |
| 2016 | £665,000 | 32% |
2 Properties |
Property Price per Property Type in Shakerley
Here you can find historic sold price data in order to help with your property search.
The average Property Paid Price for specific property types in the last three years are:
| Property Type | Average Sold Price | Sold Properties |
|---|---|---|
| Terraced House | £580,000.00 | 1 Terraced House |
| Detached House | £742,875.00 | 4 Detached Houses |
