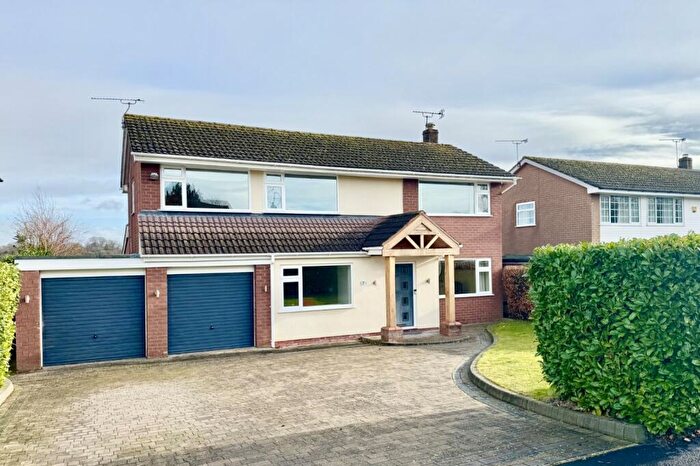
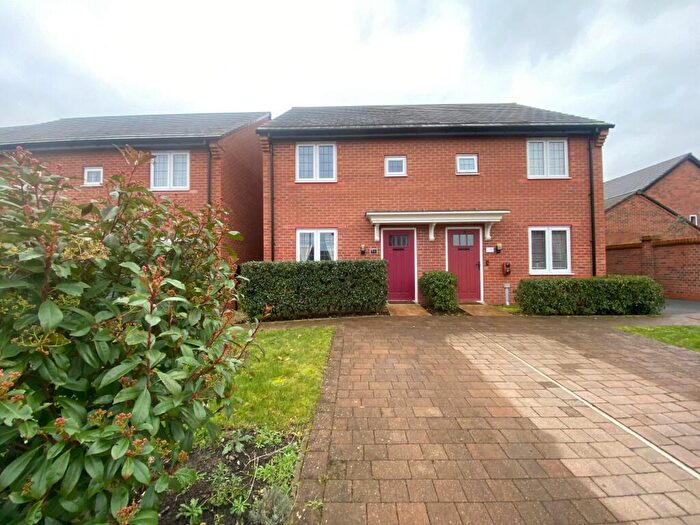
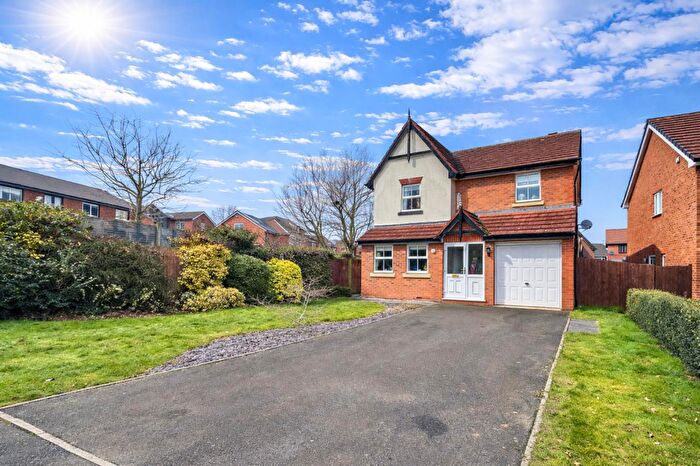
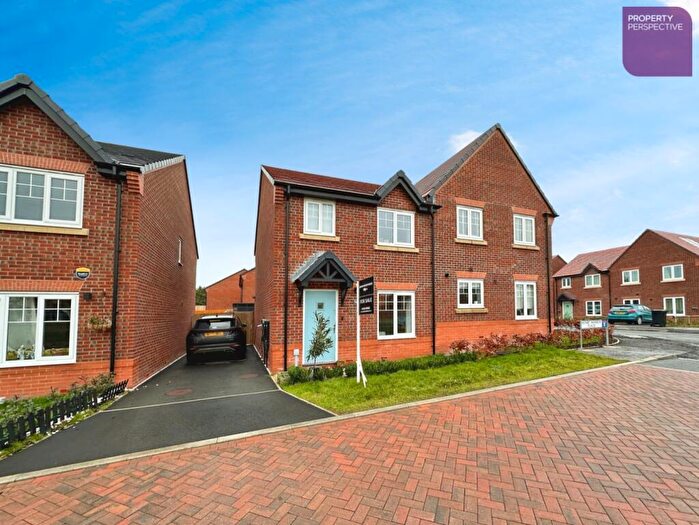
Houses for sale & to rent in Bunbury, Nantwich
House Prices in Bunbury
Properties in Bunbury have an average house price of £420,368.00 and had 161 Property Transactions within the last 3 years¹.
Bunbury is an area in Nantwich, Cheshire with 787 households², where the most expensive property was sold for £1,500,000.00.
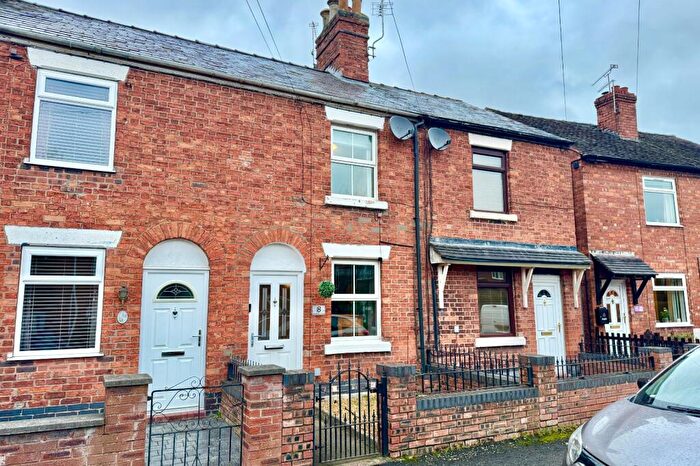
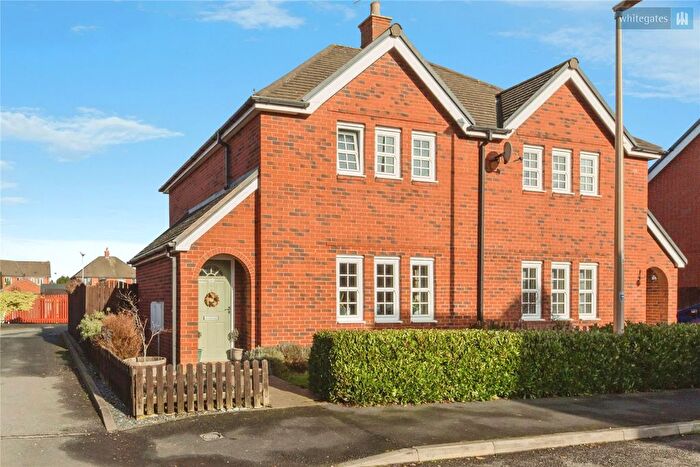
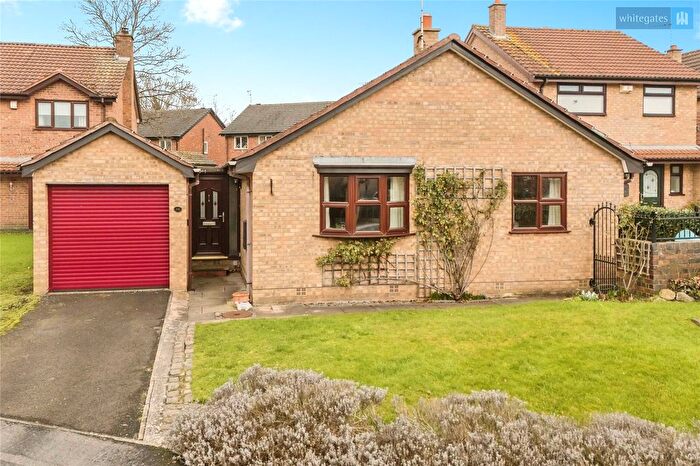
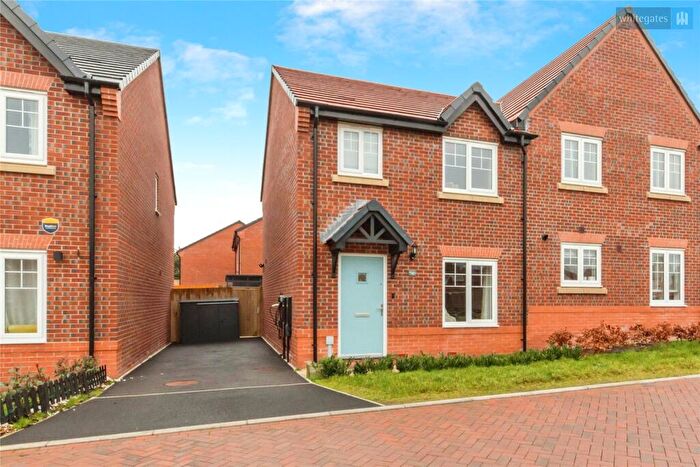
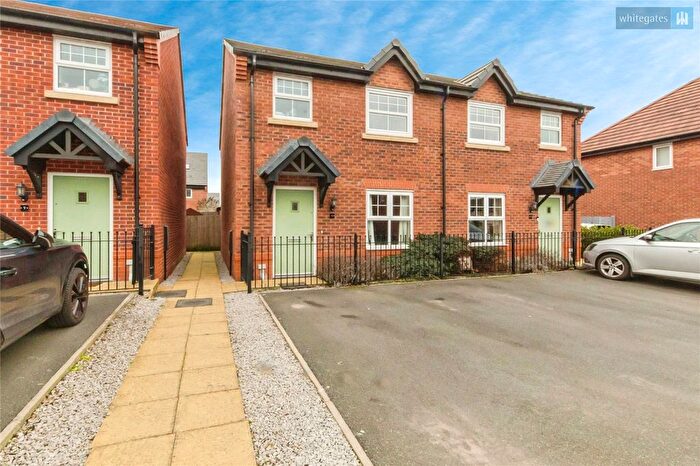
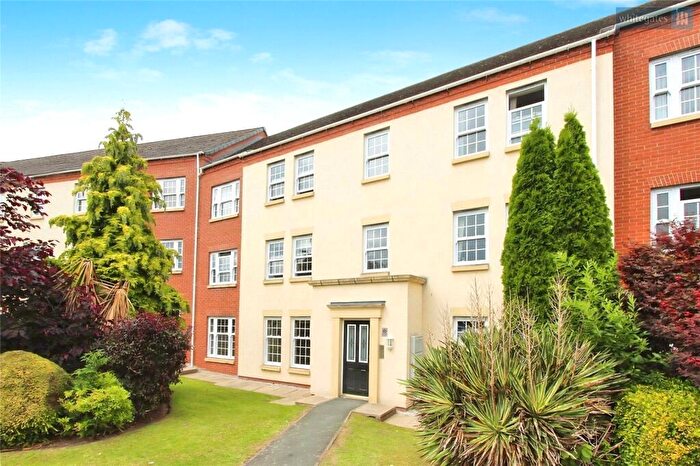
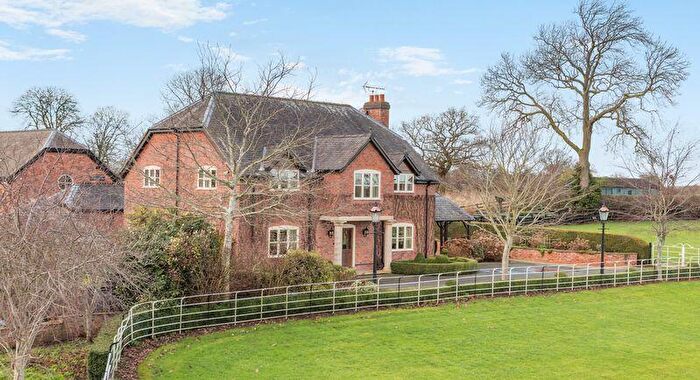
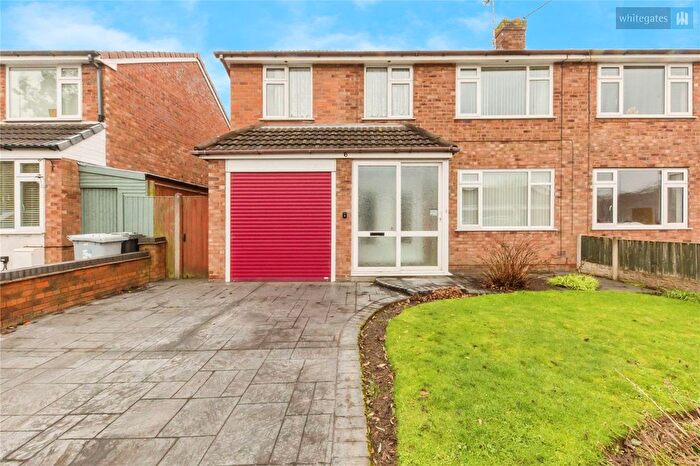
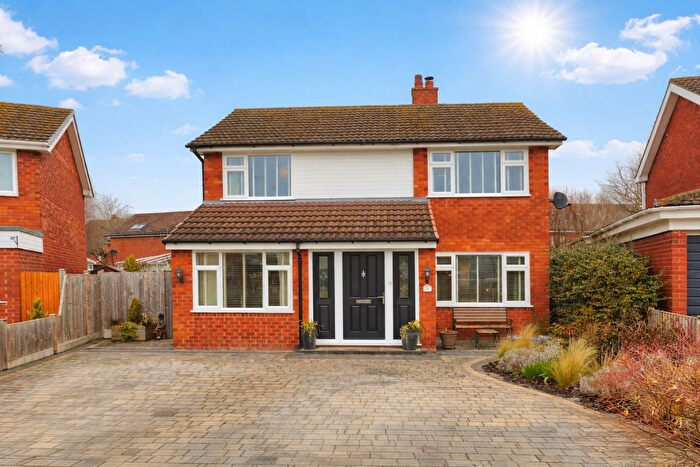
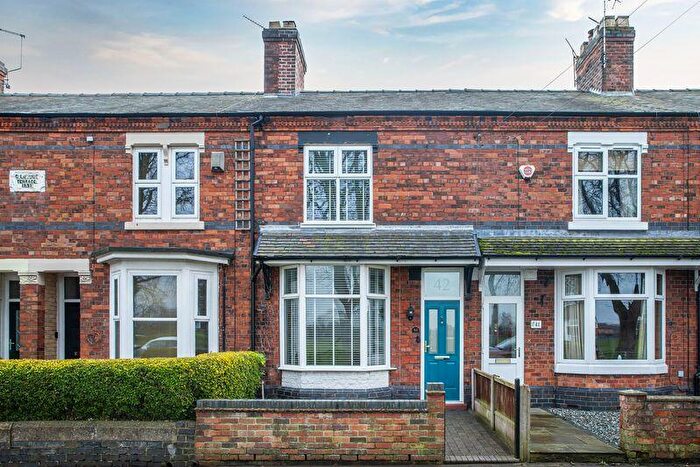
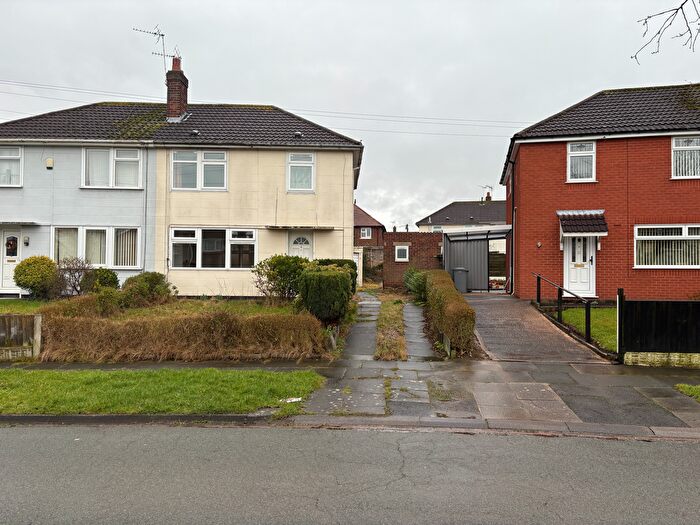
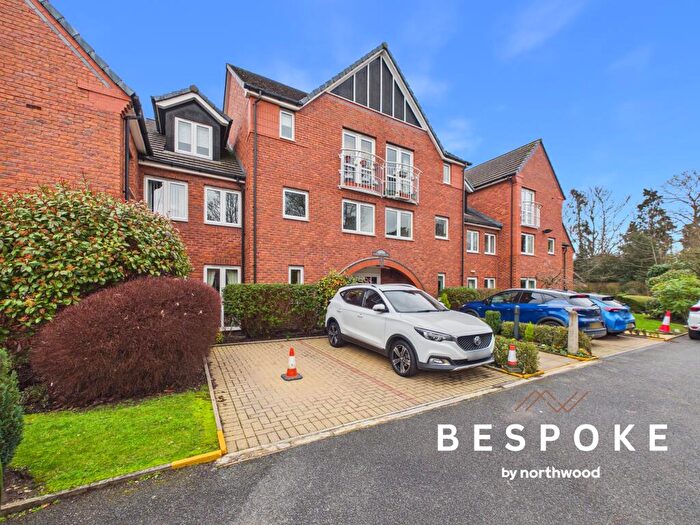
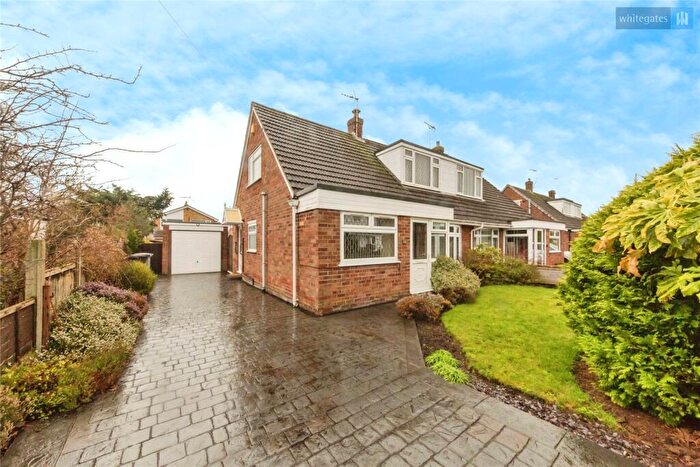
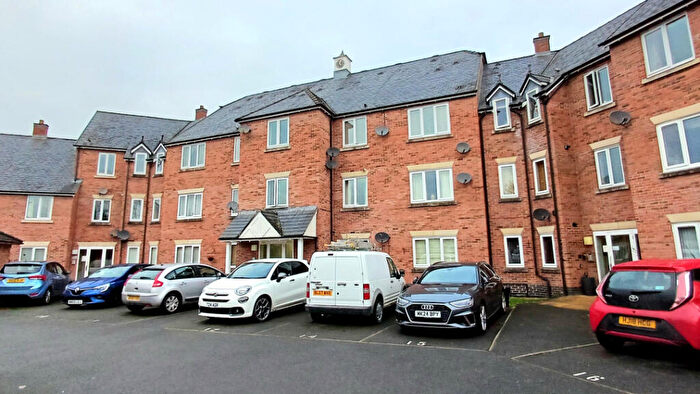
Properties for sale in Bunbury
Roads and Postcodes in Bunbury
Navigate through our locations to find the location of your next house in Bunbury, Nantwich for sale or to rent.
| Streets | Postcodes |
|---|---|
| Airfield Road | CW5 6LQ |
| Aylesbury Road | CW5 6YE |
| Ayrshire Drive | CW5 6XG |
| Bankside Close | CW5 6BL |
| Barons Road | CW5 6DL |
| Bolden Hill Road | CW5 6XX |
| Burland | CW5 8LT |
| Calveley Hall Lane | CW5 6BS |
| Camp Hill Drive | CW5 6XT |
| Campion Way | CW5 6YU |
| Cavalier Road | CW5 6ZB |
| Chalgrove Place | CW5 6YN |
| Chapel Row | CW5 6AZ |
| Chester Road | CW5 6BT CW5 6BU CW5 8LA CW5 8LD CW5 8LG CW5 8LJ CW5 8LB |
| Church Farm Mews | CW5 8FT |
| Church Road | CW5 6DP CW5 6DR |
| Church View Place | CW5 6XJ |
| Cinder Lane | CW5 6AJ CW5 6AW |
| Cross Lane Cottages | CW5 6AE |
| Cuckoo Lane | CW5 8LL CW5 8LN |
| Dairy Lane | CW5 6DS CW5 6DT |
| Dig Lane | CW5 8PB |
| Drake Lane | CW5 8PD |
| Gainsborough Drive | CW5 6YQ |
| George Booth Grove | CW5 6ZF |
| Green Lane | CW5 6DB CW5 6BJ CW5 6BN |
| Henhull Close | CW5 6XH |
| Hereford Place | CW5 6YF |
| Hurleston Way | CW5 6XN |
| Langport Close | CW5 6YY |
| Lansdowne Close | CW5 6YT |
| Laurel Place | CW5 6XL |
| Lee Green Lane | CW5 6ED |
| Main Road | CW5 6DN CW5 6DQ |
| Marsh Lane | CW5 8PH |
| Marston Moor Close | CW5 6YH |
| Meadowside Drive | CW5 6YG |
| Michael Ernerley Road | CW5 6YX |
| Mile House Lane | CW5 6GU |
| Mill Pool Lane | CW5 6AU |
| Minshull Lane | CW5 6EF |
| Monks Lane | CW5 8LE CW5 8LW |
| Montgomery Avenue | CW5 6YJ |
| Moorings Close | CW5 6GY |
| Nantwich Road | CW5 6BE CW5 6BG CW5 6BP |
| New Houses | CW5 6BB |
| Newark Place | CW5 6XY |
| Old Chester Court | CW5 6BH |
| Old Chester Road | CW5 6AY |
| Old Houses | CW5 6BA |
| Olney Place | CW5 6XU |
| Over Road | CW5 6EA |
| Paradise Lane | CW5 6EE |
| Poole Hill Road | CW5 6AH |
| Ravens Lane | CW5 8PF |
| Reaseheath Way | CW5 6XF |
| Richard Gibson Road | CW5 6XS |
| Roundhead Street | CW5 6YR |
| Seacroft Moor Grove | CW5 6XP |
| Selby Street | CW5 6XQ |
| Smithy Bank | CW5 8LF |
| Spitfire Road | CW5 6HT |
| St Marys Court | CW5 8JZ |
| Station Road | CW5 6DW |
| Stoke Hall Lane | CW5 6AR CW5 6AS |
| Stratton Road | CW5 6YP |
| Taunton Place | CW5 6XW |
| The Drive | CW5 6DG |
| The Green | CW5 6DE |
| The Homesteads | CW5 6DZ |
| Thomas Aston Place | CW5 6ZD |
| Thomas Fairfax Way | CW5 6YL |
| Tipton Green Close | CW5 6XZ |
| Turnham Green Drive | CW5 6ZA |
| Venetian Marina Village | CW5 6DA |
| Village Farm | CW5 6EG |
| Wardle Avenue | CW5 6BQ |
| Weaver View | CW5 6EB |
| Welshmans Lane | CW5 6AD |
| Wettenhall Road | CW5 6AL CW5 6EL CW5 6GR CW5 6LH |
| Wilbraham Close | CW5 8LH |
| Wilbraham Road | CW5 8LQ |
| William Brereton Way | CW5 6YZ |
| Woodgreen Lane | CW5 6EH |
| Worleston Road | CW5 6DH CW5 6DJ |
| CW5 6AG CW5 6AP CW5 6DU CW5 6DX CW5 6DY CW5 5BS CW5 6AF CW5 6AQ CW5 6AX CW5 6DD CW5 6DF CW5 6GX CW5 6RS CW5 6XR |
Transport near Bunbury
- FAQ
- Price Paid By Year
- Property Type Price
Frequently asked questions about Bunbury
What is the average price for a property for sale in Bunbury?
The average price for a property for sale in Bunbury is £420,368. This amount is 32% higher than the average price in Nantwich. There are 1,507 property listings for sale in Bunbury.
What streets have the most expensive properties for sale in Bunbury?
The streets with the most expensive properties for sale in Bunbury are Drake Lane at an average of £1,350,000, Wettenhall Road at an average of £700,000 and Church Road at an average of £685,000.
What streets have the most affordable properties for sale in Bunbury?
The streets with the most affordable properties for sale in Bunbury are Wardle Avenue at an average of £69,000, Church View Place at an average of £181,000 and Henhull Close at an average of £219,166.
Which train stations are available in or near Bunbury?
Some of the train stations available in or near Bunbury are Nantwich, Crewe and Wrenbury.
Property Price Paid in Bunbury by Year
The average sold property price by year was:
| Year | Average Sold Price | Price Change |
Sold Properties
|
|---|---|---|---|
| 2025 | £411,916 | -8% |
44 Properties |
| 2024 | £445,752 | 12% |
67 Properties |
| 2023 | £393,789 | -10% |
50 Properties |
| 2022 | £433,633 | 9% |
51 Properties |
| 2021 | £395,902 | 15% |
92 Properties |
| 2020 | £337,446 | 14% |
104 Properties |
| 2019 | £289,635 | 4% |
154 Properties |
| 2018 | £279,223 | -24% |
63 Properties |
| 2017 | £346,888 | 10% |
27 Properties |
| 2016 | £313,666 | 2% |
24 Properties |
| 2015 | £307,043 | -2% |
26 Properties |
| 2014 | £311,830 | 2% |
21 Properties |
| 2013 | £304,869 | 7% |
21 Properties |
| 2012 | £284,875 | 23% |
21 Properties |
| 2011 | £220,147 | -81% |
20 Properties |
| 2010 | £398,121 | 11% |
16 Properties |
| 2009 | £352,545 | 26% |
11 Properties |
| 2008 | £259,188 | -12% |
18 Properties |
| 2007 | £291,359 | -10% |
36 Properties |
| 2006 | £320,781 | 26% |
24 Properties |
| 2005 | £238,294 | -5% |
17 Properties |
| 2004 | £250,215 | 3% |
40 Properties |
| 2003 | £241,881 | 14% |
26 Properties |
| 2002 | £208,814 | 35% |
37 Properties |
| 2001 | £135,185 | 20% |
27 Properties |
| 2000 | £108,203 | -4% |
38 Properties |
| 1999 | £113,012 | 9% |
38 Properties |
| 1998 | £103,211 | -16% |
21 Properties |
| 1997 | £119,869 | 24% |
33 Properties |
| 1996 | £91,363 | 11% |
23 Properties |
| 1995 | £81,596 | - |
15 Properties |
Property Price per Property Type in Bunbury
Here you can find historic sold price data in order to help with your property search.
The average Property Paid Price for specific property types in the last three years are:
| Property Type | Average Sold Price | Sold Properties |
|---|---|---|
| Semi Detached House | £307,295.00 | 34 Semi Detached Houses |
| Detached House | £479,817.00 | 100 Detached Houses |
| Terraced House | £358,731.00 | 24 Terraced Houses |
| Flat | £213,316.00 | 3 Flats |

