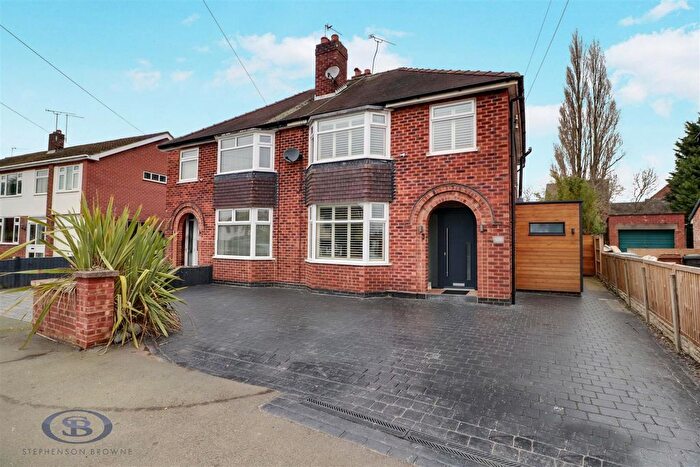
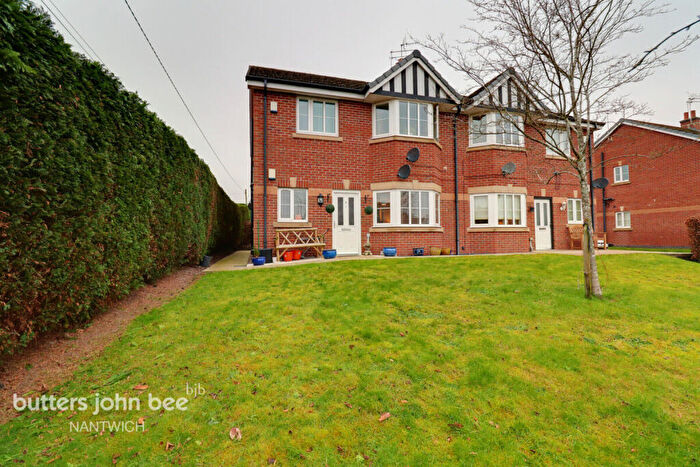
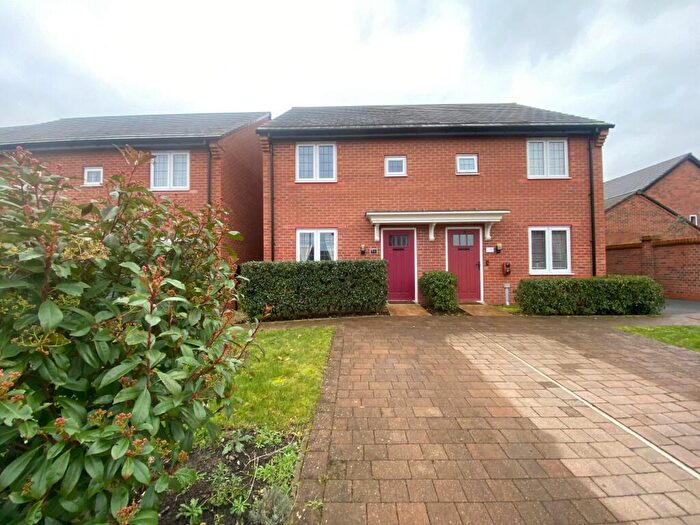
Houses for sale & to rent in Wybunbury, Nantwich
House Prices in Wybunbury
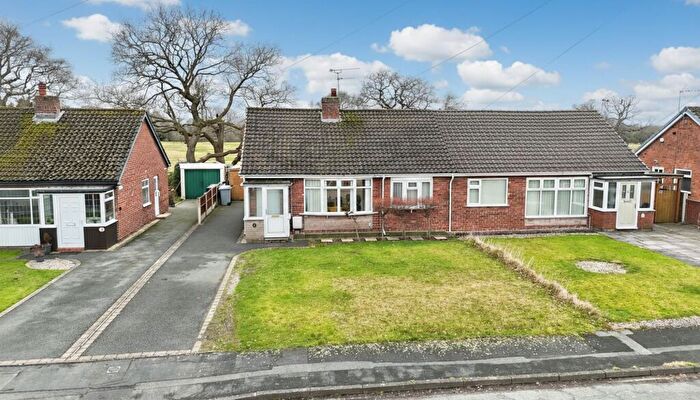
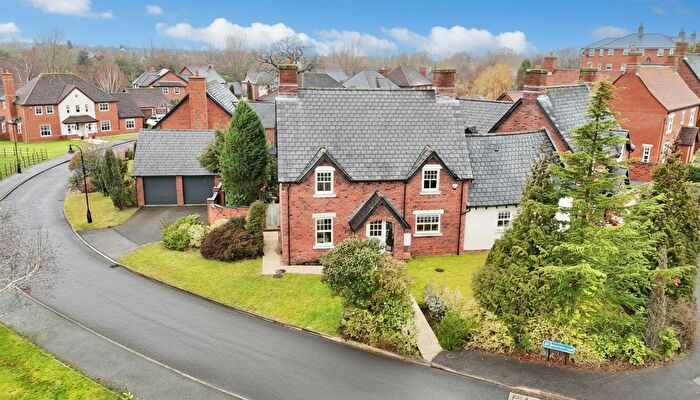
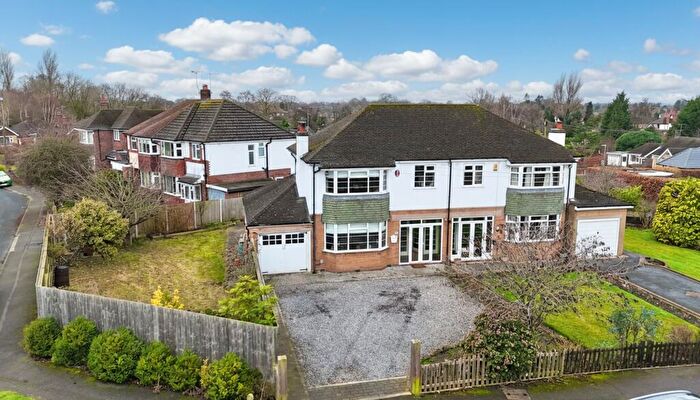
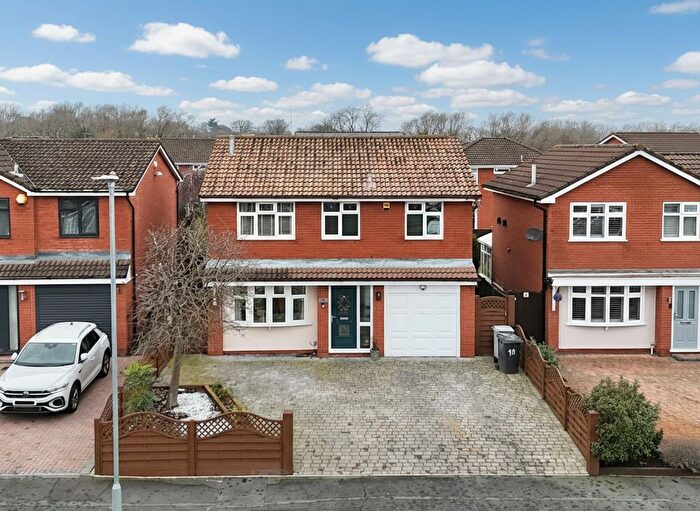
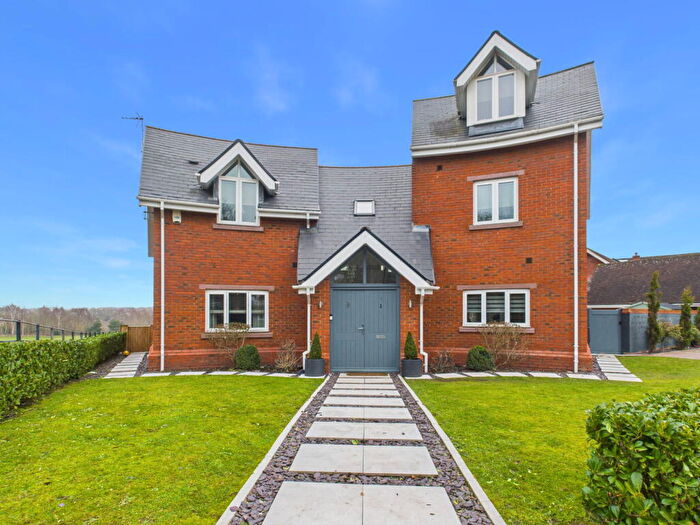
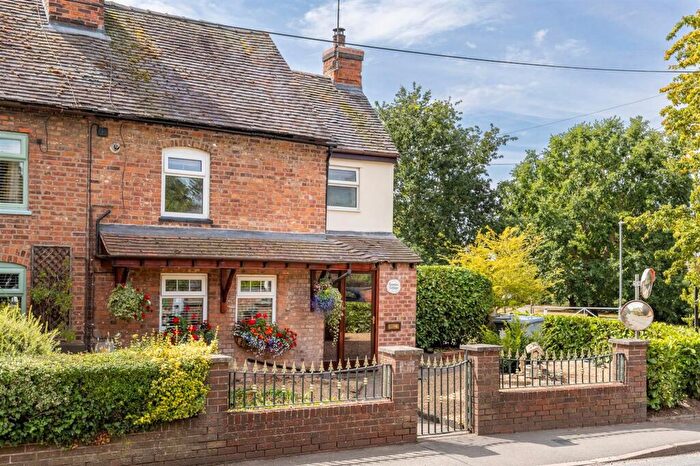
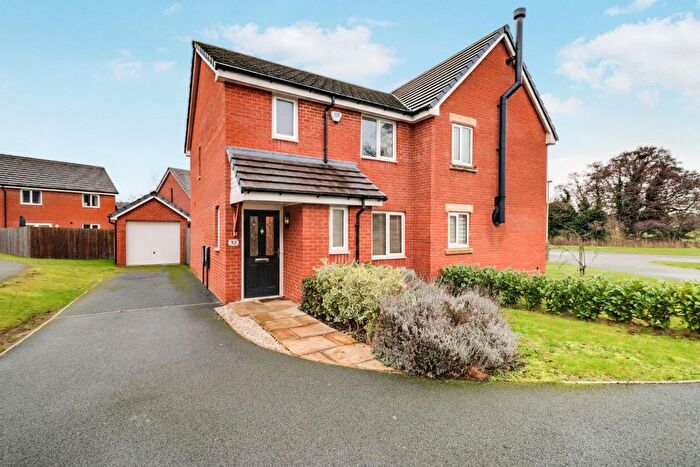
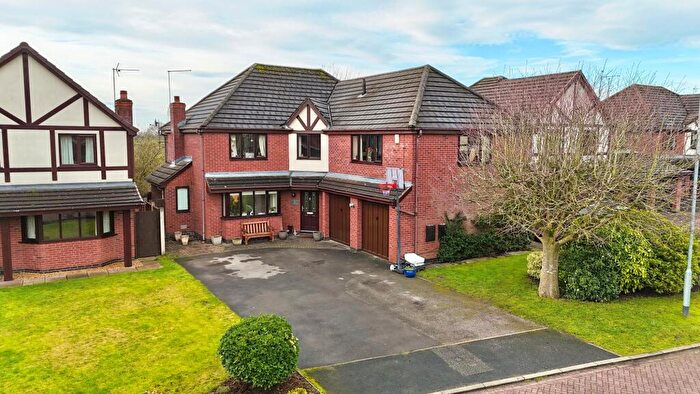
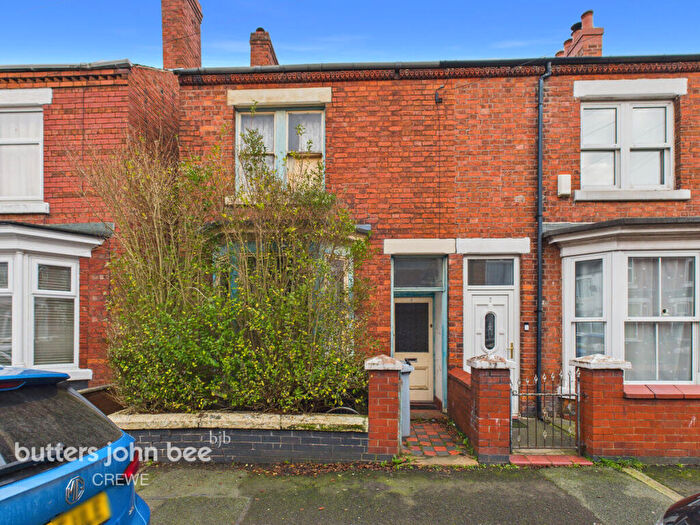
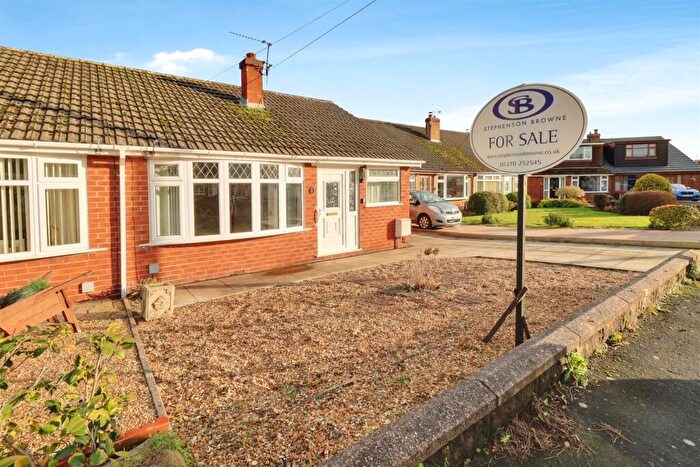
Properties in Wybunbury have an average house price of £440,123.00 and had 74 Property Transactions within the last 3 years¹.
Wybunbury is an area in Nantwich, Cheshire with 985 households², where the most expensive property was sold for £1,800,000.00.
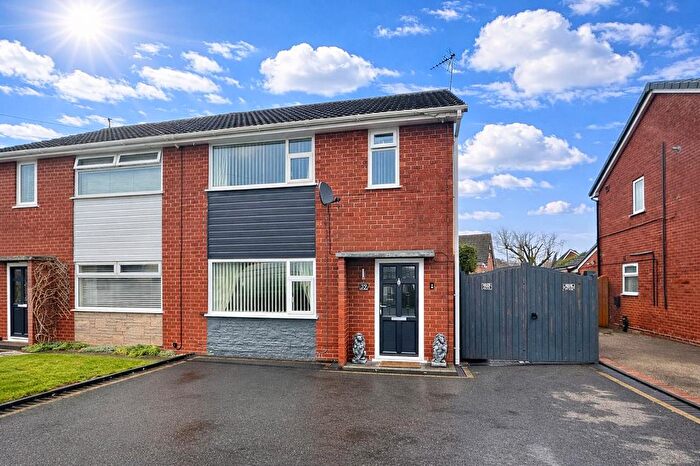
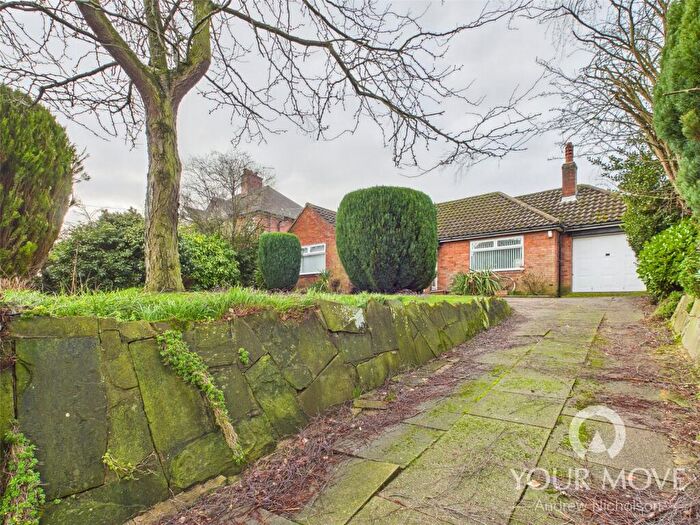
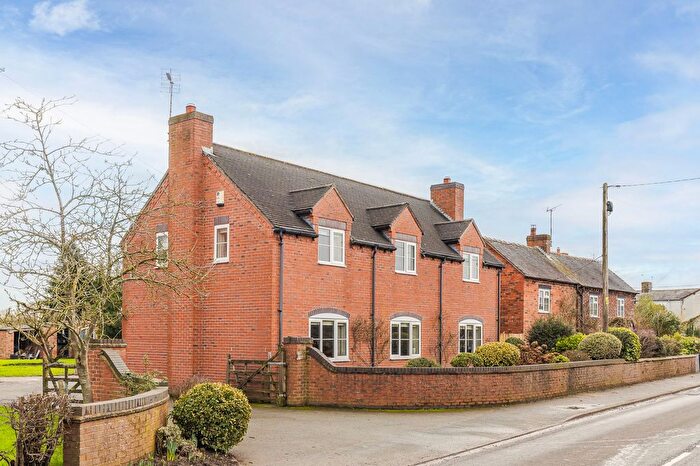
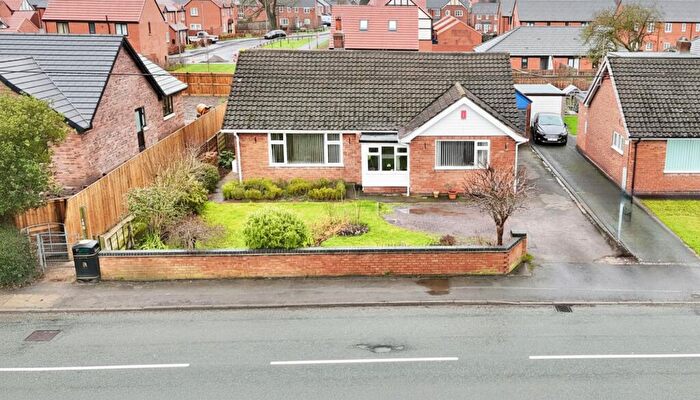
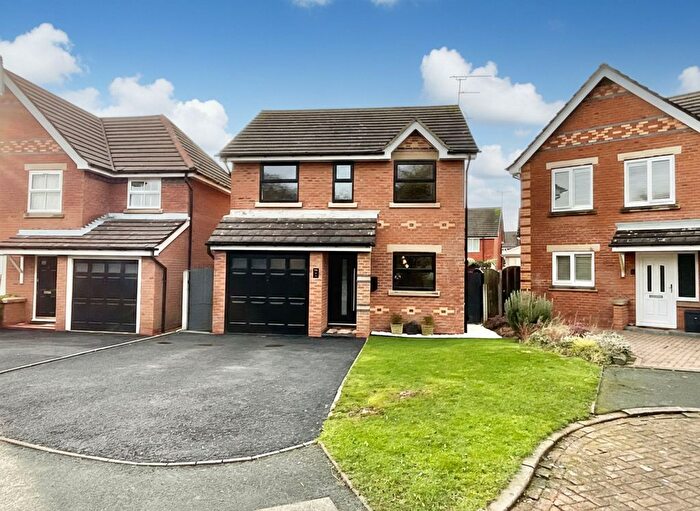
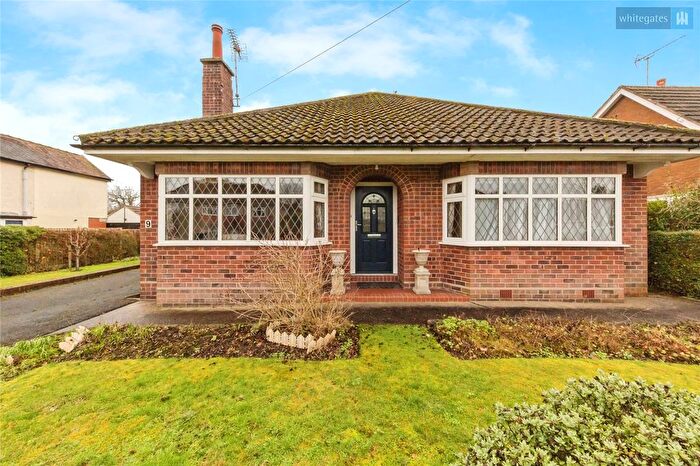
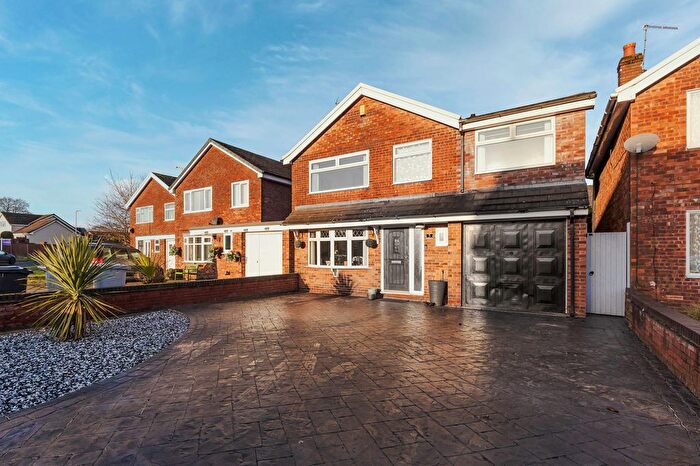
Properties for sale in Wybunbury
Roads and Postcodes in Wybunbury
Navigate through our locations to find the location of your next house in Wybunbury, Nantwich for sale or to rent.
| Streets | Postcodes |
|---|---|
| Annions Lane | CW5 7LP |
| Audlem Road | CW5 7PJ CW5 7QT |
| Back Lane | CW5 7NQ |
| Bridge Street | CW5 7NB CW5 7NE |
| Bridgemere Hall Cottage | CW5 7PX |
| Bridgemere Lane | CW5 7PL CW5 7PN |
| Bridgemere Mews | CW5 7PF |
| Broomlands Cottages | CW5 7PH |
| Chads Green | CW5 7NL |
| Checkley Lane | CW5 7QA |
| Church Lane | CW5 7PS |
| Church Way | CW5 7SA CW5 7SB |
| Churchfields | CW5 7LL |
| Cobbs Lane | CW5 7NT |
| Crewe Road | CW5 7LG CW5 7PE CW5 7QY |
| Dig Lane | CW5 7EY CW5 7EZ |
| Fields View Close | CW5 7SD |
| Glebe Close | CW5 7SF |
| Gonsley Cottage | CW5 7NR |
| Gorsey Bank Crescent | CW5 7LX |
| Greenfields Lane | CW5 7PT |
| Greenhaven Court | CW5 7QG |
| Hatherton Road | CW5 7RB |
| Haymoor Green Road | CW5 7HG |
| Howbeck Crescent | CW5 7NX |
| Hunsterson Road | CW5 7PD CW5 7RA |
| Kiln Lane | CW5 7LZ |
| Lea Forge | CW5 7LF |
| Lodge Lane | CW5 7LD |
| London Road | CW5 7LA CW5 7LB CW5 7NH CW5 7NJ CW5 7LE |
| Main Road | CW5 7LR CW5 7LS CW5 7LY CW5 7NA CW5 7LW |
| Manor Place | CW5 7PW |
| Mill Lane | CW5 7NN CW5 7NP |
| Moorlands Drive | CW5 7PA |
| Moss Lane | CW5 7HB |
| Oakes Corner | CW5 7PQ |
| Park Lane Mews | CW5 7QX |
| Pewit Lane | CW5 7PP |
| Riddings Lane | CW5 7NY |
| Sally Clarkes Lane | CW5 7ND |
| Sandy Lane | CW5 7LQ |
| Southfields Close | CW5 7SE |
| St Chads Close | CW5 7LU |
| Stock Lane | CW5 7EX CW5 7HE CW5 7HF CW5 7HA |
| Tower View Close | CW5 7SS |
| Valebrook Drive | CW5 7LT |
| Winterberry Way | CW5 7NZ |
| Wrinehill Road | CW5 7NS CW5 7NU |
| Wybunbury Lane | CW5 7HD |
| Wybunbury Road | CW5 7NG |
| CW5 7PR CW5 7PY CW5 7PZ CW5 7JX CW5 7PG CW5 7PU CW5 7QB CW5 7SN |
Transport near Wybunbury
-
Nantwich Station
-
Crewe Station
-
Wrenbury Station
-
Alsager Station
-
Sandbach Station
-
Kidsgrove Station
-
Longport Station
- FAQ
- Price Paid By Year
- Property Type Price
Frequently asked questions about Wybunbury
What is the average price for a property for sale in Wybunbury?
The average price for a property for sale in Wybunbury is £440,123. This amount is 38% higher than the average price in Nantwich. There are 2,741 property listings for sale in Wybunbury.
What streets have the most expensive properties for sale in Wybunbury?
The streets with the most expensive properties for sale in Wybunbury are Wybunbury Lane at an average of £736,166, Park Lane Mews at an average of £710,000 and Greenhaven Court at an average of £653,750.
What streets have the most affordable properties for sale in Wybunbury?
The streets with the most affordable properties for sale in Wybunbury are Back Lane at an average of £232,000, Bridge Street at an average of £247,500 and Tower View Close at an average of £249,125.
Which train stations are available in or near Wybunbury?
Some of the train stations available in or near Wybunbury are Nantwich, Crewe and Wrenbury.
Property Price Paid in Wybunbury by Year
The average sold property price by year was:
| Year | Average Sold Price | Price Change |
Sold Properties
|
|---|---|---|---|
| 2025 | £381,839 | -27% |
22 Properties |
| 2024 | £485,479 | 10% |
29 Properties |
| 2023 | £438,684 | -6% |
23 Properties |
| 2022 | £463,241 | 4% |
32 Properties |
| 2021 | £444,541 | 14% |
64 Properties |
| 2020 | £380,718 | 12% |
38 Properties |
| 2019 | £336,209 | 2% |
46 Properties |
| 2018 | £328,230 | 6% |
58 Properties |
| 2017 | £309,981 | 8% |
44 Properties |
| 2016 | £283,731 | 5% |
41 Properties |
| 2015 | £270,300 | -30% |
25 Properties |
| 2014 | £352,620 | 7% |
38 Properties |
| 2013 | £329,417 | 34% |
29 Properties |
| 2012 | £218,578 | -22% |
25 Properties |
| 2011 | £267,614 | 0,2% |
35 Properties |
| 2010 | £267,146 | -2% |
28 Properties |
| 2009 | £272,537 | -11% |
39 Properties |
| 2008 | £303,063 | -13% |
15 Properties |
| 2007 | £342,641 | 17% |
41 Properties |
| 2006 | £283,437 | 11% |
41 Properties |
| 2005 | £251,786 | 1% |
26 Properties |
| 2004 | £249,598 | 10% |
43 Properties |
| 2003 | £224,008 | 16% |
31 Properties |
| 2002 | £188,053 | 28% |
54 Properties |
| 2001 | £136,046 | -19% |
41 Properties |
| 2000 | £161,582 | 34% |
35 Properties |
| 1999 | £106,750 | -22% |
45 Properties |
| 1998 | £129,910 | 4% |
32 Properties |
| 1997 | £124,562 | 26% |
44 Properties |
| 1996 | £92,451 | -9% |
69 Properties |
| 1995 | £100,704 | - |
68 Properties |
Property Price per Property Type in Wybunbury
Here you can find historic sold price data in order to help with your property search.
The average Property Paid Price for specific property types in the last three years are:
| Property Type | Average Sold Price | Sold Properties |
|---|---|---|
| Semi Detached House | £305,125.00 | 31 Semi Detached Houses |
| Detached House | £559,180.00 | 40 Detached Houses |
| Terraced House | £247,666.00 | 3 Terraced Houses |

