
Houses for sale in Neston, Cheshire
House Prices in Neston
Properties in Neston have an average house price of £358k and had 826 Property Transactions within the last 3 years.¹
Neston is an area in Cheshire with 8,647 households², where the most expensive property was sold for £1.97M.
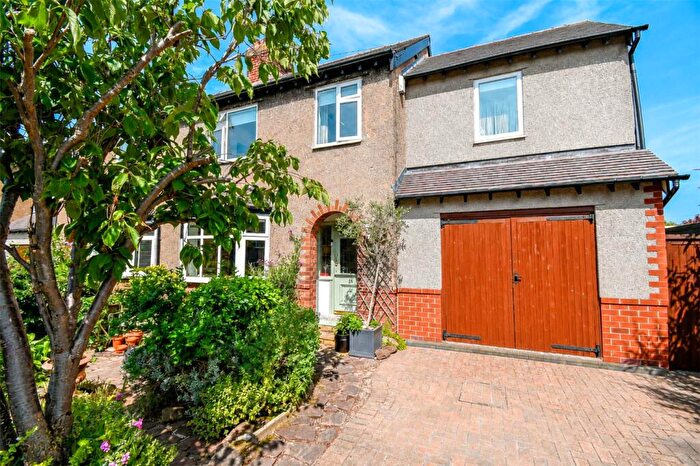
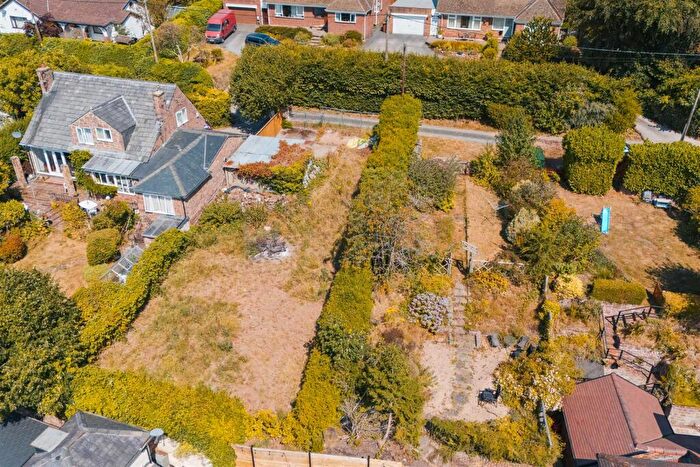
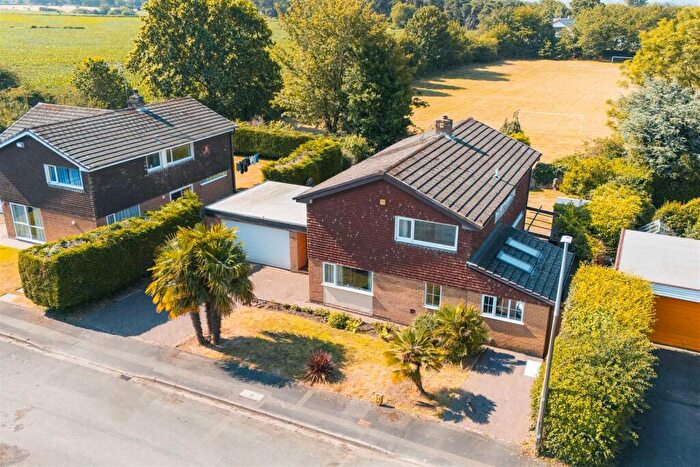
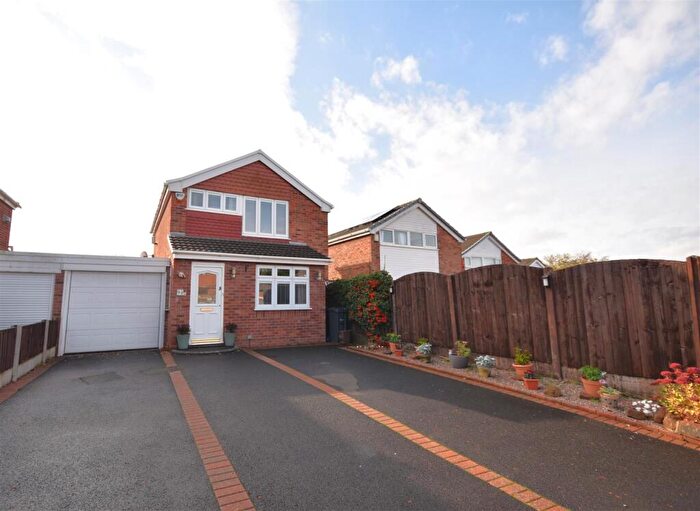
Properties for sale in Neston
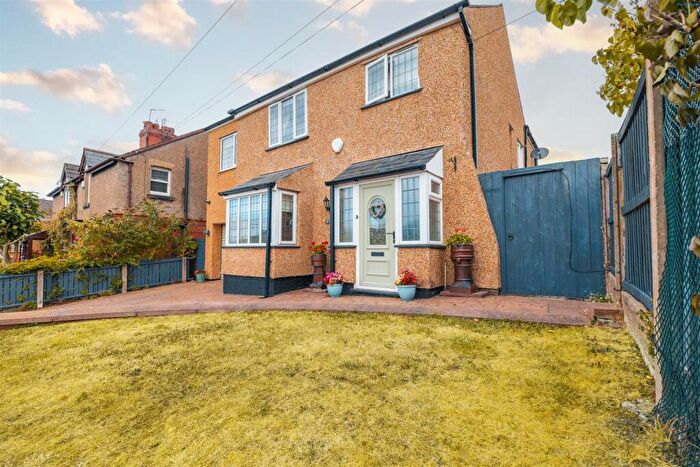

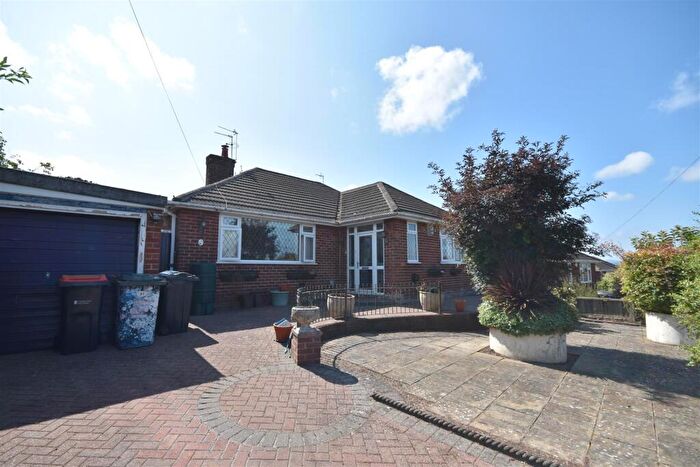
![]()
If you are looking to sell your house, let it out, or receive a property valuation, an expert can help you.
Click the button below to get started.
Neighbourhoods in Neston
Navigate through our locations to find the location of your next house in Neston, Cheshire for sale or to rent.
Property price trends in Neston
According to the latest Land Registry data, the average home in Neston sold for £285,368 in 2026. That figure comes from a substantial record of 9,998 sales logged over the past 31 years.
Prices have fallen back over the last three years. Compared with 2023, when the typical sale came in around £370,923, that's a fall of roughly 23.1%.
Looking back five years, average prices are down about 19.8% since 2021, a drop of around £70,560 in cash terms.
Zoom out to the past decade for the fuller picture. Back in 2016, homes here averaged £252,420, so the typical sold price has climbed about 13.1% since then, roughly 1.2% a year. Stretch the view to fifteen years and that annual pace eases back to about 1%.
Frequently asked questions about Neston
What is the average price for a property for sale in Neston?
The average price for a property for sale in Neston is £357,815. This amount is 11% higher than the average price in Cheshire. There are 1,225 property listings for sale in Neston.
What locations have the most expensive properties for sale in Neston?
The locations with the most expensive properties for sale in Neston are Willaston & Thornton at an average of £770,455, Parkgate at an average of £403,215 and Willaston And Thornton at an average of £400,408.
What locations have the most affordable properties for sale in Neston?
The locations with the most affordable properties for sale in Neston are Little Neston at an average of £89,500, Neston at an average of £262,531 and Little Neston And Burton at an average of £356,152.
Which train stations are available in or near Neston?
Some of the train stations available in or near Neston are Neston, Hooton and Heswall.
Property Price Paid in Neston by Year
The average sold property price by year was:
| Year | Average Sold Price | Price Change |
Sold Properties
|
|---|---|---|---|
| 2026 | £285,368 | -17% |
19 Properties |
| 2025 | £335,153 | -12% |
297 Properties |
| 2024 | £375,877 | 1% |
287 Properties |
| 2023 | £370,923 | 1% |
223 Properties |
| 2022 | £366,886 | 3% |
274 Properties |
| 2021 | £355,928 | 14% |
409 Properties |
| 2020 | £306,809 | 5% |
302 Properties |
| 2019 | £292,751 | 3% |
355 Properties |
| 2018 | £284,611 | 13% |
314 Properties |
| 2017 | £248,697 | -1% |
345 Properties |
Property Price per Property Type in Neston
Here you can find historic sold price data in order to help with your property search.
The average Property Paid Price for specific property types in the last three years are:
| Property Type | Average Sold Price | Sold Properties |
|---|---|---|
| Semi Detached House | £294,707.00 | 244 Semi Detached Houses |
| Detached House | £510,897.00 | 348 Detached Houses |
| Terraced House | £220,754.00 | 160 Terraced Houses |
| Flat | £142,347.00 | 74 Flats |
Transport in Neston
Please see below transportation links in this area:
