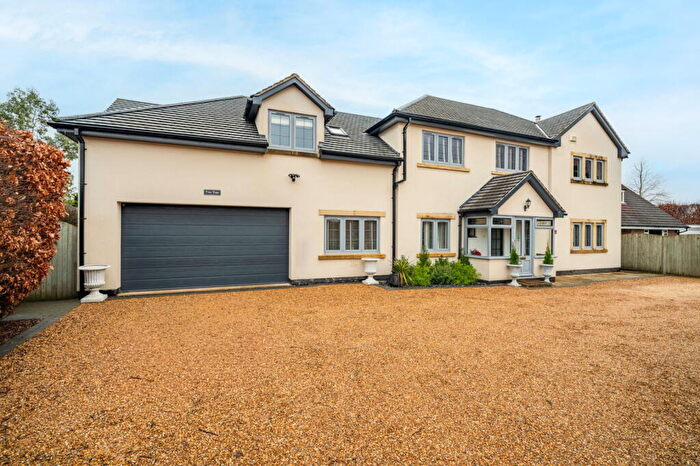
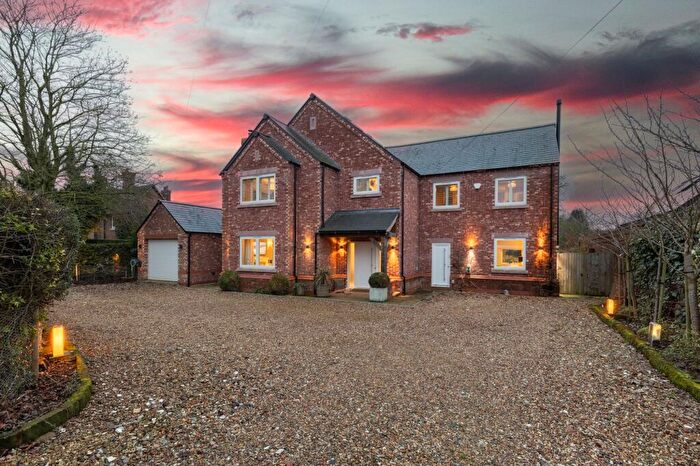
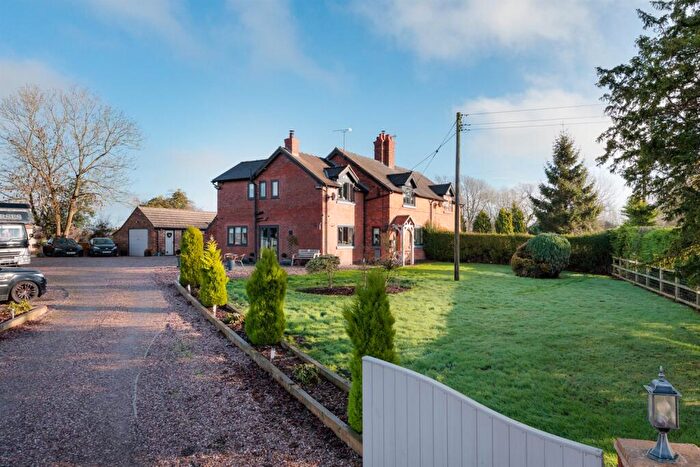
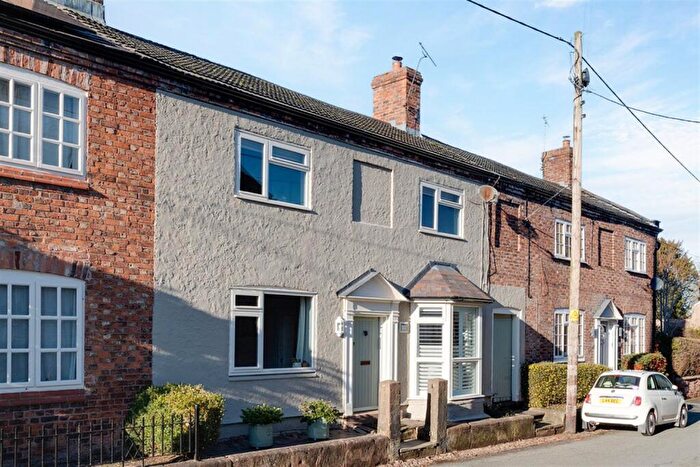
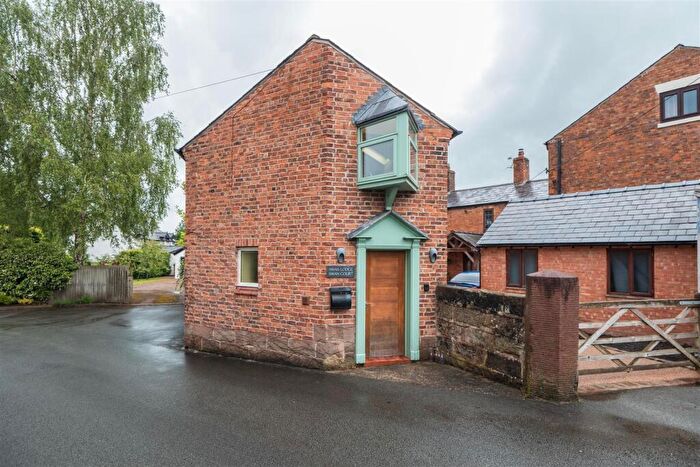
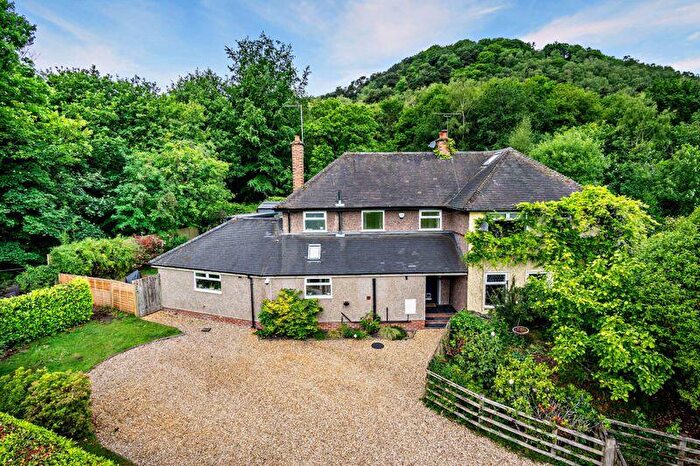
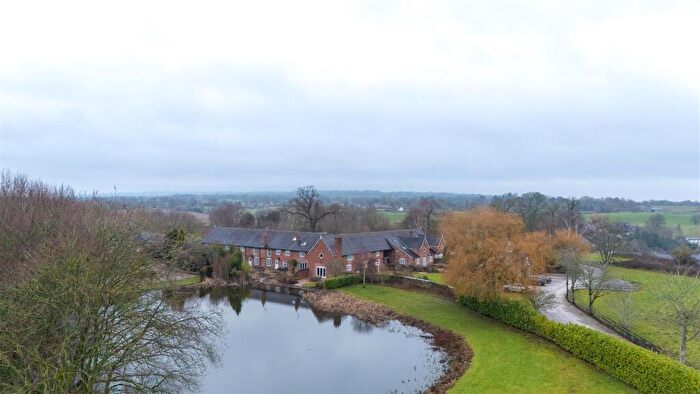
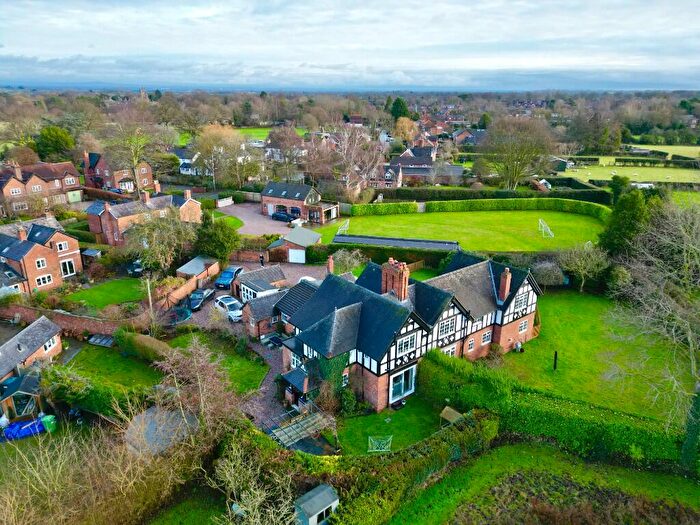
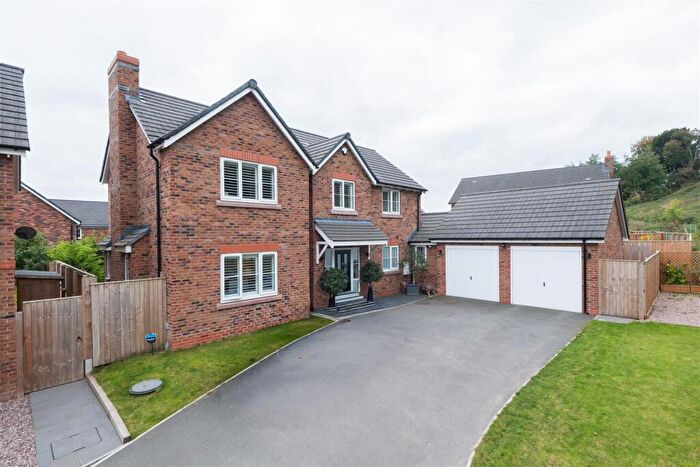
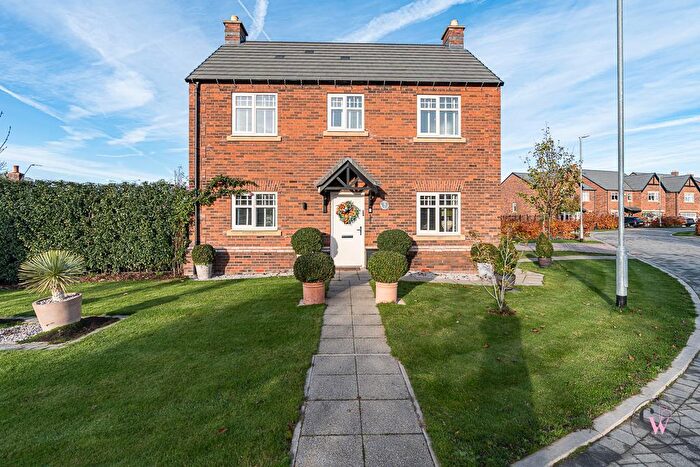
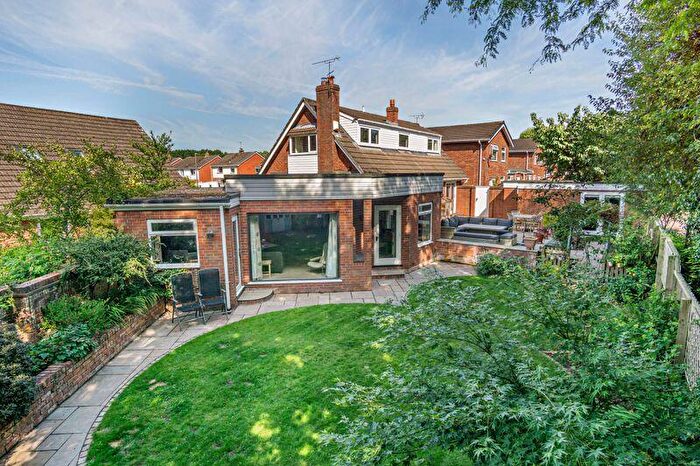
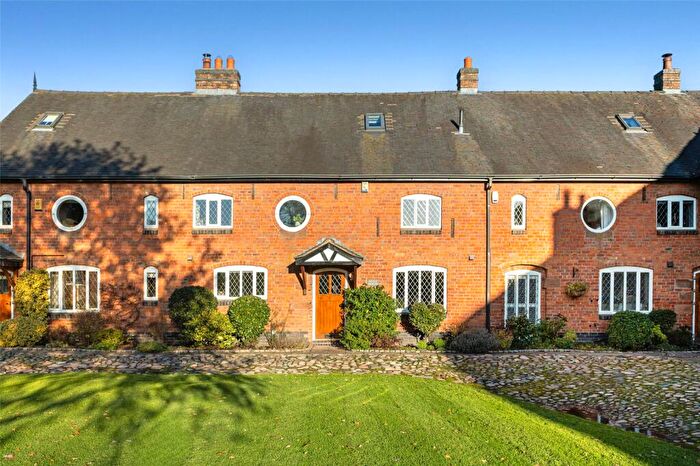
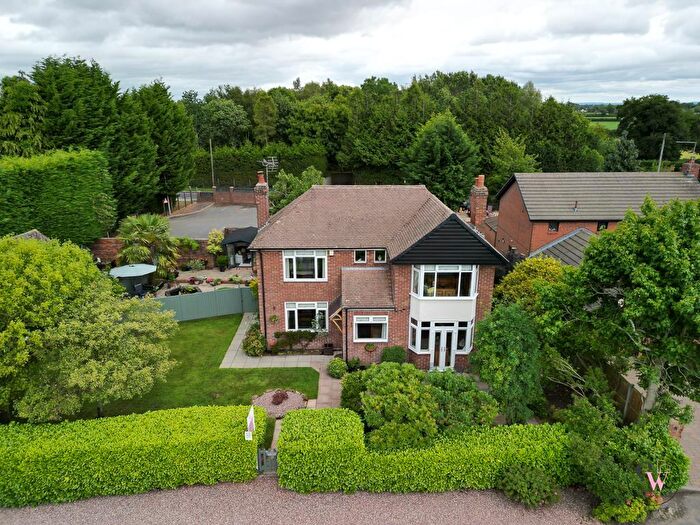
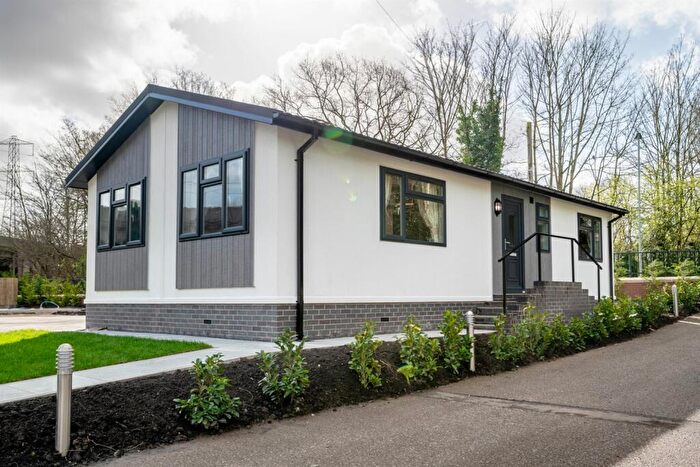
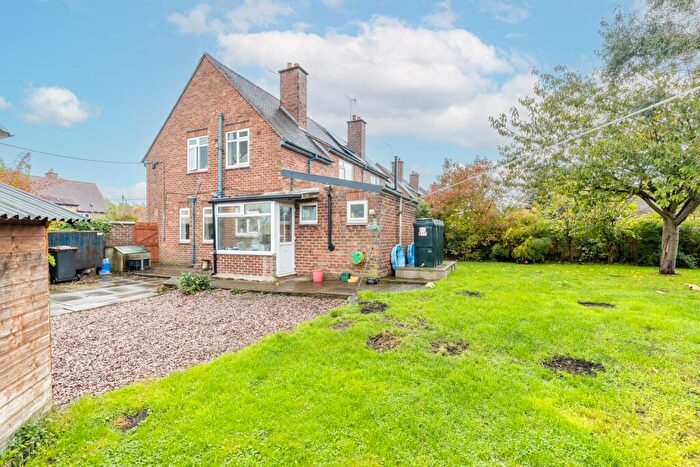
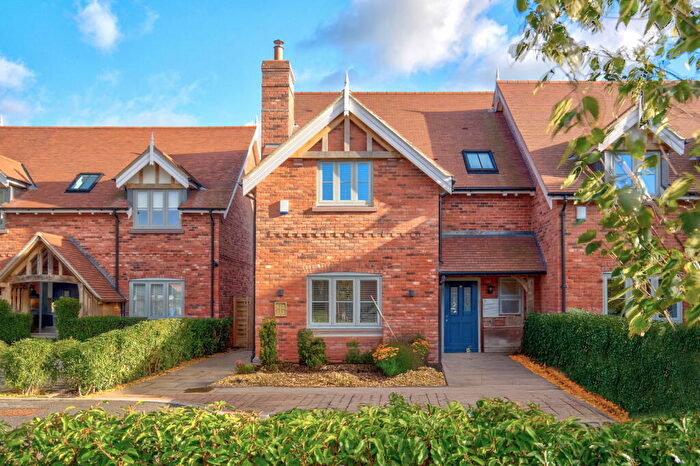
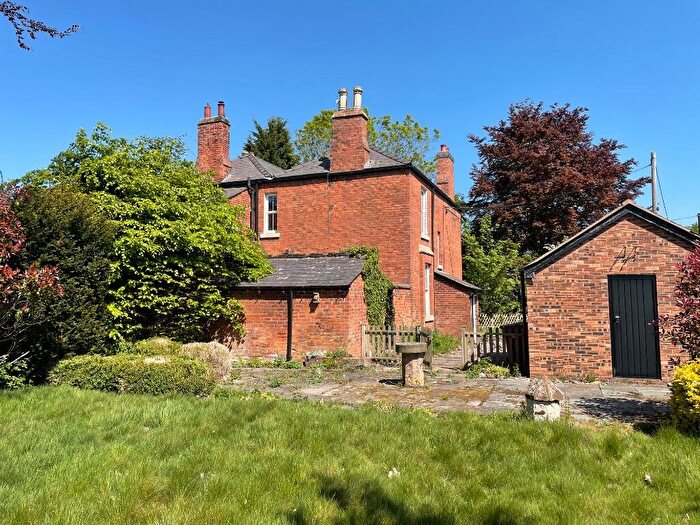
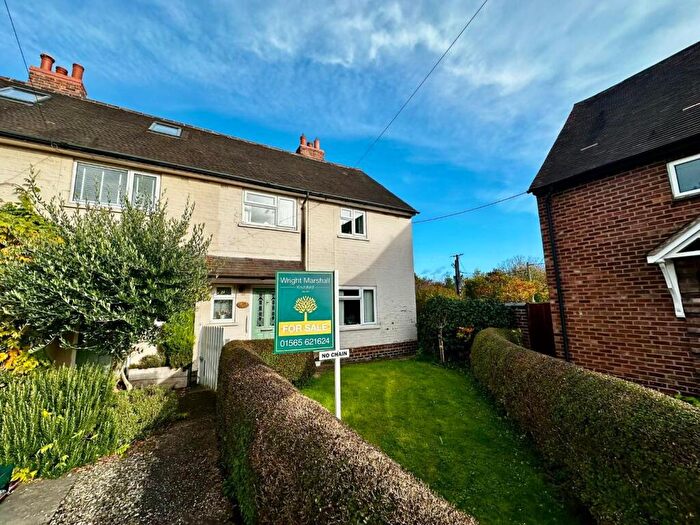
Houses for sale & to rent in Wrenbury, Tarporley
House Prices in Wrenbury
Properties in Wrenbury have an average house price of £720,225.00 and had 36 Property Transactions within the last 3 years¹.
Wrenbury is an area in Tarporley, Cheshire with 357 households², where the most expensive property was sold for £2,400,000.00.
Properties for sale in Wrenbury
Roads and Postcodes in Wrenbury
Navigate through our locations to find the location of your next house in Wrenbury, Tarporley for sale or to rent.
| Streets | Postcodes |
|---|---|
| Back Lane | CW6 9TE |
| Badcocks Lane | CW6 9RR CW6 9RT |
| Bathwood Lane | CW6 9RS |
| Cappers Lane | CW6 9RP |
| Dob Lane | CW6 9LR |
| Ferret Oak Lane | CW6 9RQ |
| Hall Lane | CW6 9RH CW6 9RJ |
| Hill Lane | CW6 9TW |
| Long Lane | CW6 9RF CW6 9RG CW6 9RN CW6 9RD |
| Peckforton Hall Lane | CW6 9GP CW6 9TF CW6 9TG CW6 9TH |
| Quarry Bank | CW6 9UH |
| Radmore Green | CW6 9RL |
| South Croft | CW6 9TQ |
| Stone House Lane | CW6 9TJ CW6 9TN |
| Whitchurch Road | CW6 9RU CW6 9TA CW6 9TD |
| Wrexham Road | CW6 9RZ CW6 9SA |
| CW6 9RX CW6 9RY CW6 9SB CW6 9TB CW6 9SD |
Transport near Wrenbury
-
Wrenbury Station
-
Nantwich Station
-
Delamere Station
-
Whitchurch (Salop) Station
-
Winsford Station
-
Crewe Station
-
Mouldsworth Station
- FAQ
- Price Paid By Year
- Property Type Price
Frequently asked questions about Wrenbury
What is the average price for a property for sale in Wrenbury?
The average price for a property for sale in Wrenbury is £720,225. This amount is 40% higher than the average price in Tarporley. There are 384 property listings for sale in Wrenbury.
What streets have the most expensive properties for sale in Wrenbury?
The streets with the most expensive properties for sale in Wrenbury are Hall Lane at an average of £1,255,000, Radmore Green at an average of £961,000 and Whitchurch Road at an average of £901,666.
What streets have the most affordable properties for sale in Wrenbury?
The streets with the most affordable properties for sale in Wrenbury are Badcocks Lane at an average of £291,100, South Croft at an average of £305,000 and Stone House Lane at an average of £387,375.
Which train stations are available in or near Wrenbury?
Some of the train stations available in or near Wrenbury are Wrenbury, Nantwich and Delamere.
Property Price Paid in Wrenbury by Year
The average sold property price by year was:
| Year | Average Sold Price | Price Change |
Sold Properties
|
|---|---|---|---|
| 2025 | £562,512 | -52% |
8 Properties |
| 2024 | £854,500 | 21% |
14 Properties |
| 2023 | £676,071 | 2% |
14 Properties |
| 2022 | £660,288 | 8% |
13 Properties |
| 2021 | £606,895 | 3% |
10 Properties |
| 2020 | £590,416 | -11% |
12 Properties |
| 2019 | £653,923 | 34% |
13 Properties |
| 2018 | £430,859 | 2% |
21 Properties |
| 2017 | £420,711 | 3% |
14 Properties |
| 2016 | £409,150 | -44% |
13 Properties |
| 2015 | £587,800 | 42% |
10 Properties |
| 2014 | £341,083 | -32% |
12 Properties |
| 2013 | £451,250 | 22% |
10 Properties |
| 2012 | £352,857 | -25% |
7 Properties |
| 2011 | £440,572 | 11% |
7 Properties |
| 2010 | £391,285 | -16% |
7 Properties |
| 2009 | £452,900 | 36% |
5 Properties |
| 2008 | £290,000 | -69% |
2 Properties |
| 2007 | £489,111 | 29% |
13 Properties |
| 2006 | £348,272 | -46% |
11 Properties |
| 2005 | £510,055 | 31% |
9 Properties |
| 2004 | £349,800 | -14% |
10 Properties |
| 2003 | £399,625 | 34% |
16 Properties |
| 2002 | £263,750 | 24% |
16 Properties |
| 2001 | £200,483 | 1% |
9 Properties |
| 2000 | £197,866 | 15% |
15 Properties |
| 1999 | £168,828 | 16% |
16 Properties |
| 1998 | £142,600 | -21% |
10 Properties |
| 1997 | £172,681 | 22% |
11 Properties |
| 1996 | £133,833 | -3% |
9 Properties |
| 1995 | £137,243 | - |
8 Properties |
Property Price per Property Type in Wrenbury
Here you can find historic sold price data in order to help with your property search.
The average Property Paid Price for specific property types in the last three years are:
| Property Type | Average Sold Price | Sold Properties |
|---|---|---|
| Semi Detached House | £507,909.00 | 11 Semi Detached Houses |
| Terraced House | £562,500.00 | 10 Terraced Houses |
| Detached House | £981,073.00 | 15 Detached Houses |

