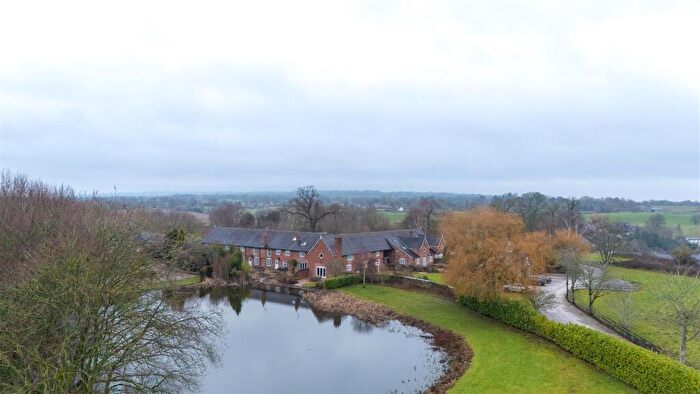
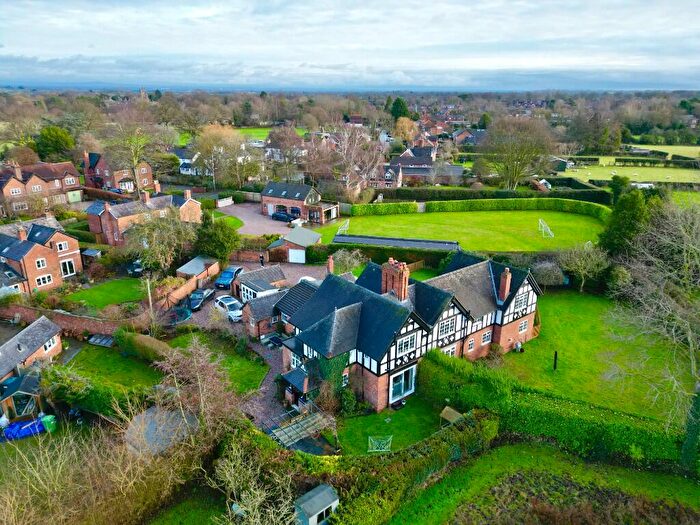
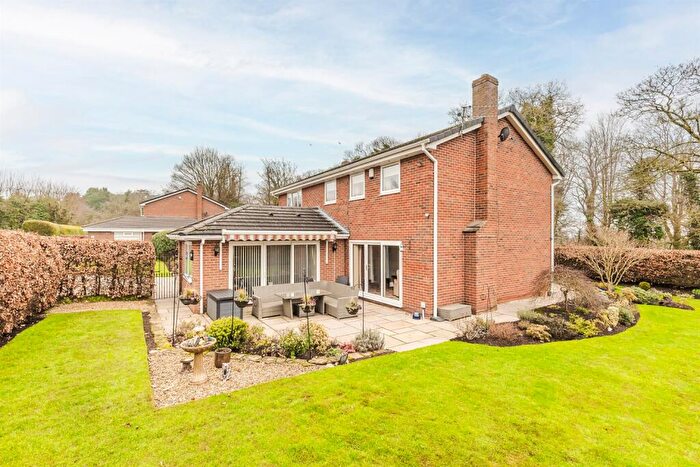
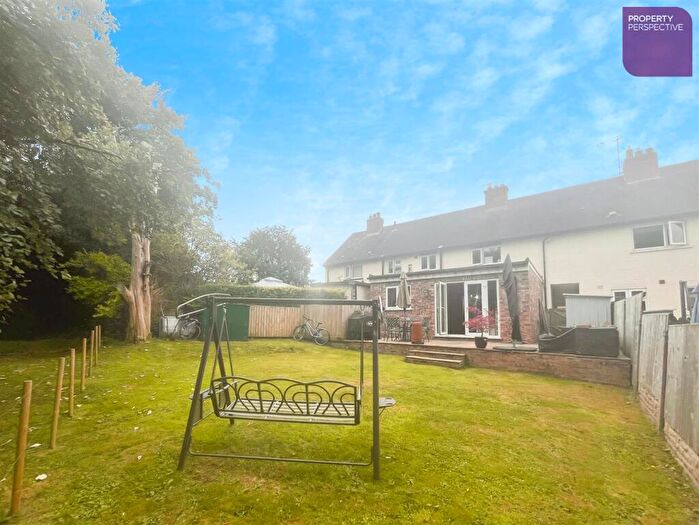
Houses for sale & to rent in Bunbury, Tarporley
House Prices in Bunbury
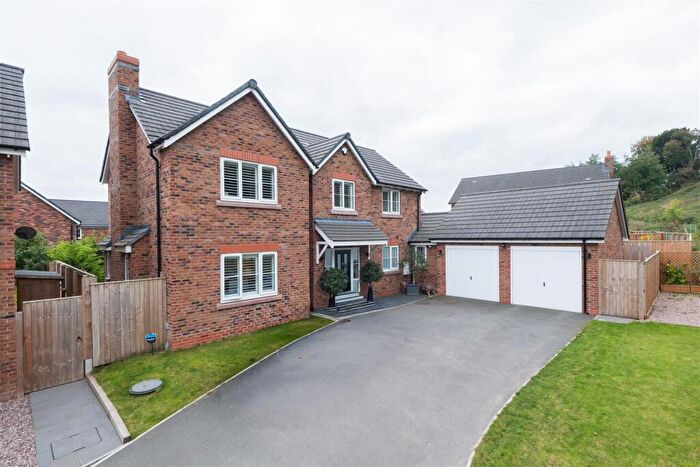
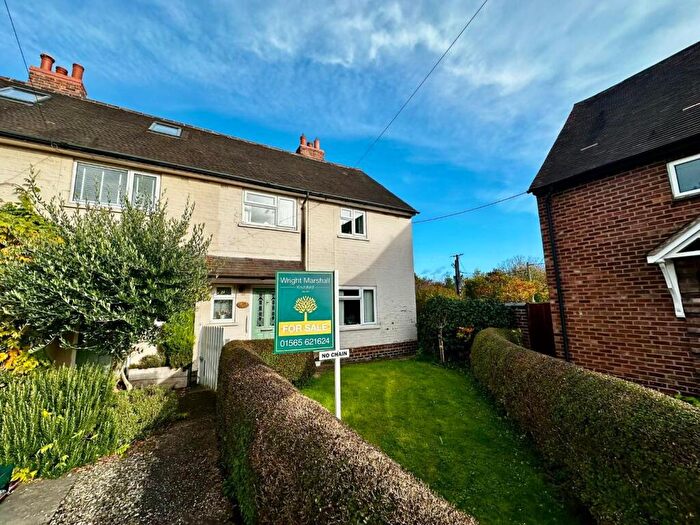
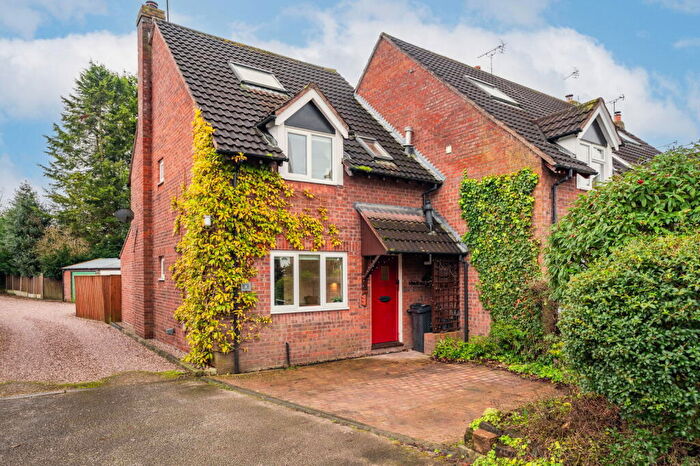
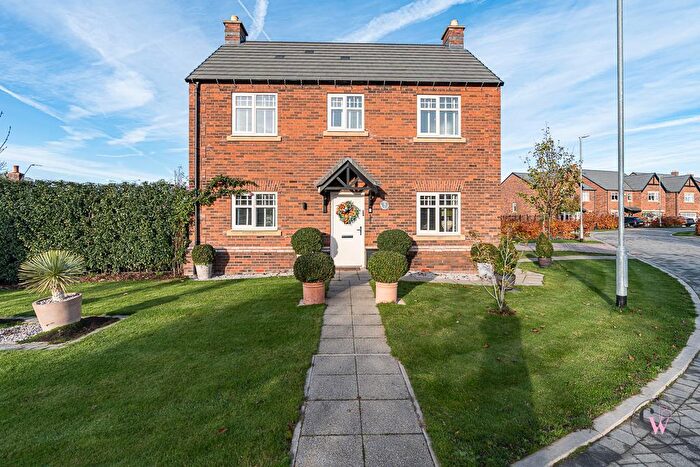
Properties in Bunbury have an average house price of £580,904.00 and had 93 Property Transactions within the last 3 years¹.
Bunbury is an area in Tarporley, Cheshire with 800 households², where the most expensive property was sold for £4,000,000.00.
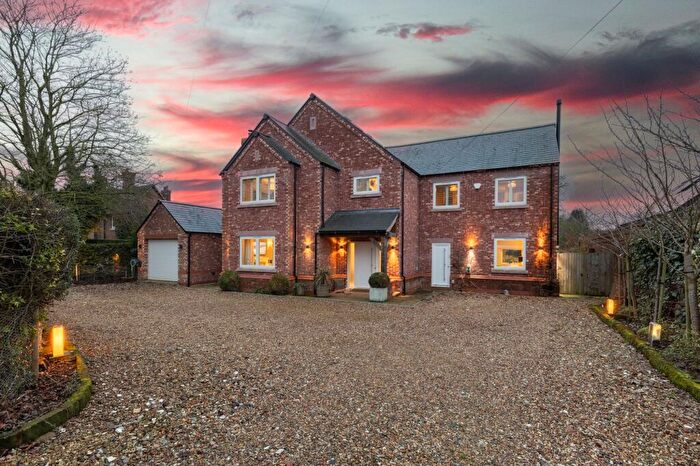
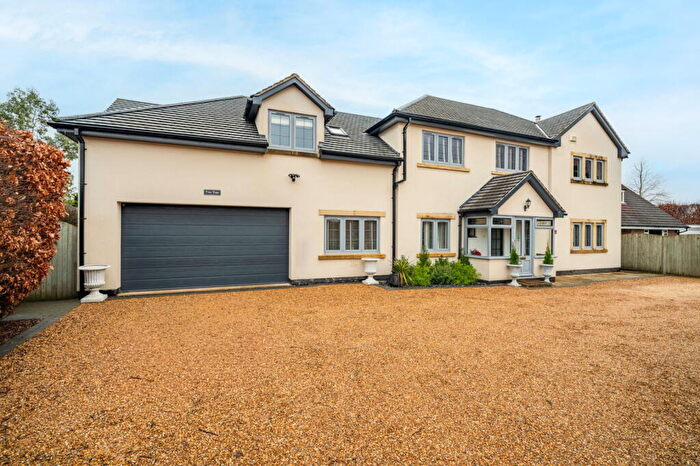
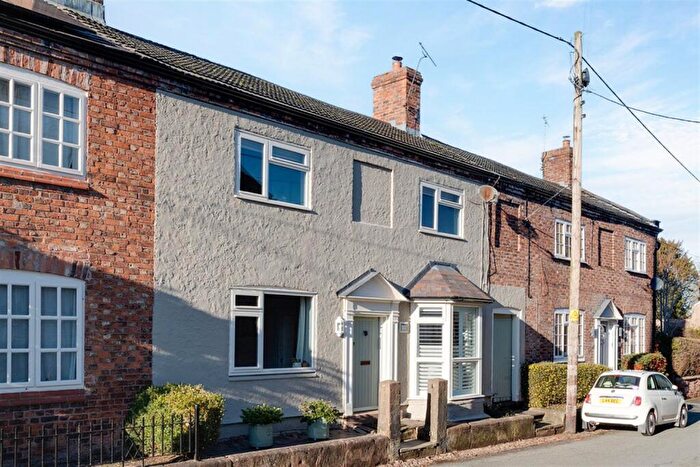
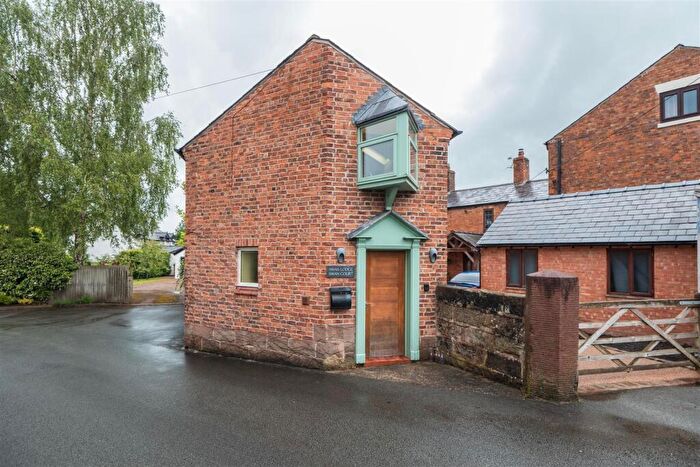
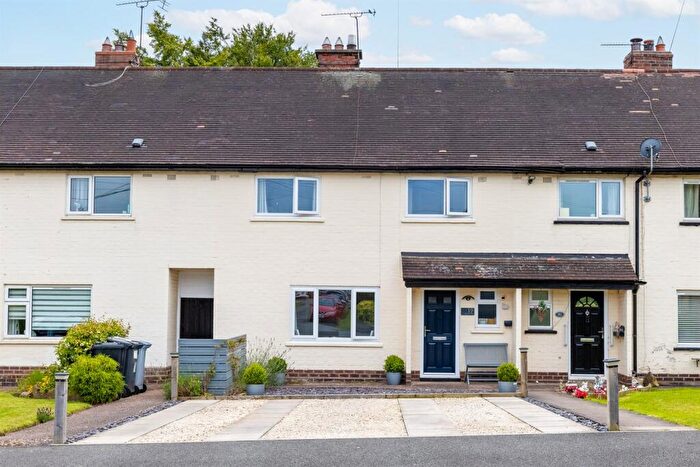
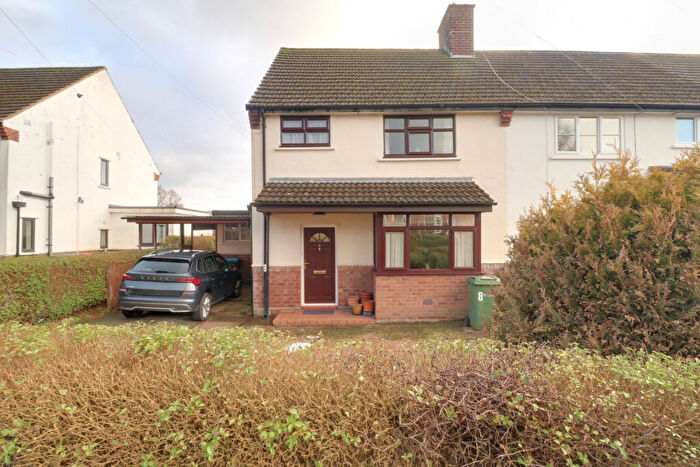
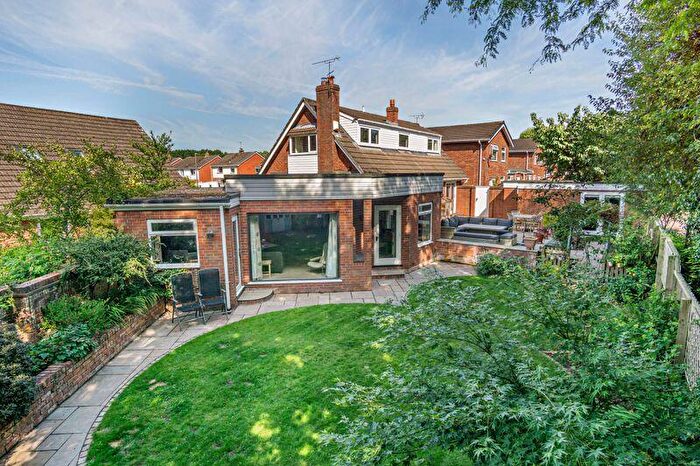
Properties for sale in Bunbury
Roads and Postcodes in Bunbury
Navigate through our locations to find the location of your next house in Bunbury, Tarporley for sale or to rent.
| Streets | Postcodes |
|---|---|
| Aldersey Way | CW6 9GN |
| Alpraham Green | CW6 9JQ CW6 9LJ |
| Back Lane | CW6 9LL |
| Barretts Green | CW6 9JZ |
| Birds Lane | CW6 9PX CW6 9PU CW6 9PY |
| Bowes Gate Road | CW6 9PJ CW6 9PP CW6 9QA CW6 9PH |
| Brains Lane | CW6 9HX |
| Bunbury Common | CW6 9QD CW6 9QE |
| Bunbury Lane | CW6 9JD CW6 9QR CW6 9QS CW6 9QU CW6 9QZ |
| Bunbury Locks | CW6 9QB |
| Bunbury Road | CW6 9GU |
| Calveley Green Lane | CW6 9GZ |
| Calveley Hall Lane | CW6 9LA CW6 9LB CW6 9LG CW6 9LD |
| Chester Road | CW6 9JE CW6 9JH CW6 9QF |
| Cholmondeston Road | CW6 9LF |
| Church Row | CW6 9PL |
| College Lane | CW6 9PG |
| Darkie Meadow | CW6 9RB |
| Davenport Place | CW6 9SF |
| Follet Close | CW6 9JA |
| Gowy Court | CW6 9LQ |
| Grange Close | CW6 9QL |
| Green Avenue | CW6 9LP |
| Hilbre Bank | CW6 9JG |
| Hill Close | CW6 9QJ |
| Hurst Close | CW6 9QP |
| Hurst Court | CW6 9QX |
| Long Lane | CW6 9JY CW6 9LH CW6 9JX |
| Masons Row | CW6 9JP |
| Moss Lane | CW6 9SY |
| Nantwich Road | CW6 9JJ CW6 9JS CW6 9JT CW6 9GT CW6 9GY CW6 9JW |
| Oak Gardens | CW6 9QN |
| Orchard Close | CW6 9PZ |
| Pulford Place | CW6 9ZE |
| Queen Street | CW6 9QY |
| Rookery Farm Road | CW6 9HB |
| Sadlers Wells | CW6 9NU CW6 9SG |
| School Lane | CW6 9LE CW6 9NR CW6 9NX CW6 9PA |
| St Boniface Close | CW6 9YR |
| Station Road | CW6 9JL |
| Swan Court | CW6 9QW |
| Swan Lane | CW6 9RA |
| The Acreage | CW6 9NQ |
| The Chantry | CW6 9JU |
| The Hawthorns | CW6 9SJ |
| The Highlands | CW6 9NT |
| The Square | CW6 9PW |
| Thornton Bank | CW6 9HW |
| Tilstone Bank | CW6 9QG |
| Tollemache Way | CW6 9YS |
| Tweddle Close | CW6 9GS |
| Vale Road | CW6 9JB |
| Vicarage Lane | CW6 9PE CW6 9PB |
| Wakes Meadow | CW6 9SH |
| Whitchurch Road | CW6 9SX |
| Willow Drive | CW6 9NY |
| Within Street | CW6 9NS |
| Wyche Lane | CW6 9PD CW6 9PS |
| Wyche Road | CW6 9PN CW6 9PR |
| CW6 9JN CW6 9JR CW6 9NL CW6 9RE |
Transport near Bunbury
-
Nantwich Station
-
Wrenbury Station
-
Winsford Station
-
Delamere Station
-
Cuddington Station
-
Mouldsworth Station
-
Crewe Station
-
Hartford Station
-
Greenbank Station
- FAQ
- Price Paid By Year
- Property Type Price
Frequently asked questions about Bunbury
What is the average price for a property for sale in Bunbury?
The average price for a property for sale in Bunbury is £580,904. This amount is 13% higher than the average price in Tarporley. There are 670 property listings for sale in Bunbury.
What streets have the most expensive properties for sale in Bunbury?
The streets with the most expensive properties for sale in Bunbury are Moss Lane at an average of £1,950,000, Vicarage Lane at an average of £1,944,000 and Birds Lane at an average of £895,000.
What streets have the most affordable properties for sale in Bunbury?
The streets with the most affordable properties for sale in Bunbury are Hill Close at an average of £130,000, Masons Row at an average of £170,000 and College Lane at an average of £203,125.
Which train stations are available in or near Bunbury?
Some of the train stations available in or near Bunbury are Nantwich, Wrenbury and Winsford.
Property Price Paid in Bunbury by Year
The average sold property price by year was:
| Year | Average Sold Price | Price Change |
Sold Properties
|
|---|---|---|---|
| 2025 | £699,155 | 31% |
24 Properties |
| 2024 | £480,161 | -28% |
38 Properties |
| 2023 | £612,846 | 2% |
31 Properties |
| 2022 | £598,375 | 21% |
27 Properties |
| 2021 | £471,643 | 15% |
58 Properties |
| 2020 | £401,437 | -25% |
46 Properties |
| 2019 | £502,692 | -1% |
38 Properties |
| 2018 | £505,630 | 16% |
44 Properties |
| 2017 | £425,553 | -12% |
24 Properties |
| 2016 | £477,760 | 3% |
29 Properties |
| 2015 | £465,321 | 32% |
37 Properties |
| 2014 | £318,187 | -1% |
24 Properties |
| 2013 | £321,018 | -10% |
25 Properties |
| 2012 | £352,336 | 3% |
22 Properties |
| 2011 | £340,921 | -0,2% |
20 Properties |
| 2010 | £341,671 | -1% |
26 Properties |
| 2009 | £344,495 | 25% |
23 Properties |
| 2008 | £259,750 | -39% |
12 Properties |
| 2007 | £360,652 | 10% |
43 Properties |
| 2006 | £325,063 | 13% |
36 Properties |
| 2005 | £282,588 | -11% |
17 Properties |
| 2004 | £314,417 | 16% |
34 Properties |
| 2003 | £262,858 | 33% |
39 Properties |
| 2002 | £175,586 | 6% |
35 Properties |
| 2001 | £165,438 | 18% |
30 Properties |
| 2000 | £135,429 | -18% |
37 Properties |
| 1999 | £160,284 | 20% |
35 Properties |
| 1998 | £127,662 | 9% |
27 Properties |
| 1997 | £116,577 | -1% |
43 Properties |
| 1996 | £118,051 | 2% |
23 Properties |
| 1995 | £115,450 | - |
20 Properties |
Property Price per Property Type in Bunbury
Here you can find historic sold price data in order to help with your property search.
The average Property Paid Price for specific property types in the last three years are:
| Property Type | Average Sold Price | Sold Properties |
|---|---|---|
| Semi Detached House | £411,825.00 | 35 Semi Detached Houses |
| Detached House | £752,807.00 | 48 Detached Houses |
| Terraced House | £338,388.00 | 9 Terraced Houses |
| Flat | £430,000.00 | 1 Flat |

