
Houses for sale in Tarporley, Cheshire
House Prices in Tarporley
Properties in Tarporley have an average house price of £518k and had 528 Property Transactions within the last 3 years.¹
Tarporley is an area in Cheshire with 5,747 households², where the most expensive property was sold for £4M.
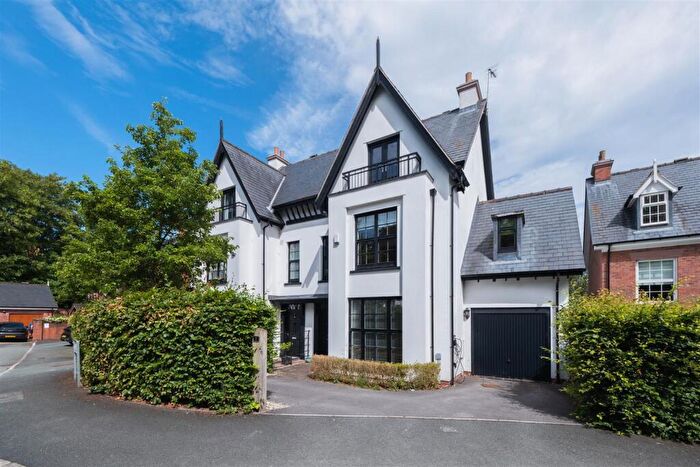
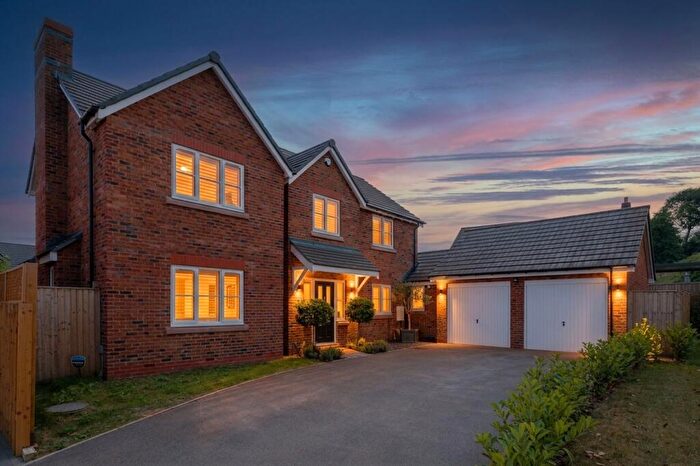
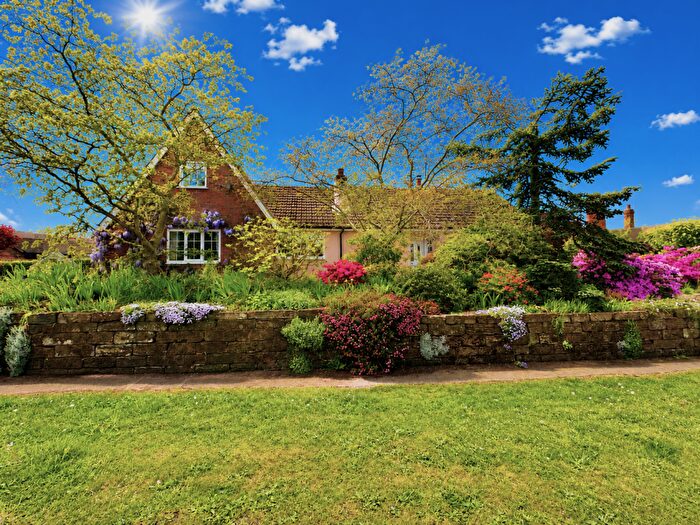
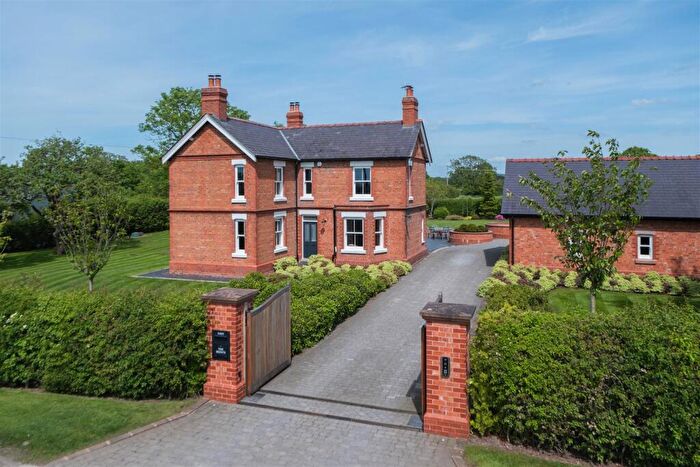
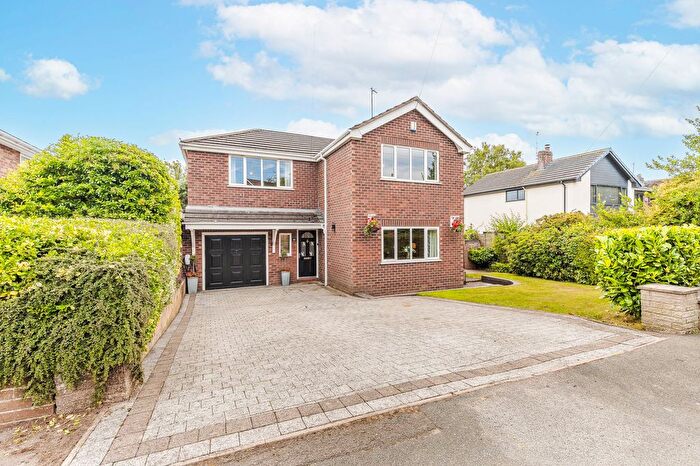
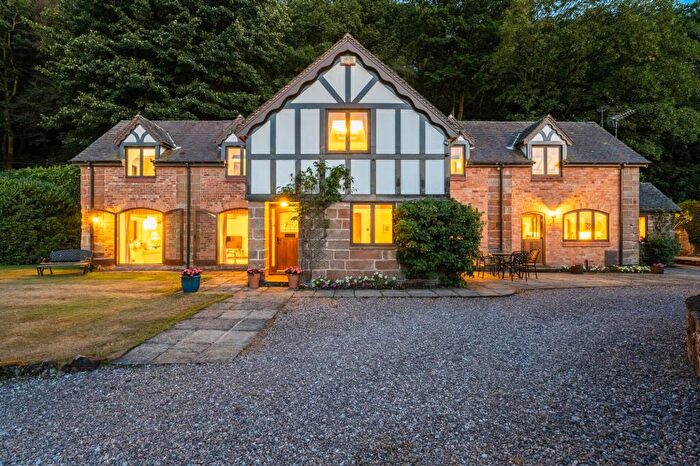
Properties for sale in Tarporley
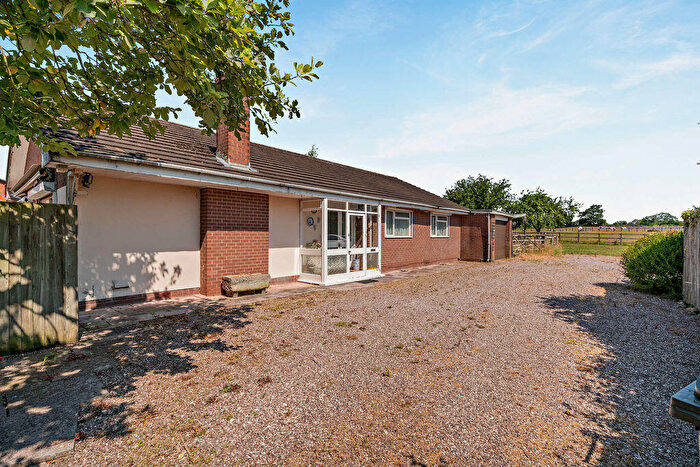
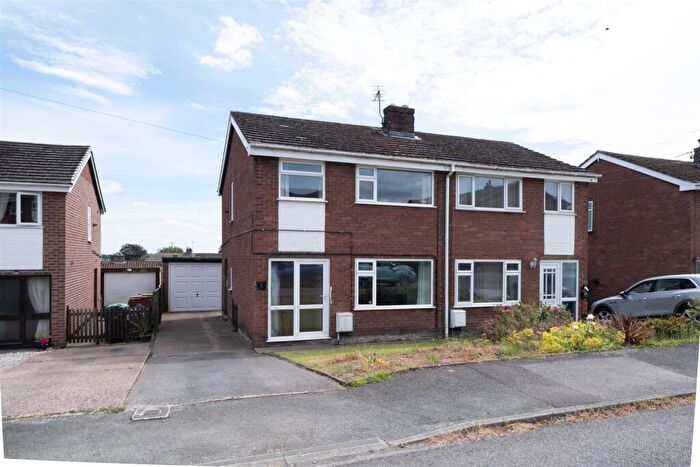
![]()
If you are looking to sell your house, let it out, or receive a property valuation, an expert can help you.
Click the button below to get started.


Neighbourhoods in Tarporley
Navigate through our locations to find the location of your next house in Tarporley, Cheshire for sale or to rent.
Property price trends in Tarporley
According to the latest Land Registry data, the average home in Tarporley sold for £522,000 in 2026. That figure comes from a substantial record of 6,399 sales logged over the past 31 years.
Prices have softened over the last three years. Compared with 2023, when the typical sale came in around £531,009, that's a fall of roughly 1.7%.
Looking back five years, average prices are up about 5.8% since 2021, a gain of around £28,578 in cash terms.
Zoom out to the past decade for the fuller picture. Back in 2016, homes here averaged £360,284, so the typical sold price has climbed about 44.9% since then, roughly 3.8% a year. Stretch the view to fifteen years and that annual pace eases back to about 2.8%.
Frequently asked questions about Tarporley
What is the average price for a property for sale in Tarporley?
The average price for a property for sale in Tarporley is £517,861. This amount is 61% higher than the average price in Cheshire. There are 4,309 property listings for sale in Tarporley.
What locations have the most expensive properties for sale in Tarporley?
The locations with the most expensive properties for sale in Tarporley are Wrenbury at an average of £720,225, Bunbury at an average of £583,496 and Tattenhall at an average of £573,500.
What locations have the most affordable properties for sale in Tarporley?
The locations with the most affordable properties for sale in Tarporley are Tarvin And Kelsall at an average of £454,333, Tarporley at an average of £485,181 and Tarvin & Kelsall at an average of £548,700.
Which train stations are available in or near Tarporley?
Some of the train stations available in or near Tarporley are Delamere, Mouldsworth and Cuddington.
Property Price Paid in Tarporley by Year
The average sold property price by year was:
| Year | Average Sold Price | Price Change |
Sold Properties
|
|---|---|---|---|
| 2026 | £522,000 | 3% |
12 Properties |
| 2025 | £505,396 | -2% |
156 Properties |
| 2024 | £517,297 | -3% |
207 Properties |
| 2023 | £531,009 | -2% |
153 Properties |
| 2022 | £543,204 | 9% |
216 Properties |
| 2021 | £493,422 | 13% |
308 Properties |
| 2020 | £431,601 | -6% |
229 Properties |
| 2019 | £455,500 | 12% |
226 Properties |
| 2018 | £400,421 | 4% |
268 Properties |
| 2017 | £384,260 | 6% |
257 Properties |
Property Price per Property Type in Tarporley
Here you can find historic sold price data in order to help with your property search.
The average Property Paid Price for specific property types in the last three years are:
| Property Type | Average Sold Price | Sold Properties |
|---|---|---|
| Semi Detached House | £365,631.00 | 168 Semi Detached Houses |
| Detached House | £670,150.00 | 269 Detached Houses |
| Terraced House | £375,277.00 | 79 Terraced Houses |
| Flat | £173,954.00 | 12 Flats |
Transport in Tarporley
Please see below transportation links in this area:
