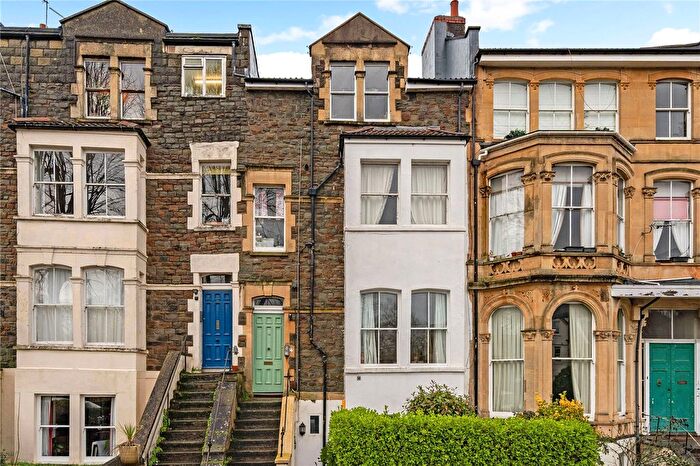
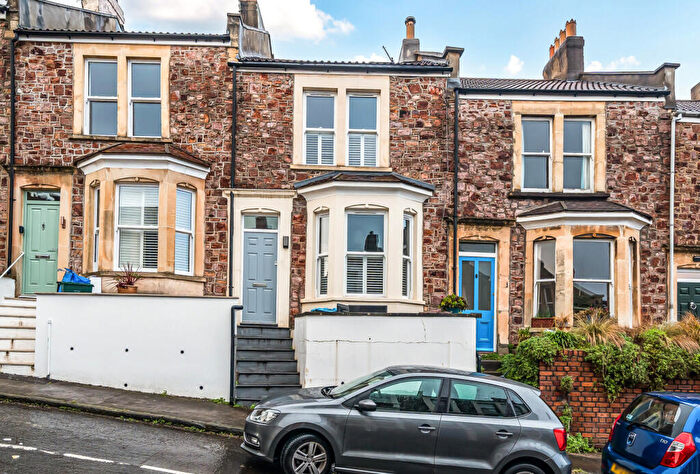
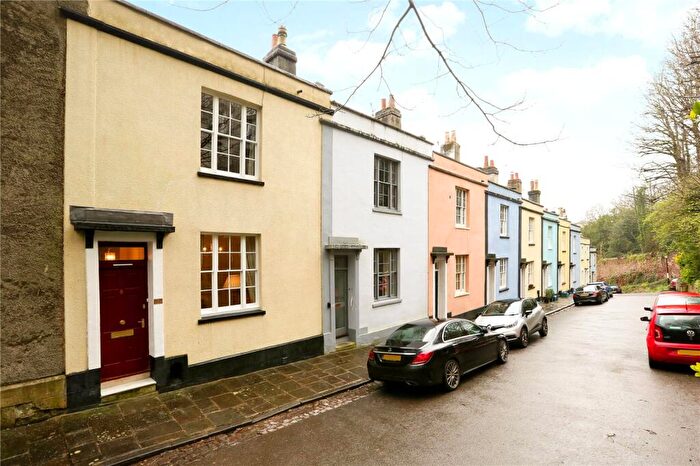
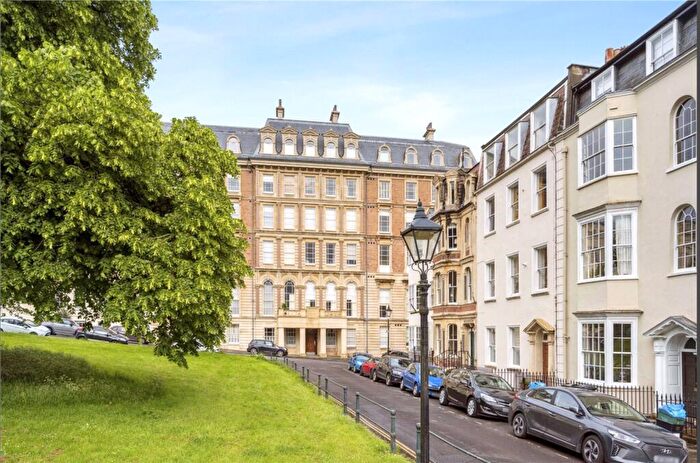
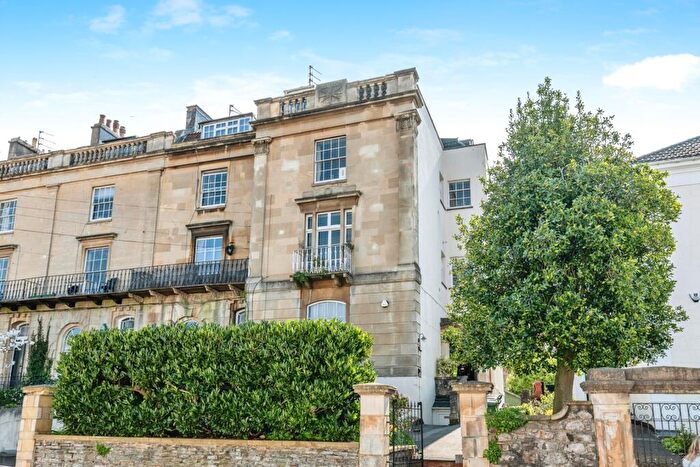
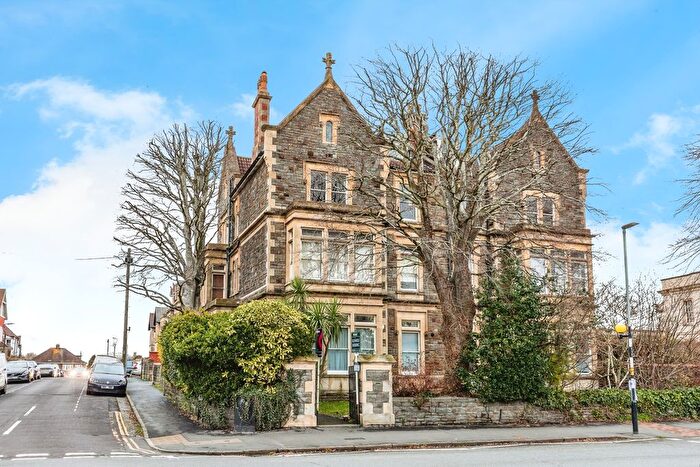
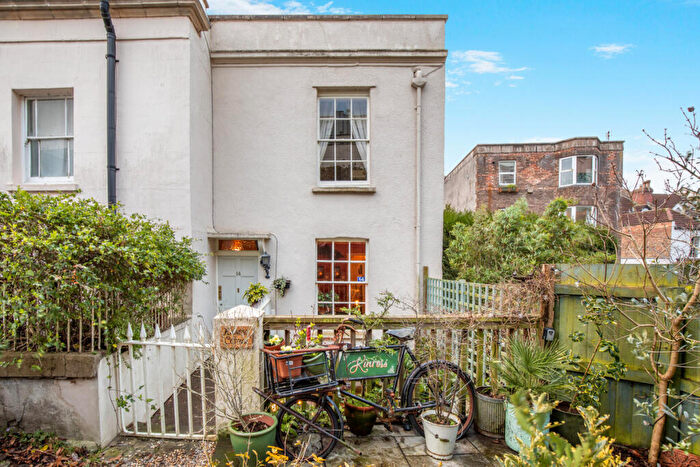
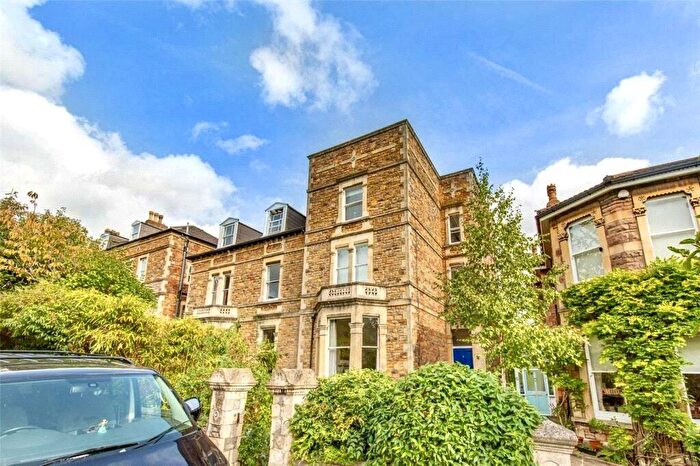
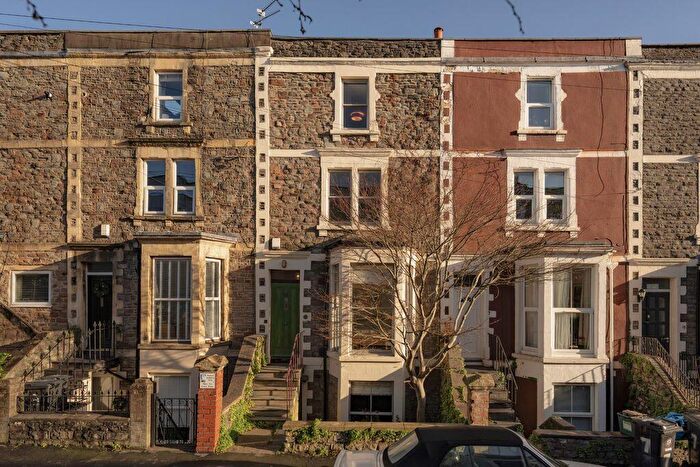
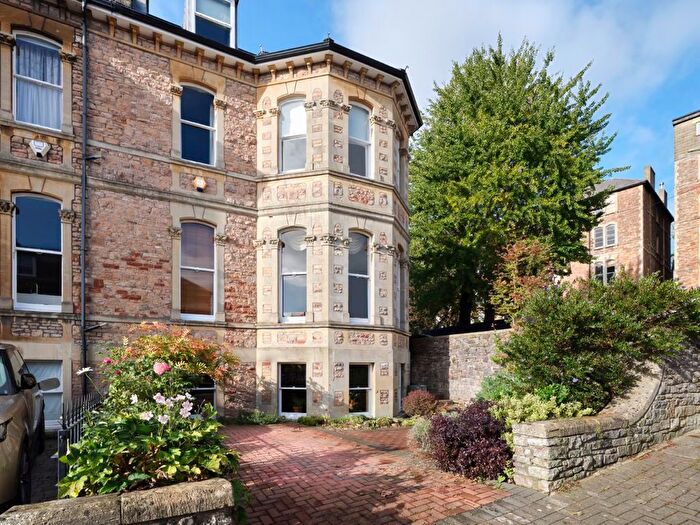
Houses for sale & to rent in Clifton Down, Bristol
House Prices in Clifton Down
Properties in Clifton Down have an average house price of £561,936.00 and had 44 Property Transactions within the last 3 years¹.
Clifton Down is an area in Bristol, City of Bristol with 259 households², where the most expensive property was sold for £950,000.00.
Properties for sale in Clifton Down
Roads and Postcodes in Clifton Down
Navigate through our locations to find the location of your next house in Clifton Down, Bristol for sale or to rent.
| Streets | Postcodes |
|---|---|
| Abbotsford Road | BS6 6EE |
| All Saints Gardens | BS8 2JD |
| Arlington Villas | BS8 2EH |
| Beaufort Road | BS8 2JR |
| Brighton Mews | BS8 2NX |
| Burlington Road | BS6 6TN |
| Chertsey Road | BS6 6NF |
| Clifton Down Station | BS8 2PN |
| Cobbler Lane | BS8 2AQ |
| Cotham Hill | BS6 6JT |
| Downside Road | BS8 2XF |
| Elm Lane | BS6 6TX |
| Hampton Park | BS6 6LP |
| Hampton Road | BS6 6HH |
| Hanbury Road | BS8 2EN |
| Highland Crescent | BS8 2YA |
| Home Gardens | BS6 6UR |
| Oakfield Road | BS8 2AP BS8 2BD BS8 2BF |
| Pembroke Road | BS8 3AZ BS8 3BQ |
| Pitville Place | BS6 6JZ |
| Queens Road | BS8 1NB BS8 1ND BS8 1NE BS8 1NF |
| Redland Hill | BS6 6BJ BS6 6SH BS6 6UU |
| St Johns Road | BS8 2ES BS8 2EU |
| Sunderland Place | BS8 1EG |
| Thorndale Mews | BS8 2JA |
| Upper Belgrave Road | BS8 2AY |
| Warwick Road | BS5 0YQ |
| Westbourne Place | BS8 1RU |
| Whatley Road | BS8 2AS |
| Whiteladies Road | BS8 2AG BS8 2AZ BS8 2LG BS8 2LY BS8 2NN BS8 2NP BS8 2NS BS8 2PB BS8 2QB BS8 2QG BS8 2QQ BS8 2QT BS8 2QW BS8 2QX BS8 2RA BS8 2RD BS8 2RL BS8 2RN BS8 2RR BS8 2RS BS8 2RW BS8 2SB BS8 2SQ BS8 2XS BS8 2XT |
| Worrall Road | BS8 2UH |
Transport near Clifton Down
-
Clifton Down Station
-
Redland Station
-
Montpelier Station
-
Bristol Temple Meads Station
-
Bedminster Station
-
Sea Mills Station
-
Stapleton Road Station
-
Lawrence Hill Station
-
Parson Street Station
- FAQ
- Price Paid By Year
- Property Type Price
Frequently asked questions about Clifton Down
What is the average price for a property for sale in Clifton Down?
The average price for a property for sale in Clifton Down is £561,936. This amount is 44% higher than the average price in Bristol. There are 1,909 property listings for sale in Clifton Down.
What streets have the most expensive properties for sale in Clifton Down?
The streets with the most expensive properties for sale in Clifton Down are Redland Hill at an average of £619,779, Upper Belgrave Road at an average of £600,000 and Whiteladies Road at an average of £448,000.
What streets have the most affordable properties for sale in Clifton Down?
The streets with the most affordable properties for sale in Clifton Down are Highland Crescent at an average of £350,000 and Oakfield Road at an average of £410,000.
Which train stations are available in or near Clifton Down?
Some of the train stations available in or near Clifton Down are Clifton Down, Redland and Montpelier.
Property Price Paid in Clifton Down by Year
The average sold property price by year was:
| Year | Average Sold Price | Price Change |
Sold Properties
|
|---|---|---|---|
| 2025 | £421,202 | -34% |
10 Properties |
| 2024 | £566,289 | -10% |
12 Properties |
| 2023 | £623,531 | 1% |
22 Properties |
| 2022 | £616,698 | -0,3% |
21 Properties |
| 2021 | £618,678 | 2% |
18 Properties |
| 2020 | £604,068 | 40% |
18 Properties |
| 2019 | £365,000 | -58% |
5 Properties |
| 2018 | £574,975 | 2% |
2 Properties |
| 2017 | £564,857 | 35% |
7 Properties |
| 2016 | £367,173 | -38% |
15 Properties |
| 2015 | £507,125 | -43% |
8 Properties |
| 2009 | £725,000 | 41% |
1 Property |
| 2007 | £425,000 | -0,4% |
1 Property |
| 2006 | £426,666 | 16% |
3 Properties |
| 2003 | £358,333 | -36% |
3 Properties |
| 2002 | £486,150 | 35% |
2 Properties |
| 2001 | £318,333 | 62% |
3 Properties |
| 2000 | £120,000 | -69% |
1 Property |
| 1998 | £203,000 | 21% |
2 Properties |
| 1997 | £161,150 | 40% |
1 Property |
| 1996 | £97,000 | - |
1 Property |
Property Price per Property Type in Clifton Down
Here you can find historic sold price data in order to help with your property search.
The average Property Paid Price for specific property types in the last three years are:
| Property Type | Average Sold Price | Sold Properties |
|---|---|---|
| Semi Detached House | £297,500.00 | 2 Semi Detached Houses |
| Terraced House | £440,000.00 | 2 Terraced Houses |
| Flat | £581,255.00 | 40 Flats |

