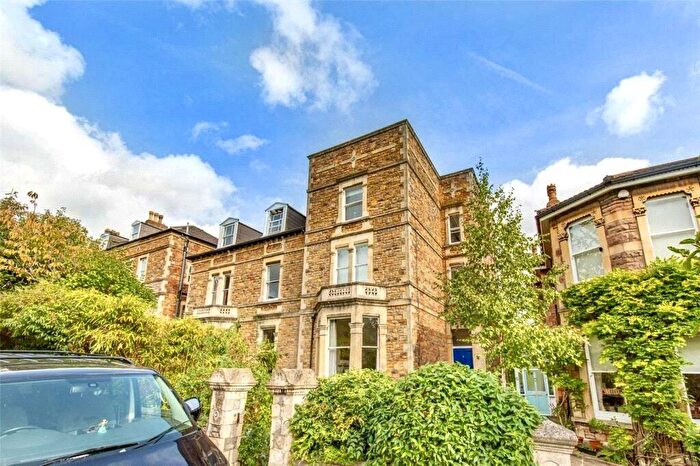
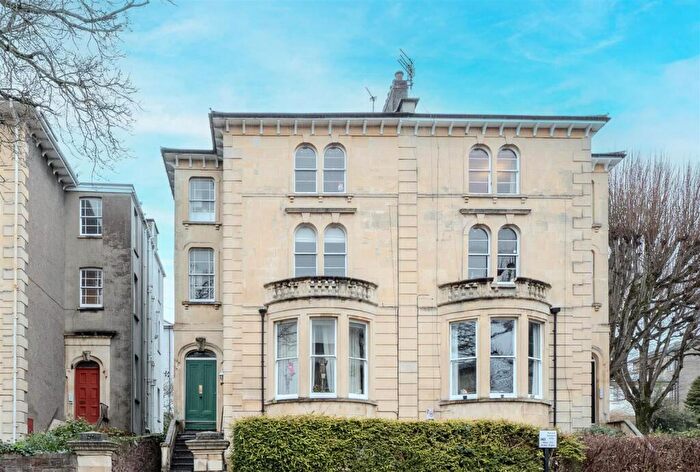
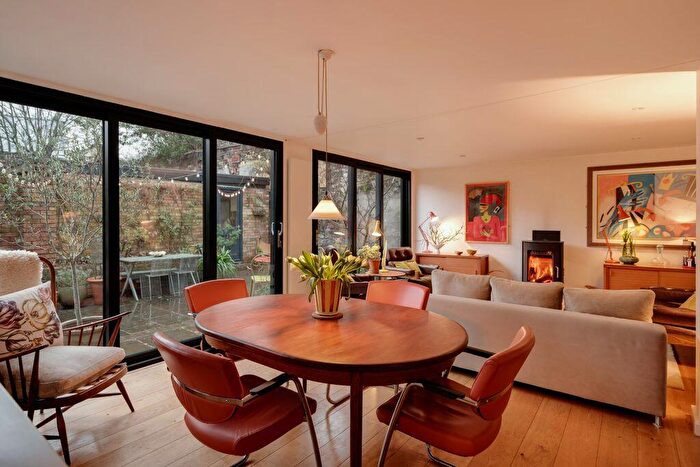
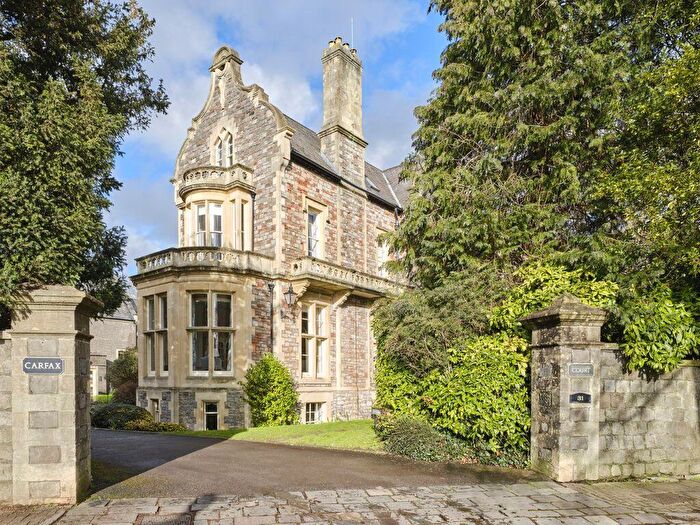
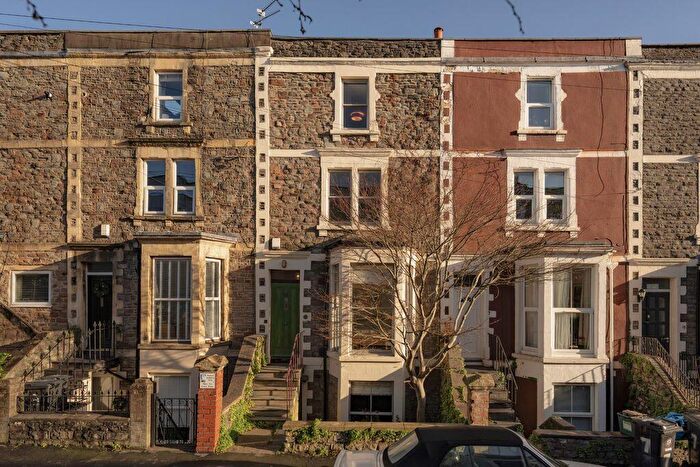
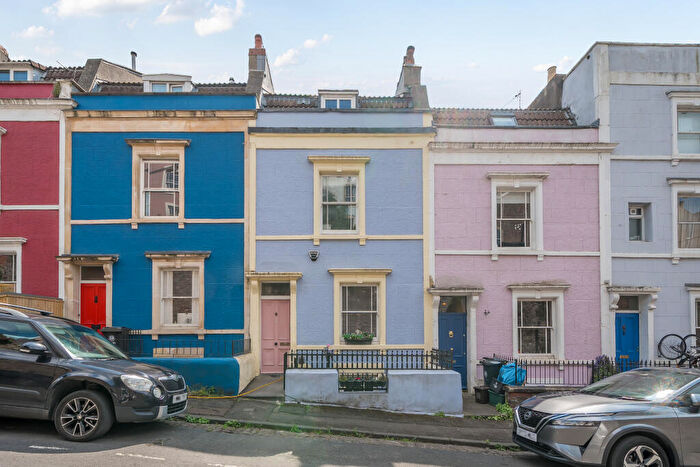
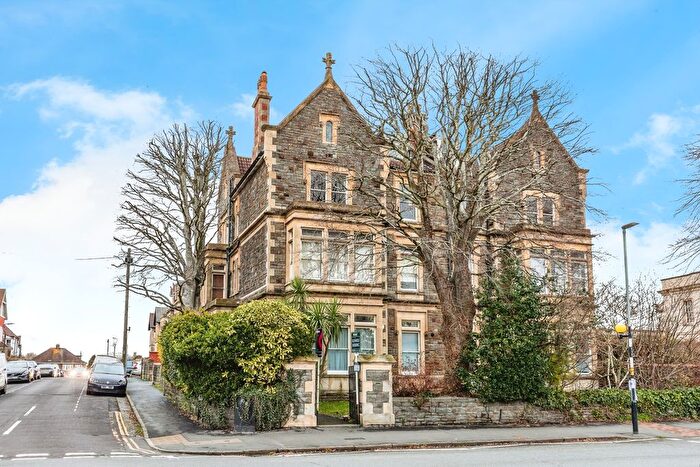
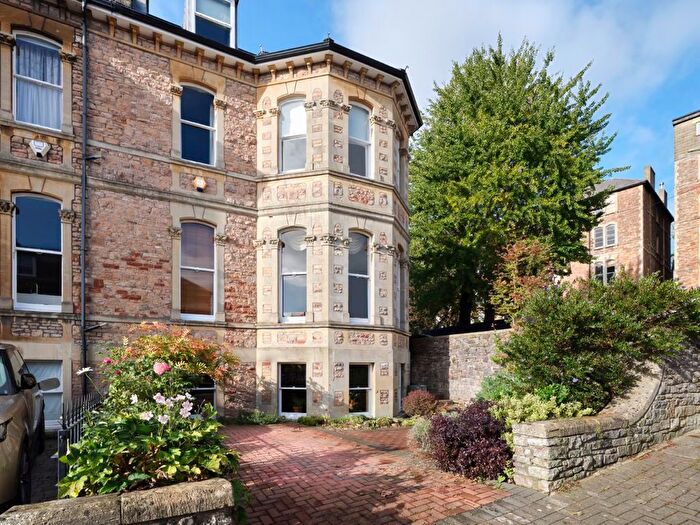
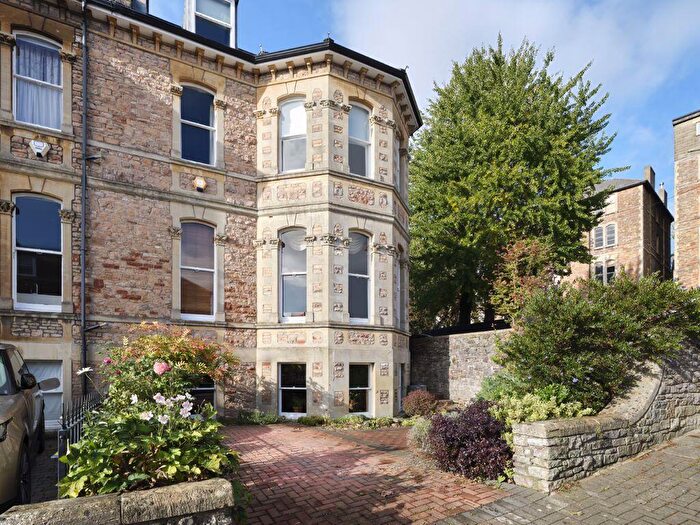
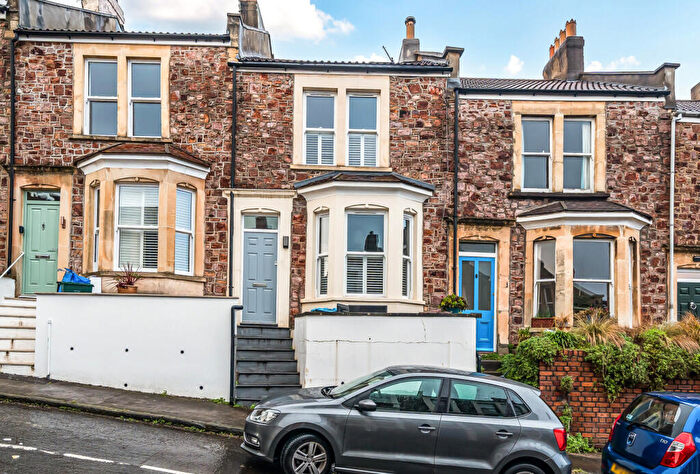
Houses for sale & to rent in Clifton East, Bristol
House Prices in Clifton East
Properties in Clifton East have an average house price of £485,450.00 and had 451 Property Transactions within the last 3 years¹.
Clifton East is an area in Bristol, City of Bristol with 4,484 households², where the most expensive property was sold for £2,850,000.00.
Properties for sale in Clifton East
Roads and Postcodes in Clifton East
Navigate through our locations to find the location of your next house in Clifton East, Bristol for sale or to rent.
| Streets | Postcodes |
|---|---|
| Alexandra Road | BS8 2DD |
| All Saints Road | BS8 2JE BS8 2JG BS8 2JH BS8 2JJ BS8 2JL BS8 2JQ |
| Alma Court | BS8 2HH BS8 2HJ BS8 2HQ |
| Alma Road | BS8 2BY BS8 2BZ BS8 2DB BS8 2DE BS8 2DG BS8 2DJ BS8 2DP BS8 2DW |
| Alma Road Avenue | BS8 2DH |
| Alma Vale Road | BS8 2HL BS8 2HN BS8 2HR BS8 2HS BS8 2HT BS8 2HY |
| Anglesea Place | BS8 2UL BS8 2UN |
| Apsley Mews | BS8 2SR |
| Apsley Road | BS8 2SH BS8 2SL BS8 2SN BS8 2SP BS8 2SS BS8 2ST BS8 2SW |
| Arlington Villas | BS8 2ED BS8 2EF BS8 2EG |
| Beaconsfield Road | BS8 2TR BS8 2TS |
| Beaufort Road | BS8 2JT BS8 2JU BS8 2JX BS8 2JY BS8 2JZ |
| Belgrave Hill | BS8 2UA |
| Belgrave Place | BS8 3DD |
| Bellevue | BS8 1DA BS8 1DB |
| Bellevue Terrace | BS8 1DD |
| Berkeley Place | BS8 1EH |
| Brighton Mews | BS8 2NW |
| Bruton Place | BS8 1JN |
| Buckingham Place | BS8 1LH BS8 1LJ |
| Buckingham Vale | BS8 2BU |
| Burton Court | BS8 1EE |
| Chantry Road | BS8 2QD BS8 2QF |
| Clifton Road | BS8 1AE |
| Codrington Place | BS8 3DE |
| Dover Place | BS8 1AL |
| Downfield Road | BS8 2TG BS8 2TH BS8 2TJ BS8 2TQ |
| Downside Road | BS8 2XE |
| Duchess Road | BS8 2LA |
| Eaton Crescent | BS8 2EJ |
| Frederick Place | BS8 1AS |
| Gordon Road | BS8 1AP |
| Gorse Lane | BS8 1DH |
| Hanbury Road | BS8 2EP BS8 2EW |
| High Street | BS8 2YF |
| Highland Crescent | BS8 2YJ |
| Highland Place | BS8 2UG |
| Highland Square | BS8 2YB |
| Hughenden Road | BS8 2TT |
| Hurle Crescent | BS8 2SX BS8 2SZ BS8 2TA |
| Hurle Road | BS8 2SY |
| Jacobs Wells Road | BS8 1DJ BS8 1DQ BS8 1EU |
| Kensington Place | BS8 3AH BS8 3DY |
| Kensington Villas | BS8 3AJ |
| Kings Parade Avenue | BS8 2RB BS8 2RE |
| Lansdown Place | BS8 3AE BS8 3AF |
| Leigh Road | BS8 2DA |
| Lower Clifton Hill | BS8 1BT |
| Melrose Avenue | BS8 2NB |
| Melrose Place | BS8 2NG BS8 2NQ |
| Meridian Place | BS8 1JG BS8 1JJ BS8 1JL |
| Meridian Vale | BS8 1BY |
| Miles Road | BS8 2JB BS8 2JN BS8 2JW |
| Mornington Road | BS8 2UU |
| Normanton Road | BS8 2TY |
| Oakfield Grove | BS8 2BL BS8 2BN |
| Oakfield Place | BS8 2BJ |
| Oakfield Road | BS8 2AH BS8 2AJ BS8 2AL BS8 2AT BS8 2AW BS8 2AX BS8 2BA BS8 2BB BS8 2BG |
| Old Vicarage Place | BS8 2TD |
| Osborne Road | BS8 2HA BS8 2HB |
| Park Place | BS8 1JP BS8 1JW |
| Pembroke Grove | BS8 3DA BS8 3DB |
| Pembroke Road | BS8 3AU BS8 3AX BS8 3BA BS8 3BB BS8 3DT BS8 3DX BS8 3ED BS8 3EG BS8 3EQ BS8 3ER BS8 3EW |
| Pro Cathedral Lane | BS8 1LB |
| Quarry Steps | BS8 2UD |
| Queens Road | BS8 1LQ BS8 1LW BS8 1RT BS8 1SA |
| Richmond Dale | BS8 2UB BS8 2UX |
| Richmond Hill | BS8 1AT BS8 1BA BS8 1BL |
| Richmond Hill Avenue | BS8 1BG |
| Richmond Mews | BS8 3DH |
| Richmond Park Road | BS8 3AP BS8 3AR BS8 3AS BS8 3AT |
| Richmond Terrace | BS8 1AA BS8 1AB BS8 1AD |
| Rose Terrace | BS8 1AW |
| Royal Park | BS8 3AL BS8 3AN BS8 3AW BS8 3DJ |
| Southleigh Road | BS8 2BH BS8 2BQ |
| St Johns Mews | BS8 2ER |
| St Johns Road | BS8 2ET BS8 2EX BS8 2EY BS8 2EZ BS8 2HD BS8 2HG |
| St Pauls Road | BS8 1LP BS8 1LR BS8 1LT BS8 1LX |
| Sunderland Place | BS8 1NA |
| Sunningdale | BS8 2NF |
| Sutherland Place | BS8 2TZ |
| Thorndale | BS8 2HU |
| Thorndale Mews | BS8 2HX |
| Tottenham Place | BS8 1AJ |
| Upper Belgrave Road | BS8 2XH BS8 2XJ BS8 2XL BS8 2XN BS8 2XP BS8 2XQ BS8 2XW |
| Vyvyan Road | BS8 3AD |
| Vyvyan Terrace | BS8 3DF BS8 3DG |
| Wellington Park | BS8 2UR BS8 2UT BS8 2UW |
| Wesley Place | BS8 2YD |
| Westbourne Place | BS8 1RX BS8 1RZ |
| Westbourne Villas | BS8 1RY |
| Wetherell Place | BS8 1AR |
| Whatley Road | BS8 2PS BS8 2PU |
| Whiteladies Road | BS8 1PD BS8 2NH BS8 2PY BS8 2QA BS8 2QN BS8 2QY BS8 2RP BS8 2XU BS8 2XZ |
| Worrall Mews | BS8 2HF |
| Worrall Place | BS8 2WP |
| Worrall Road | BS8 2TU BS8 2TX BS8 2UE BS8 2UF |
| York Place | BS8 1AH BS8 1EB |
| York Street | BS8 2YE |
Transport near Clifton East
-
Clifton Down Station
-
Redland Station
-
Montpelier Station
-
Bristol Temple Meads Station
-
Bedminster Station
-
Sea Mills Station
-
Parson Street Station
-
Stapleton Road Station
-
Lawrence Hill Station
- FAQ
- Price Paid By Year
- Property Type Price
Frequently asked questions about Clifton East
What is the average price for a property for sale in Clifton East?
The average price for a property for sale in Clifton East is £485,450. This amount is 25% higher than the average price in Bristol. There are 2,128 property listings for sale in Clifton East.
What streets have the most expensive properties for sale in Clifton East?
The streets with the most expensive properties for sale in Clifton East are Duchess Road at an average of £2,400,000, Tottenham Place at an average of £1,385,000 and Richmond Hill at an average of £1,296,916.
What streets have the most affordable properties for sale in Clifton East?
The streets with the most affordable properties for sale in Clifton East are Jacobs Wells Road at an average of £226,500, Westbourne Villas at an average of £232,750 and Whiteladies Road at an average of £256,600.
Which train stations are available in or near Clifton East?
Some of the train stations available in or near Clifton East are Clifton Down, Redland and Montpelier.
Property Price Paid in Clifton East by Year
The average sold property price by year was:
| Year | Average Sold Price | Price Change |
Sold Properties
|
|---|---|---|---|
| 2025 | £486,621 | 7% |
125 Properties |
| 2024 | £450,587 | -16% |
171 Properties |
| 2023 | £522,966 | -3% |
155 Properties |
| 2022 | £538,729 | 8% |
185 Properties |
| 2021 | £496,006 | 7% |
250 Properties |
| 2020 | £459,426 | 4% |
153 Properties |
| 2019 | £439,782 | 3% |
177 Properties |
| 2018 | £425,022 | -1% |
180 Properties |
| 2017 | £427,297 | 3% |
209 Properties |
| 2016 | £415,215 | 17% |
212 Properties |
| 2015 | £344,146 | 2% |
240 Properties |
| 2014 | £338,747 | 13% |
287 Properties |
| 2013 | £294,046 | 2% |
214 Properties |
| 2012 | £287,199 | -2% |
207 Properties |
| 2011 | £292,184 | -1% |
177 Properties |
| 2010 | £294,866 | 5% |
209 Properties |
| 2009 | £280,376 | -2% |
196 Properties |
| 2008 | £286,819 | -2% |
169 Properties |
| 2007 | £291,306 | 11% |
320 Properties |
| 2006 | £258,670 | 5% |
353 Properties |
| 2005 | £245,784 | -3% |
312 Properties |
| 2004 | £252,830 | 8% |
329 Properties |
| 2003 | £231,776 | 14% |
301 Properties |
| 2002 | £198,692 | 14% |
336 Properties |
| 2001 | £170,033 | 9% |
327 Properties |
| 2000 | £153,914 | 16% |
316 Properties |
| 1999 | £129,574 | 17% |
492 Properties |
| 1998 | £108,008 | 18% |
382 Properties |
| 1997 | £89,059 | 6% |
408 Properties |
| 1996 | £83,443 | 4% |
355 Properties |
| 1995 | £79,989 | - |
243 Properties |
Property Price per Property Type in Clifton East
Here you can find historic sold price data in order to help with your property search.
The average Property Paid Price for specific property types in the last three years are:
| Property Type | Average Sold Price | Sold Properties |
|---|---|---|
| Flat | £383,570.00 | 364 Flats |
| Semi Detached House | £1,206,594.00 | 19 Semi Detached Houses |
| Detached House | £1,081,556.00 | 8 Detached Houses |
| Terraced House | £795,678.00 | 60 Terraced Houses |

