
Houses for sale & to rent in BS10 7QZ, Hallen Close, Henbury, Bristol
House Prices in BS10 7QZ, Hallen Close, Henbury
Properties in BS10 7QZ have no sales history available within the last 3 years. BS10 7QZ is a postcode in Hallen Close located in Henbury, an area in Bristol, City of Bristol, with 5 households².
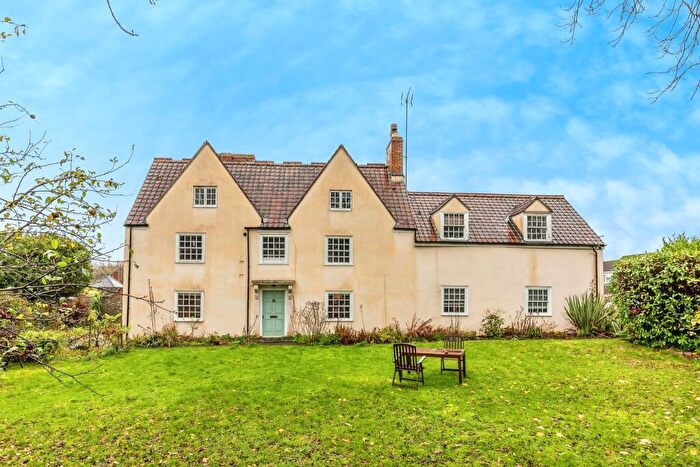
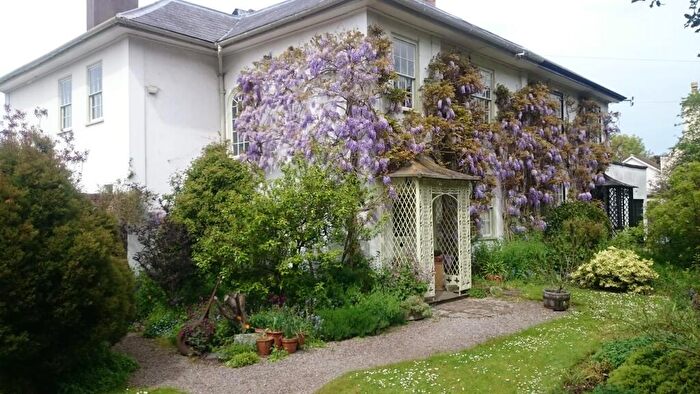
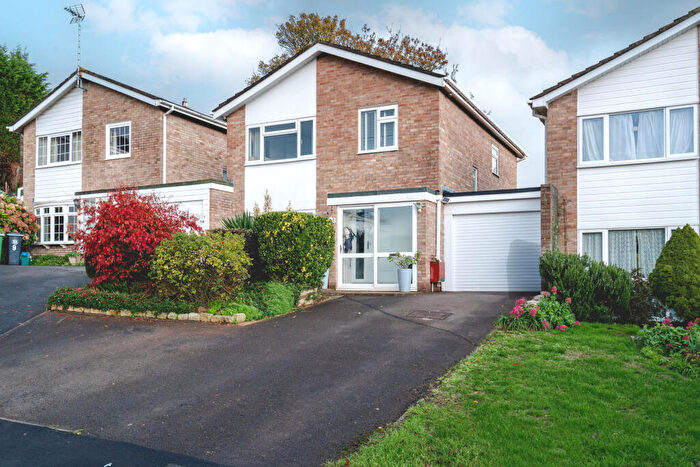
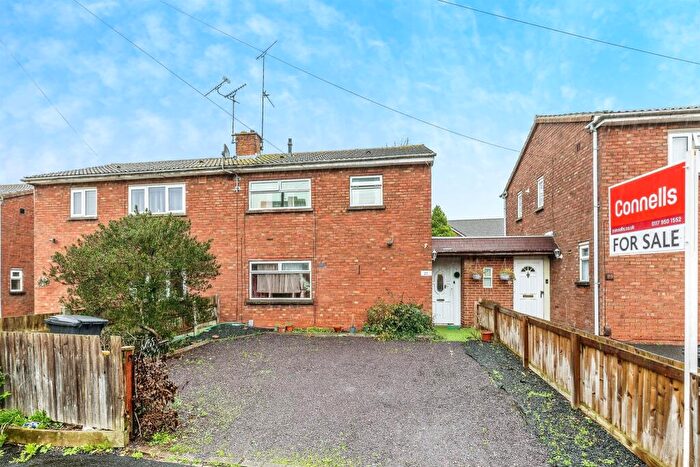
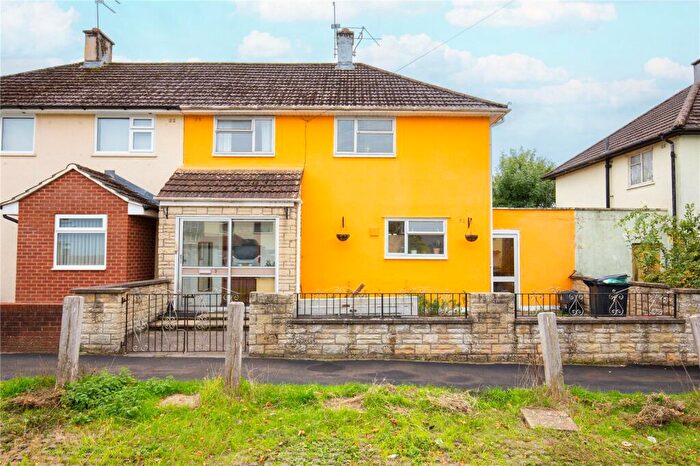
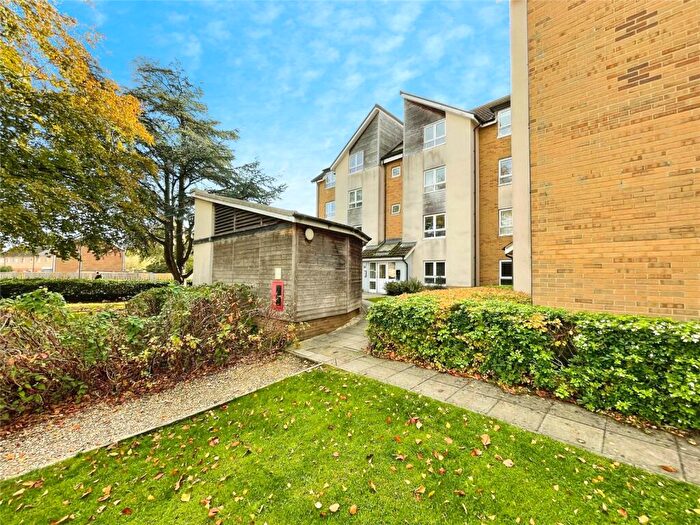
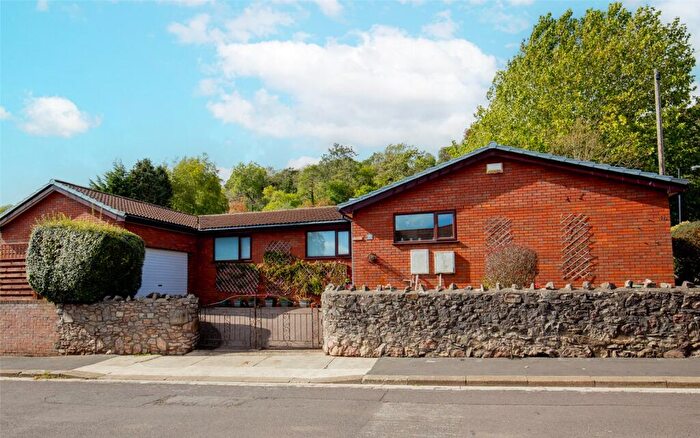
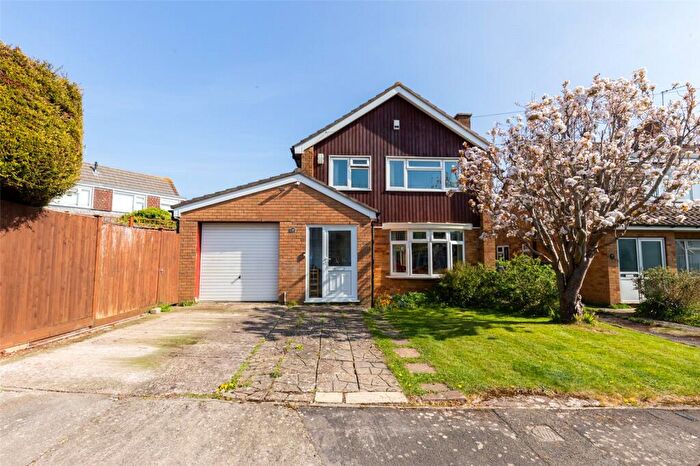
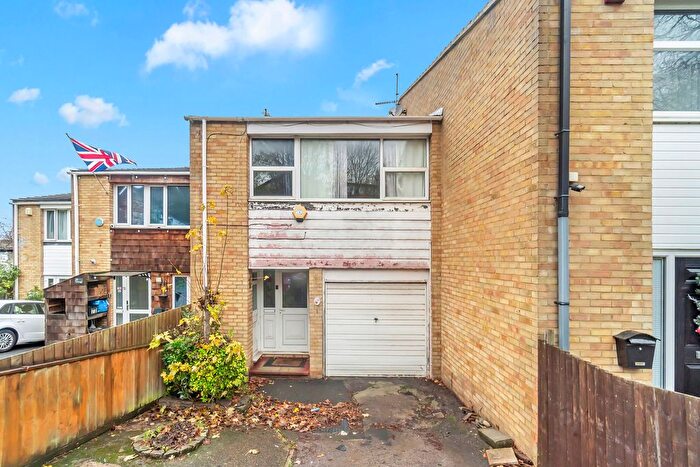
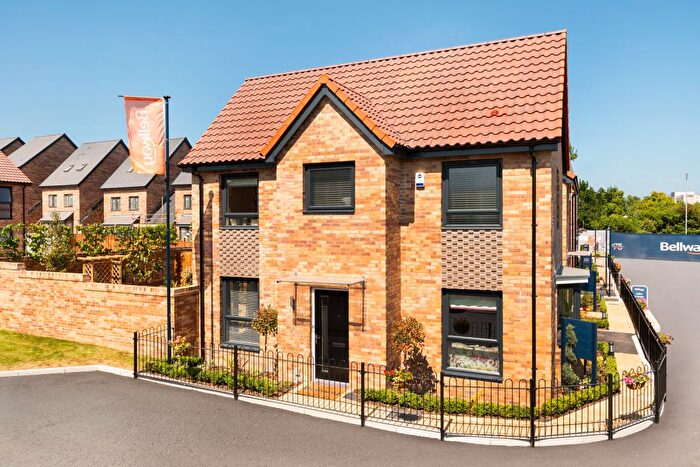
Properties for sale near BS10 7QZ, Hallen Close

![]()
If you are looking to sell your house, let it out, or receive a property valuation, an expert can help you.
Click the button below to get started.
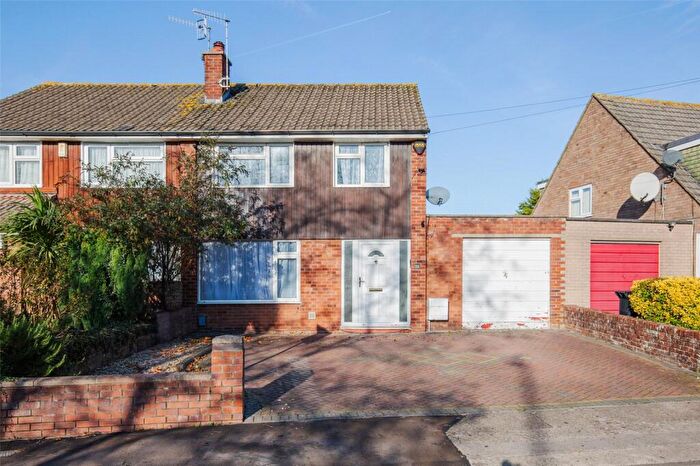
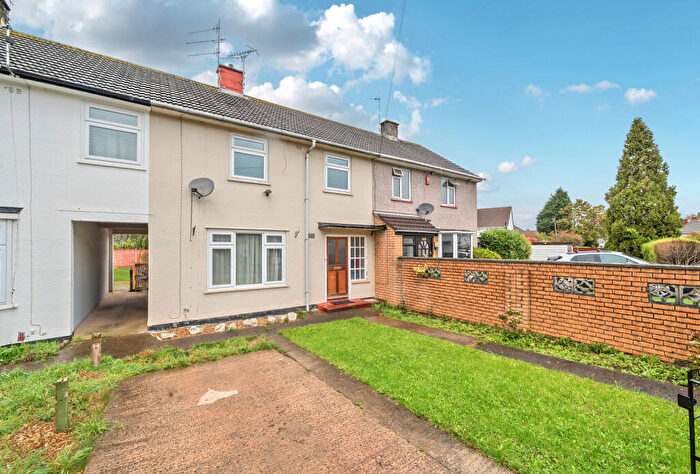
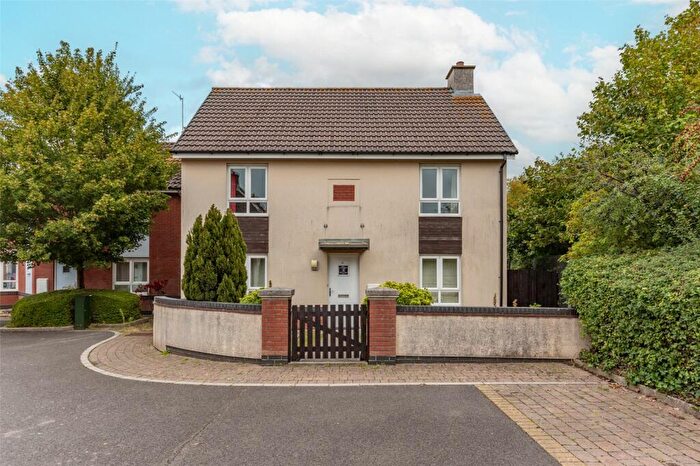

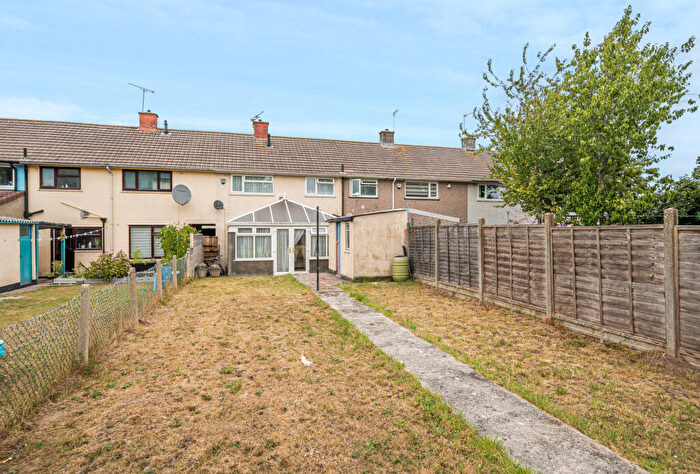
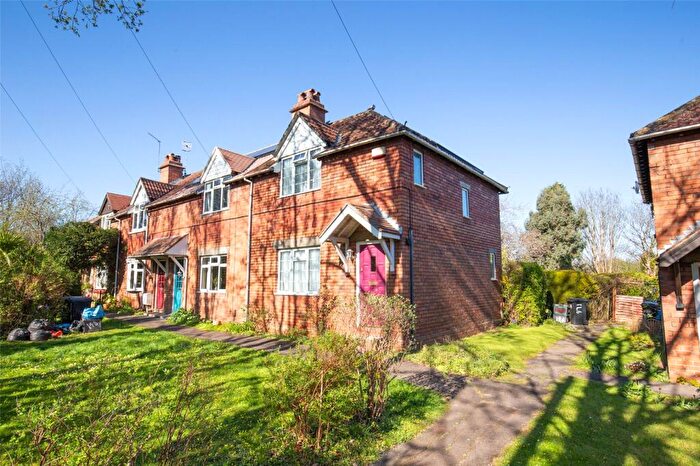
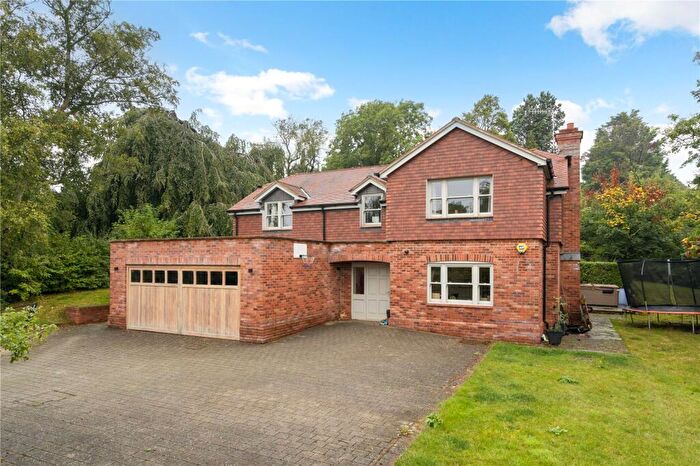
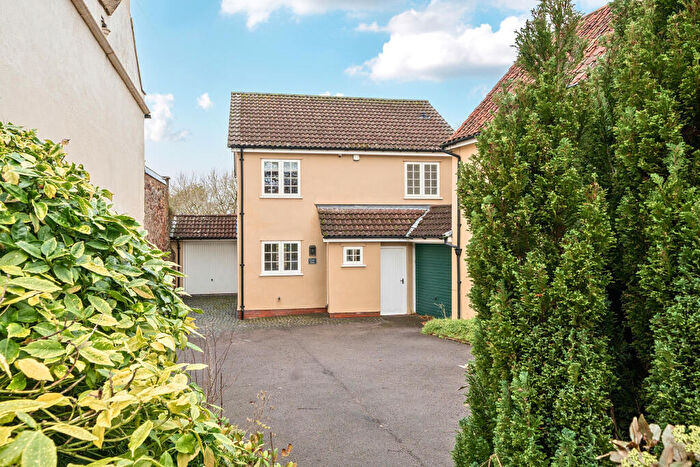
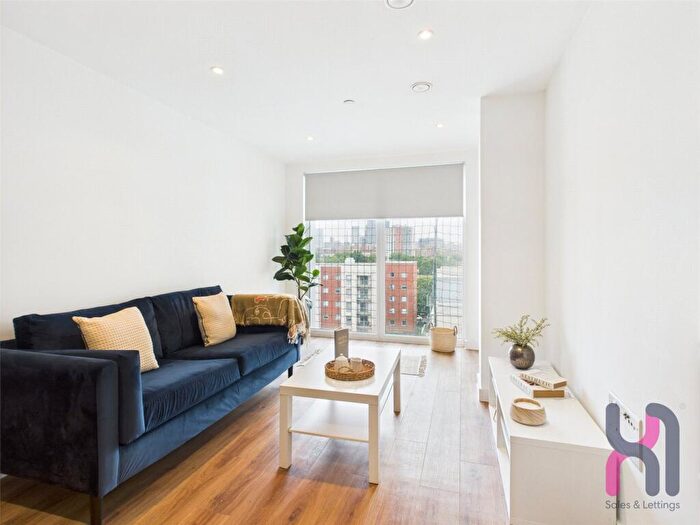
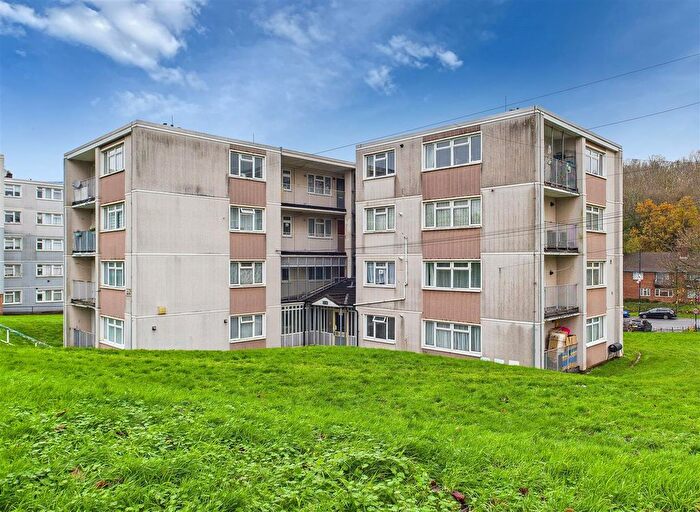
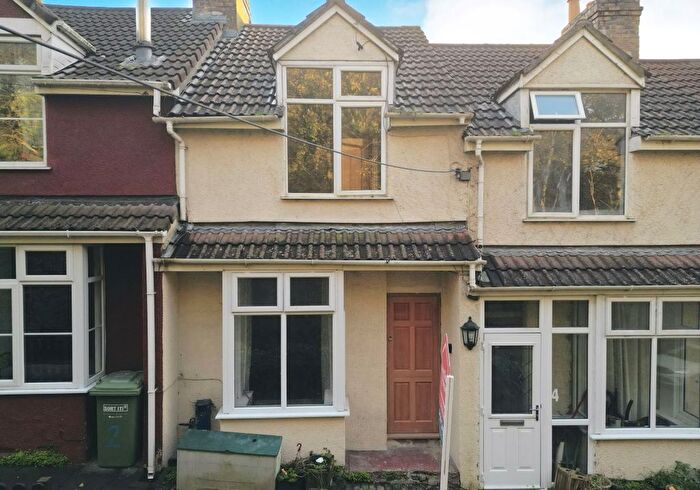
Previously listed properties near BS10 7QZ, Hallen Close
![]()
If you are looking to sell your house, let it out, or receive a property valuation, an expert can help you.
Click the button below to get started.
Price Paid in Hallen Close, BS10 7QZ, Henbury
4 Hallen Close, BS10 7QZ, Henbury Bristol
Property 4 has been sold 2 times. The last time it was sold was in 29/07/2019 and the sold price was £373,000.00.
This semi detached house, sold as a freehold on 29/07/2019, is a 103 sqm semi-detached house with an EPC rating of C.
| Date | Price | Property Type | Tenure | Classification |
|---|---|---|---|---|
| 29/07/2019 | £373,000.00 | Semi Detached House | freehold | Established Building |
| 07/07/2011 | £265,000.00 | Semi Detached House | freehold | Established Building |
5 Hallen Close, BS10 7QZ, Henbury Bristol
Property 5 has been sold 1 time. The last time it was sold was in 20/04/2018 and the sold price was £430,000.00.
This detached house, sold as a freehold on 20/04/2018, is a 124 sqm detached house with an EPC rating of D.
| Date | Price | Property Type | Tenure | Classification |
|---|---|---|---|---|
| 20/04/2018 | £430,000.00 | Detached House | freehold | Established Building |
3 Hallen Close, BS10 7QZ, Henbury Bristol
Property 3 has been sold 1 time. The last time it was sold was in 16/12/2004 and the sold price was £250,000.00.
This is a Semi Detached House which was sold as a freehold in 16/12/2004
| Date | Price | Property Type | Tenure | Classification |
|---|---|---|---|---|
| 16/12/2004 | £250,000.00 | Semi Detached House | freehold | Established Building |
Transport near BS10 7QZ, Hallen Close

House price paid reports for BS10 7QZ, Hallen Close
Click on the buttons below to see price paid reports by year or property price:
- Price Paid By Year
Property Price Paid in BS10 7QZ, Hallen Close by Year
The average sold property price by year was:
| Year | Average Sold Price | Price Change |
Sold Properties
|
|---|---|---|---|
| 2019 | £373,000 | -15% |
1 Property |
| 2018 | £430,000 | 38% |
1 Property |
| 2011 | £265,000 | 6% |
1 Property |
| 2004 | £250,000 | - |
1 Property |