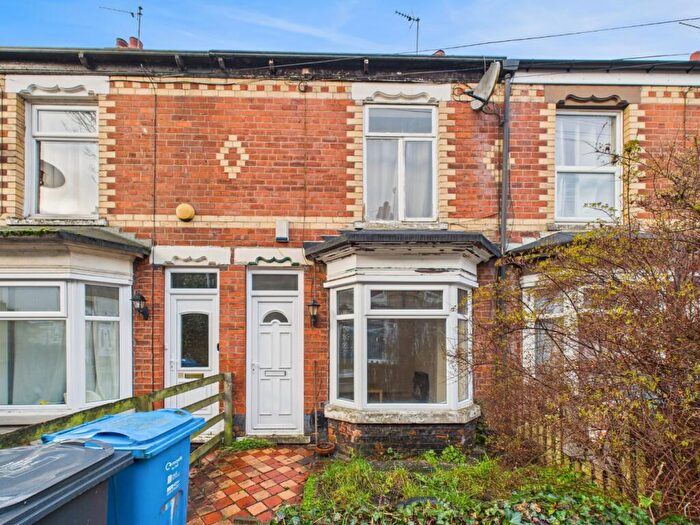
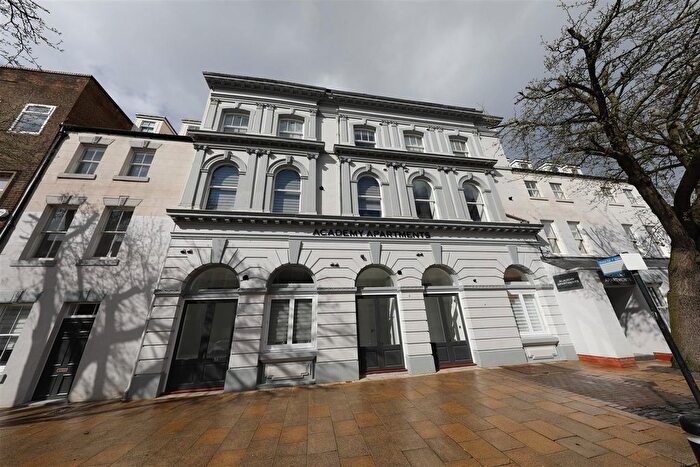
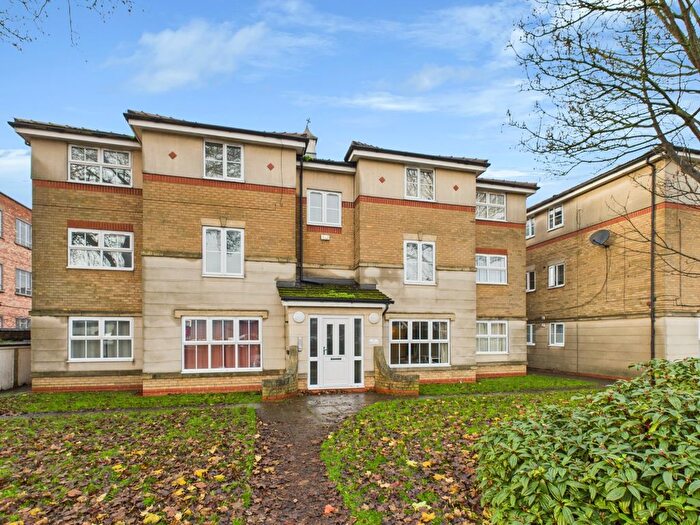
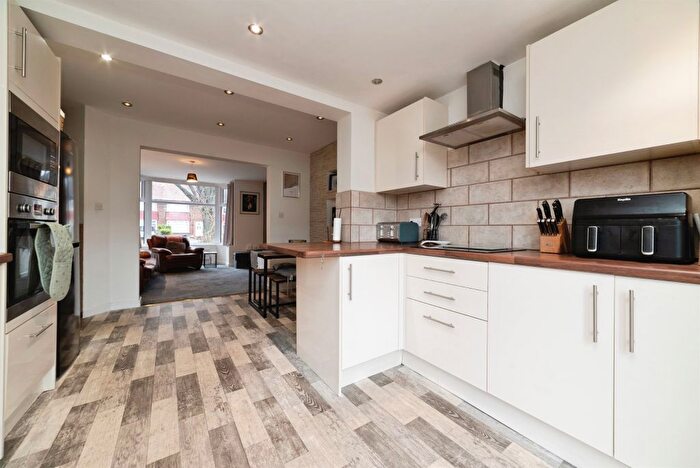
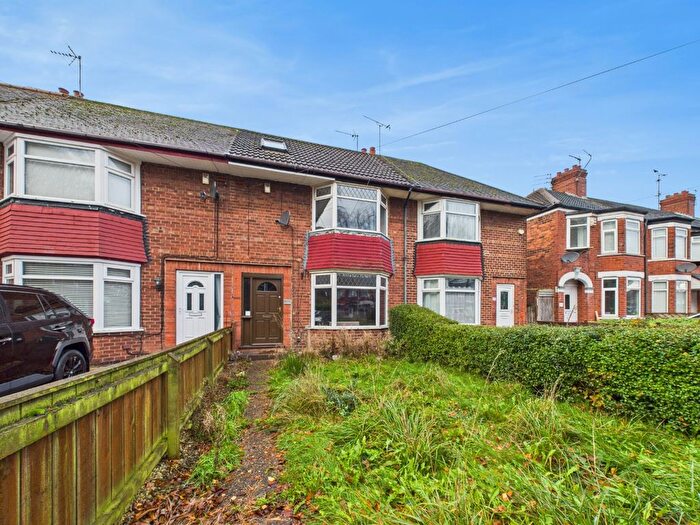
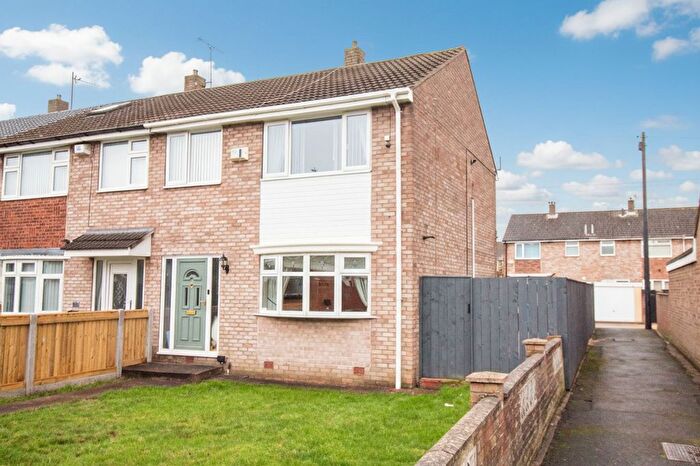
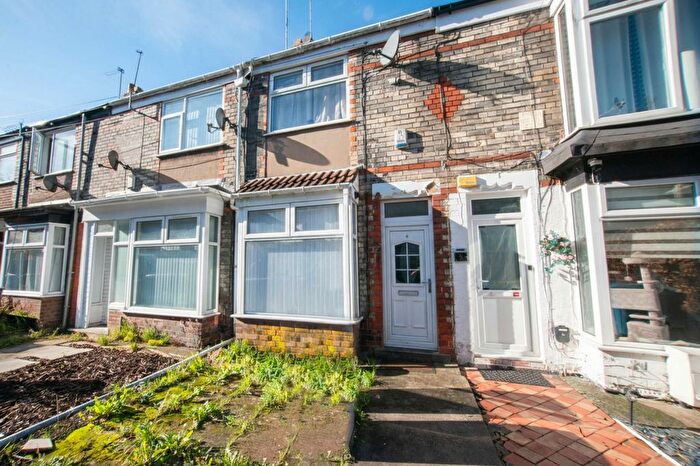
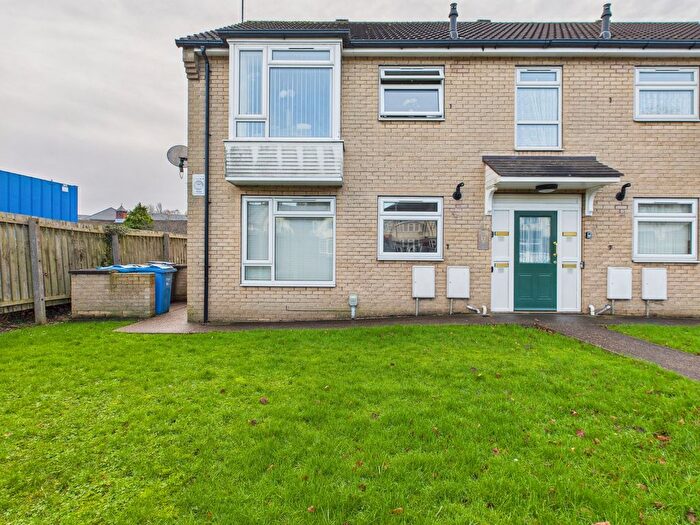
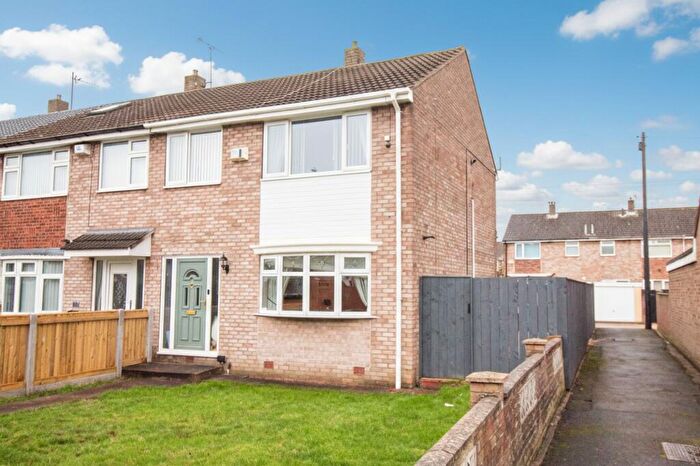
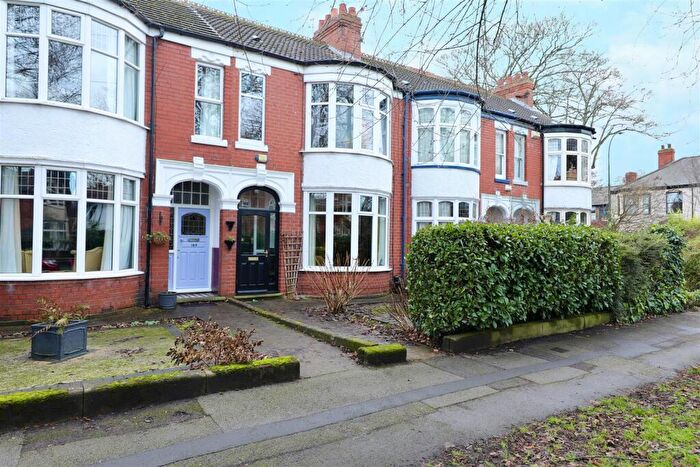
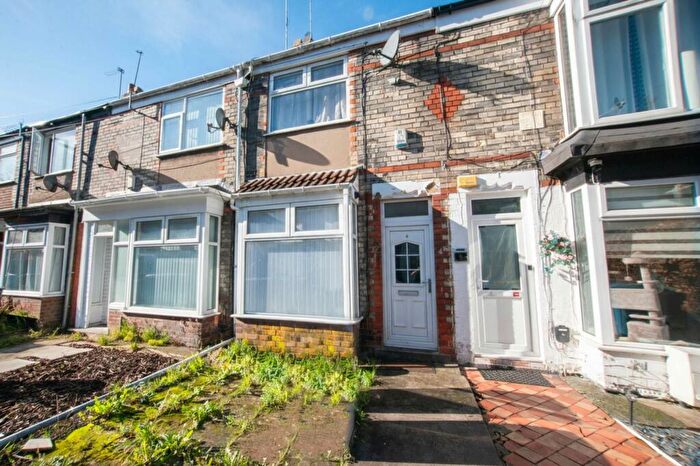
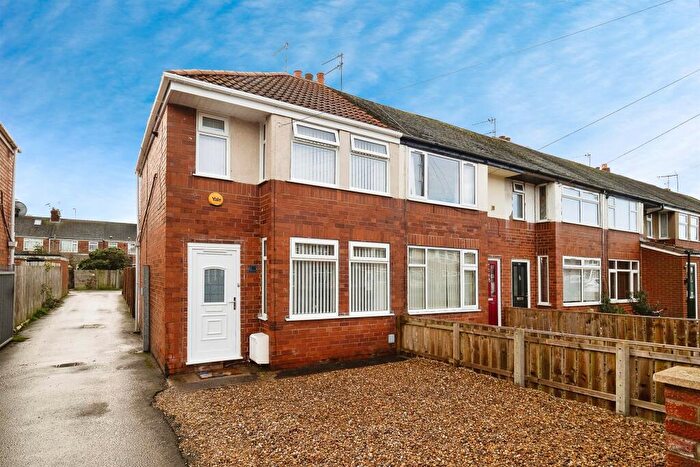
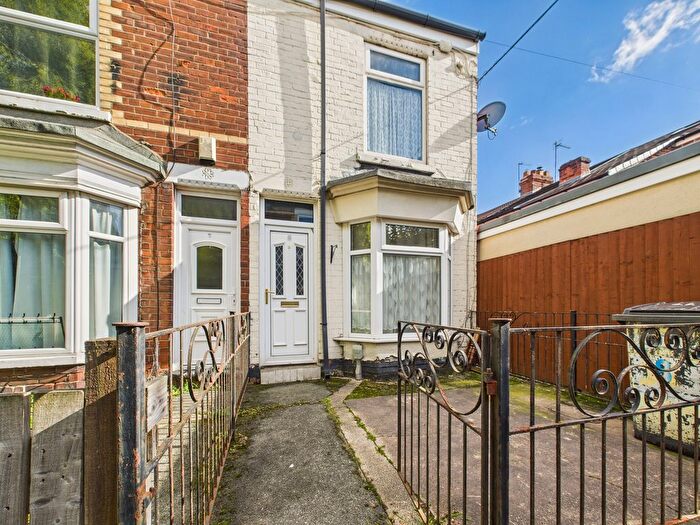
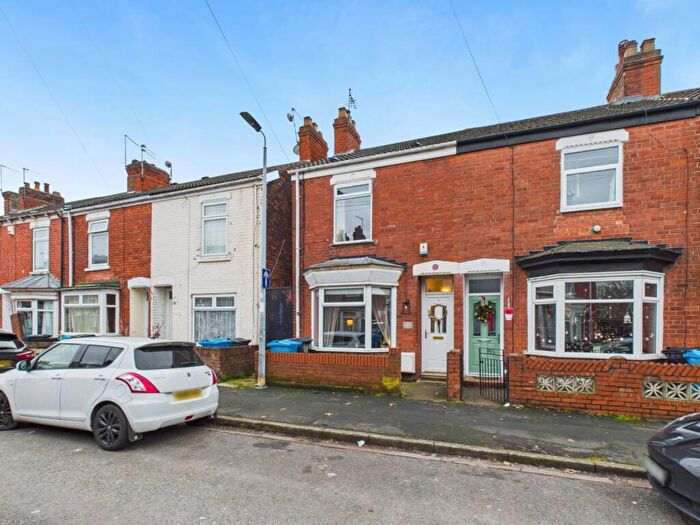
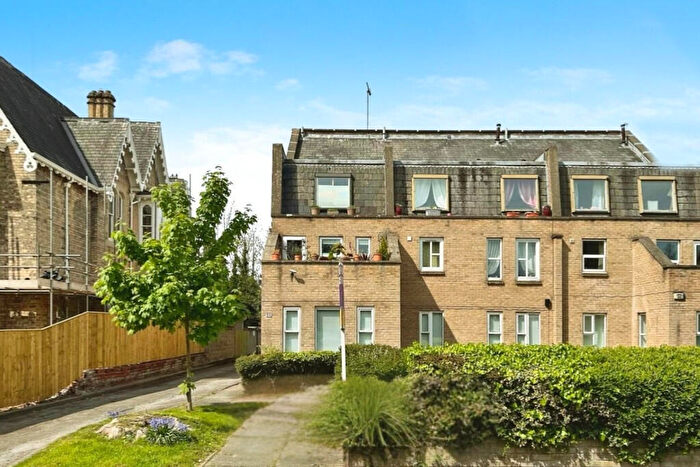
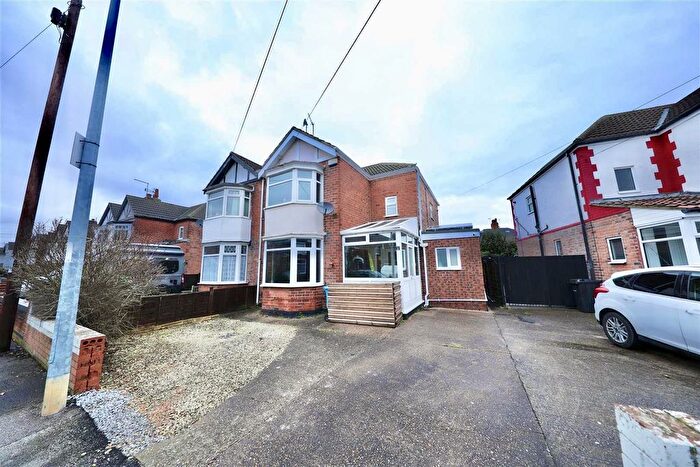
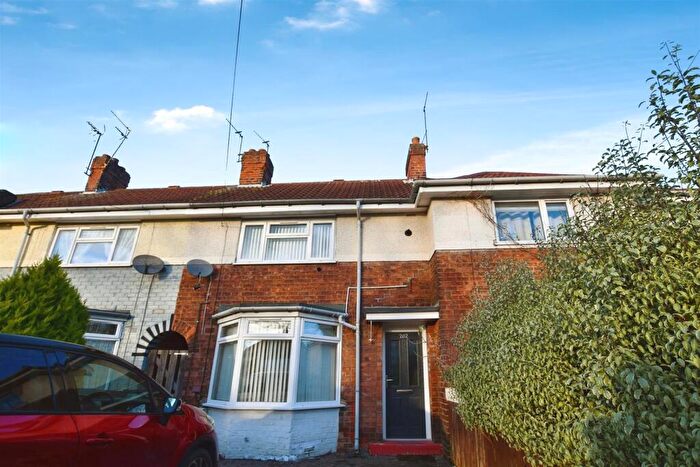
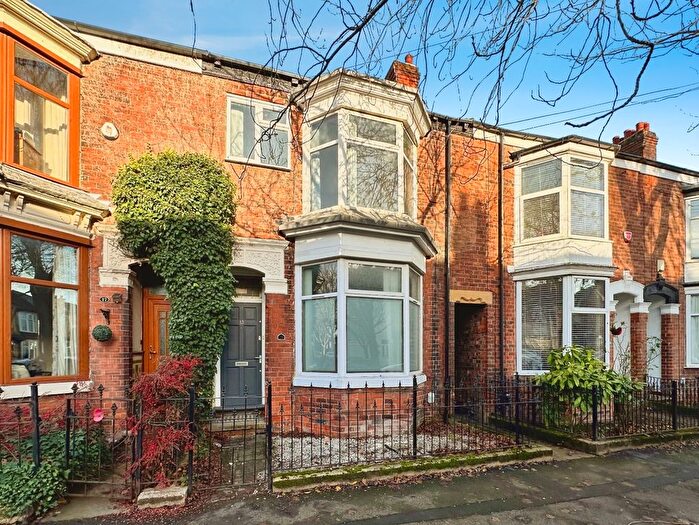
Houses for sale & to rent in Beverley & Newland, Hull
House Prices in Beverley & Newland
Properties in Beverley & Newland have an average house price of £164,454.00 and had 11 Property Transactions within the last 3 years¹.
Beverley & Newland is an area in Hull, City of Kingston upon Hull with 142 households², where the most expensive property was sold for £275,000.00.
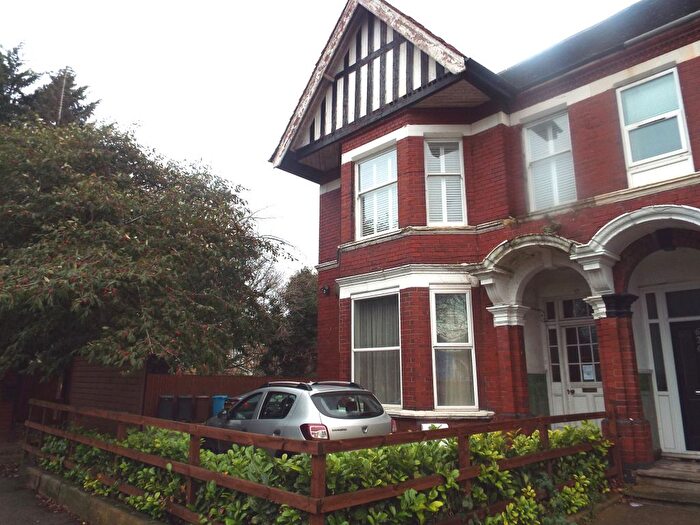
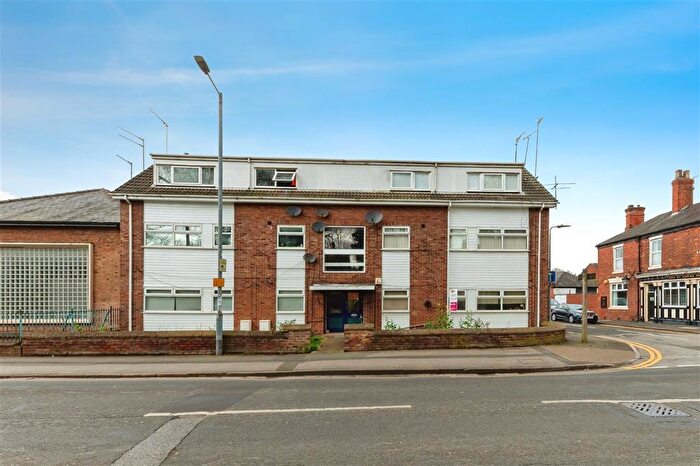
Properties for sale in Beverley & Newland
Roads and Postcodes in Beverley & Newland
Navigate through our locations to find the location of your next house in Beverley & Newland, Hull for sale or to rent.
| Streets | Postcodes |
|---|---|
| Bakers Yard | HU5 2DD |
| Bankside | HU5 1AP |
| Beverley Road | HU5 1LA HU5 1LD HU5 1NF HU5 1NN HU5 1NP HU6 7AA HU6 7AB HU6 7AE HU6 7DA |
| Bronte Court | HU6 7EG |
| Clough Road | HU5 1SB HU5 1SN HU5 1SP HU5 1SR HU5 1SW HU6 7PE HU6 7PL HU6 7PT HU6 7PY HU6 7QN |
| Compass Road | HU6 7BG |
| Florence Court | HU5 2SL |
| Innovation Drive | HU5 1SG |
| Keelson Court | HU5 2AH |
| Mayfair Court | HU5 2SD |
| Newland Avenue | HU5 3AA |
| Newland Grove | HU5 2NG |
| Oak Road | HU6 7NG HU6 7PH |
| Pearson Way | HU6 7QA |
| Pioneer Park | HU6 7HW |
| Reservoir Road | HU6 7QH |
| Reynoldson Street | HU5 3FB |
| Sidmouth Street | HU5 2JY |
| Sissons Way | HU5 1AL |
| St Augustines Court | HU5 2NY |
| St Wilfreds Terrace | HU5 2AQ |
| Vulcan Street | HU6 7PS |
| Wheelhouse Court | HU6 7BF |
Transport near Beverley & Newland
- FAQ
- Price Paid By Year
- Property Type Price
Frequently asked questions about Beverley & Newland
What is the average price for a property for sale in Beverley & Newland?
The average price for a property for sale in Beverley & Newland is £164,454. This amount is 23% higher than the average price in Hull. There are 4,849 property listings for sale in Beverley & Newland.
What streets have the most expensive properties for sale in Beverley & Newland?
The streets with the most expensive properties for sale in Beverley & Newland are Mayfair Court at an average of £275,000 and Beverley Road at an average of £206,666.
What streets have the most affordable properties for sale in Beverley & Newland?
The streets with the most affordable properties for sale in Beverley & Newland are Reynoldson Street at an average of £129,000 and Newland Avenue at an average of £140,000.
Which train stations are available in or near Beverley & Newland?
Some of the train stations available in or near Beverley & Newland are Hull, Cottingham and New Holland.
Property Price Paid in Beverley & Newland by Year
The average sold property price by year was:
| Year | Average Sold Price | Price Change |
Sold Properties
|
|---|---|---|---|
| 2025 | £170,000 | 4% |
1 Property |
| 2024 | £163,200 | -1% |
5 Properties |
| 2022 | £164,600 | 10% |
5 Properties |
| 2021 | £147,350 | 12% |
5 Properties |
| 2020 | £130,000 | -4% |
1 Property |
| 2019 | £135,416 | 2% |
6 Properties |
| 2018 | £132,598 | -30% |
20 Properties |
| 2017 | £172,825 | 5% |
6 Properties |
| 2005 | £165,000 | 45% |
1 Property |
| 2003 | £90,000 | -70% |
1 Property |
| 2001 | £153,000 | 62% |
1 Property |
| 2000 | £58,000 | -12% |
1 Property |
| 1998 | £65,000 | -31% |
1 Property |
| 1995 | £85,000 | - |
1 Property |
Property Price per Property Type in Beverley & Newland
Here you can find historic sold price data in order to help with your property search.
The average Property Paid Price for specific property types in the last three years are:
| Property Type | Average Sold Price | Sold Properties |
|---|---|---|
| Terraced House | £155,000.00 | 2 Terraced Houses |
| Flat | £166,555.00 | 9 Flats |

