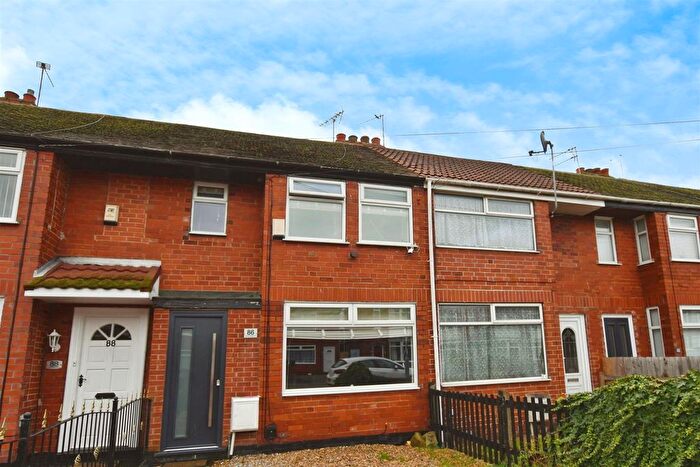
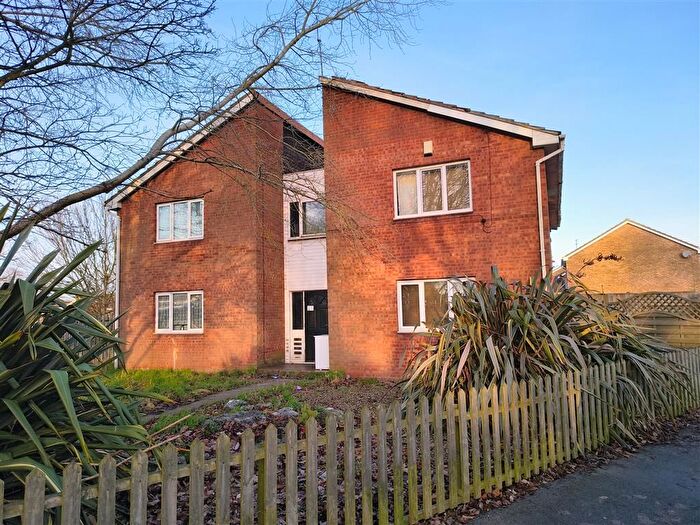
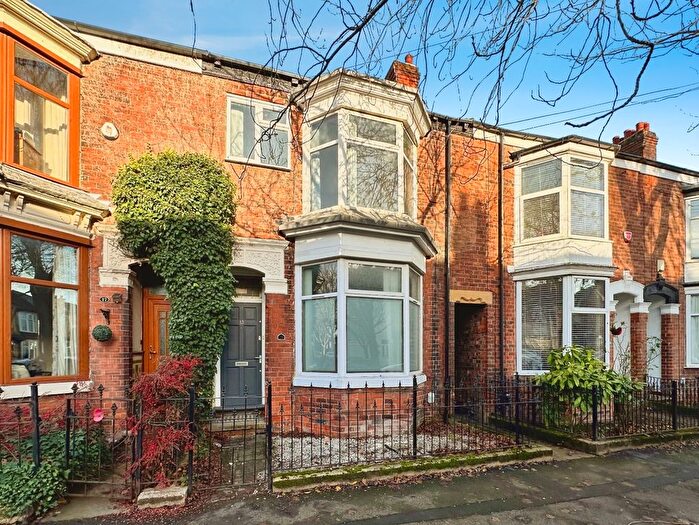
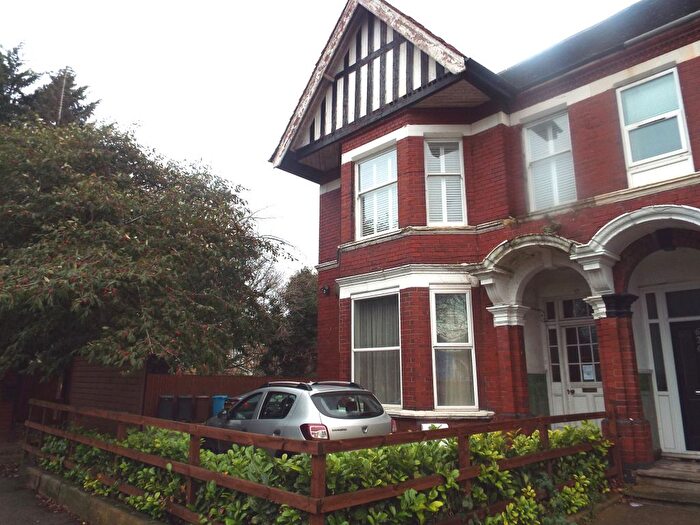
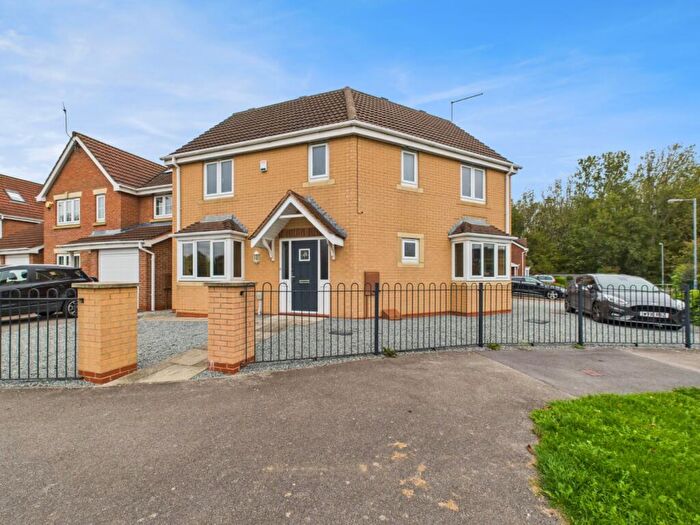
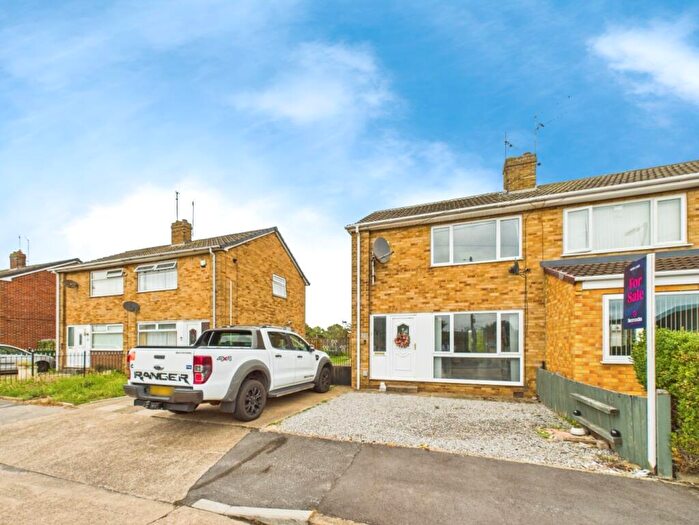
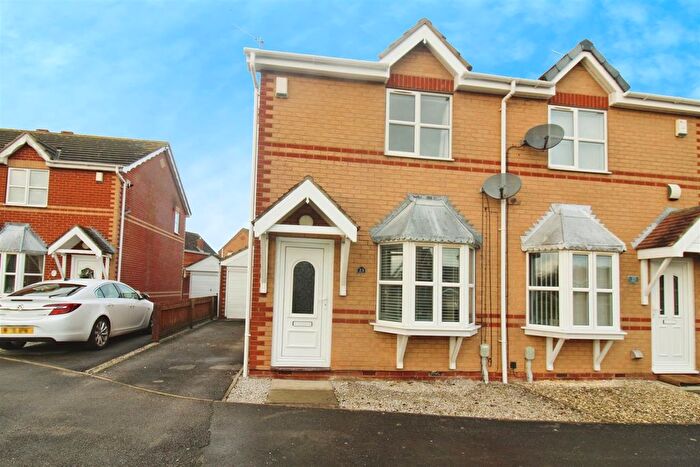
Houses for sale & to rent in Beverley, Hull
House Prices in Beverley
Properties in Beverley have an average house price of £150,613.00 and had 512 Property Transactions within the last 3 years¹.
Beverley is an area in Hull, City of Kingston upon Hull with 3,677 households², where the most expensive property was sold for £655,000.00.
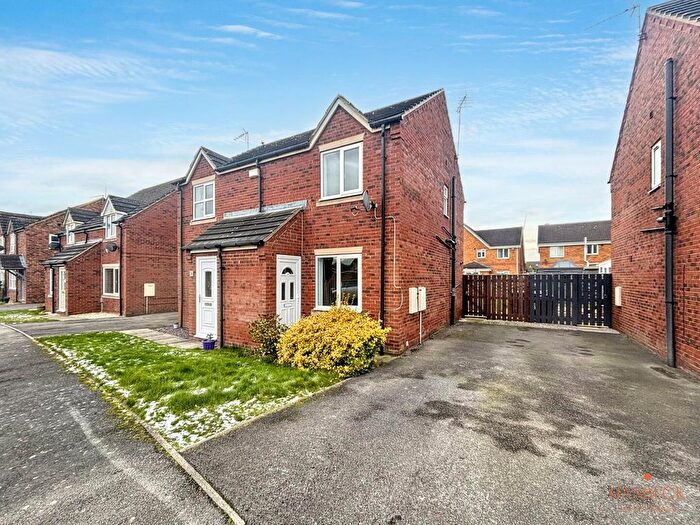
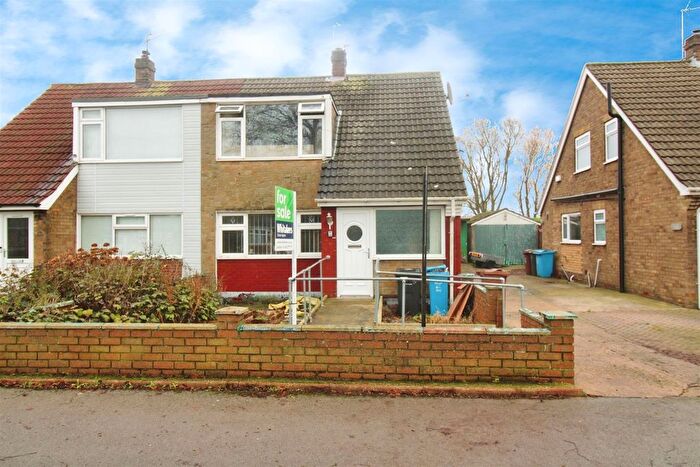
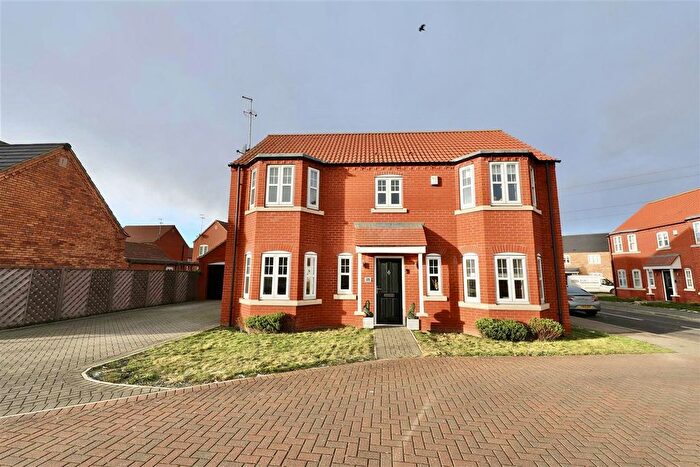
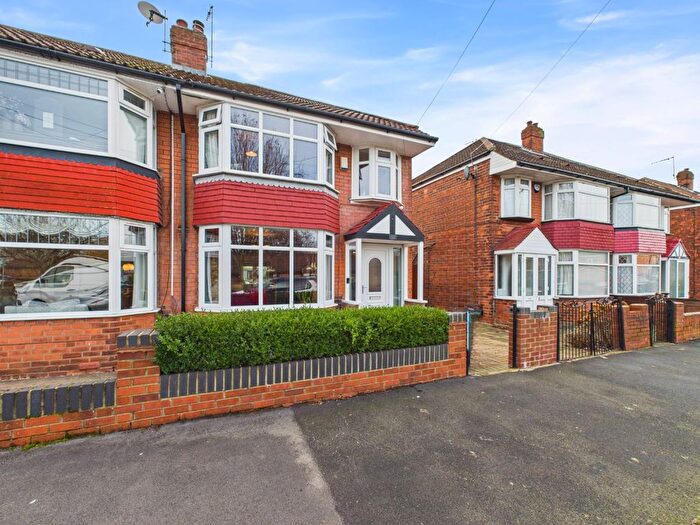
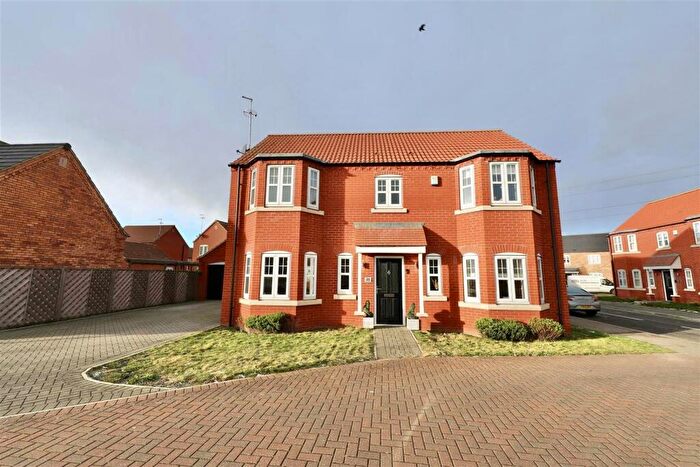
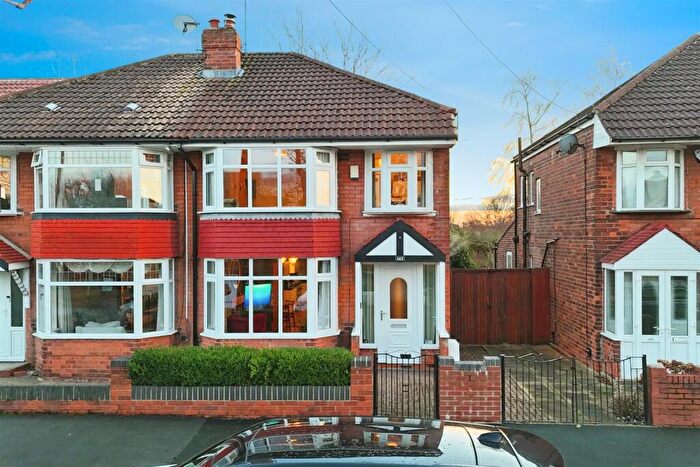
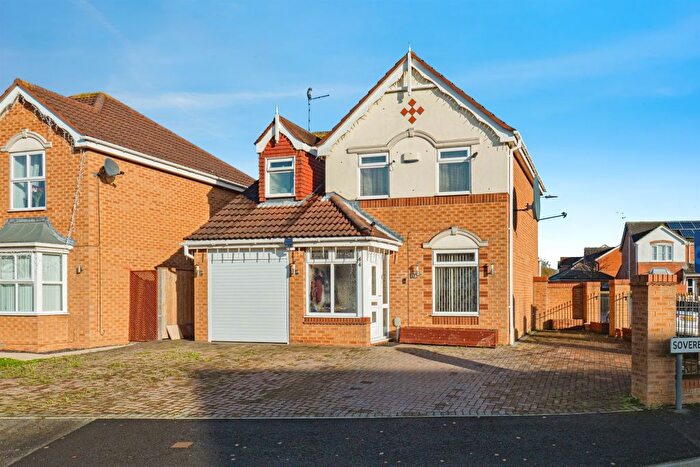
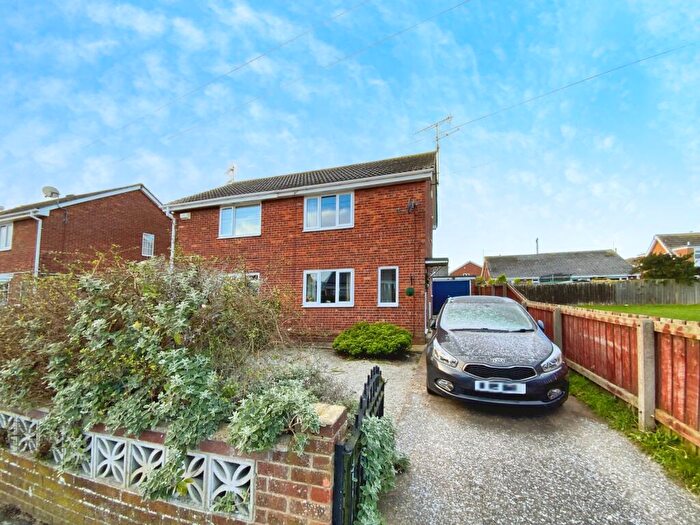
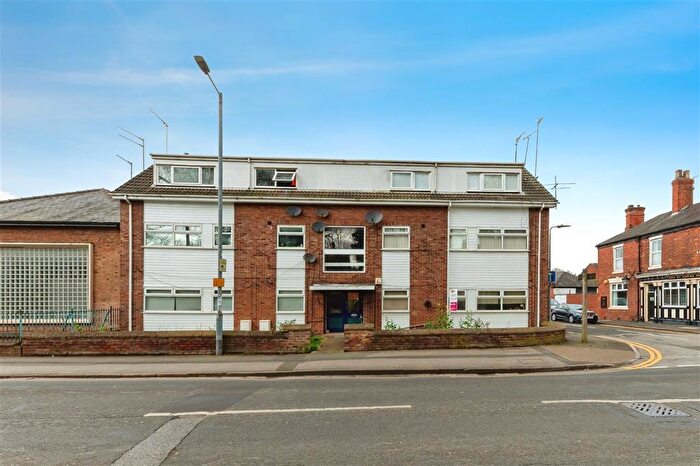
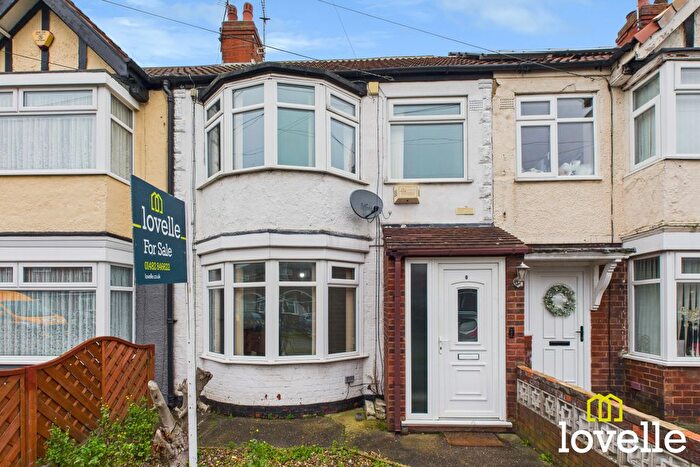
Properties for sale in Beverley
Roads and Postcodes in Beverley
Navigate through our locations to find the location of your next house in Beverley, Hull for sale or to rent.
| Streets | Postcodes |
|---|---|
| Alloa Close | HU6 7XA |
| Anchor Road | HU6 7AP |
| Argent Close | HU6 9UA |
| Ballathie Close | HU6 7XB |
| Baroness Close | HU6 9UB |
| Beechcliffe Avenue | HU6 7EF |
| Beresford Avenue | HU6 7LR HU6 7LS |
| Beverley Road | HU6 7DG HU6 7DQ HU6 7EX HU6 7EY HU6 7HD HU6 7HH HU6 7HP HU6 7JG HU6 7JH HU6 7LG HU6 7LH HU6 7LL HU6 7YA |
| Birnam Court | HU6 7WA |
| Boulsworth Avenue | HU6 7DZ |
| Capstan Road | HU6 7AS HU6 7AT |
| Claremont Avenue | HU6 7LZ HU6 7ND HU6 7NE |
| Clough Road | HU6 7PA |
| Cloverbank View | HU6 7YB |
| Compass Road | HU6 7AH HU6 7AU HU6 7AW HU6 7BB HU6 7BE HU6 7BQ |
| Coronet Close | HU6 9UD |
| Countess Close | HU6 9UE |
| Crinan Drive | HU6 7XD |
| Cullingworth Avenue | HU6 7DD |
| Denholme Avenue | HU6 7AY |
| Desmond Avenue | HU6 7JX HU6 7JY HU6 7JZ |
| Downfield Avenue | HU6 7XE HU6 7XF |
| Dunkeld Drive | HU6 7XG |
| Elston Close | HU6 7DU |
| Emmott Road | HU6 7AX |
| Esmond Street | HU6 7JW |
| Etherington Drive | HU6 7JT HU6 7JU |
| Etherington Road | HU6 7JP HU6 7JR HU6 7JS |
| Evergreen Drive | HU6 7YD |
| Fieldside Garth | HU6 7YE |
| Flag Walk | HU6 7BH |
| Forbes Avenue | HU6 7AJ |
| Greenfield Garth | HU6 7YF |
| Greylees Avenue | HU6 7YG |
| Gullane Drive | HU6 7XQ |
| Hall Road | HU6 9UG |
| Heathcote Street | HU6 7LP |
| Hedgerow Court | HU6 7YH |
| Keel Road | HU6 7BL HU6 7BP |
| Kenmore Drive | HU6 7XH |
| Knowles Avenue | HU6 7BT |
| Larard Avenue | HU6 7BD |
| Marsden Landing | HU6 7EH |
| Meadow Garth | HU6 7YJ |
| Mizzen Road | HU6 7AG |
| Nairn Close | HU6 7XJ |
| Norrison Avenue | HU6 7BS |
| Oak Road | HU6 7PG |
| Ormonde Avenue | HU6 7LT HU6 7LX HU6 7LY |
| Osprey Close | HU6 7XL |
| Oxenhope Road | HU6 7BZ |
| Parkstone Road | HU6 7DB HU6 7DE |
| Port Avenue | HU6 7AR |
| Reservoir Road | HU6 7QD |
| Riversdale Road | HU6 7EZ HU6 7HA HU6 7HB |
| Robson Avenue | HU6 7AN |
| Rosemount Close | HU6 7XN |
| Sextant Road | HU6 7BA |
| Silsden Avenue | HU6 7BY |
| Silverdale Road | HU6 7HE HU6 7HF HU6 7HG HU6 7HQ |
| St Johns Court | HU6 7PB |
| Stanbury Road | HU6 7BU HU6 7BW HU6 7BX |
| Starboard Avenue | HU6 7BJ |
| Steeton Avenue | HU6 7AZ |
| Strathmore Avenue | HU6 7HJ HU6 7HL HU6 7HN |
| Sutton Road | HU6 7DP HU6 7DR HU6 7DS HU6 7DT |
| Tarran Avenue | HU6 7AL |
| The Queensway | HU6 9BH HU6 9BJ HU6 9BL |
| Train Avenue | HU6 7BN |
| Tudor Drive | HU6 9UF |
| Wadsworth Avenue | HU6 7DY |
| Waterworks Cottages | HU6 7QB |
| Wellesley Avenue | HU6 7LN HU6 7LW |
| Welwyn Park Avenue | HU6 7DH HU6 7DJ HU6 7DL HU6 7DN HU6 7DW |
| Welwyn Park Drive | HU6 7DX |
| Welwyn Park Road | HU6 7EA HU6 7EB HU6 7ED |
| Windle Avenue | HU6 7EE |
Transport near Beverley
- FAQ
- Price Paid By Year
- Property Type Price
Frequently asked questions about Beverley
What is the average price for a property for sale in Beverley?
The average price for a property for sale in Beverley is £150,613. This amount is 12% higher than the average price in Hull. There are 5,020 property listings for sale in Beverley.
What streets have the most expensive properties for sale in Beverley?
The streets with the most expensive properties for sale in Beverley are Desmond Avenue at an average of £221,500, Oxenhope Road at an average of £215,863 and Riversdale Road at an average of £212,555.
What streets have the most affordable properties for sale in Beverley?
The streets with the most affordable properties for sale in Beverley are Greenfield Garth at an average of £43,875, Clough Road at an average of £59,500 and Hedgerow Court at an average of £59,750.
Which train stations are available in or near Beverley?
Some of the train stations available in or near Beverley are Cottingham, Hull and Beverley.
Property Price Paid in Beverley by Year
The average sold property price by year was:
| Year | Average Sold Price | Price Change |
Sold Properties
|
|---|---|---|---|
| 2025 | £152,442 | 1% |
88 Properties |
| 2024 | £151,644 | 3% |
128 Properties |
| 2023 | £146,927 | -3% |
109 Properties |
| 2022 | £151,196 | 11% |
187 Properties |
| 2021 | £133,811 | 6% |
167 Properties |
| 2020 | £126,055 | -5% |
114 Properties |
| 2019 | £131,911 | 5% |
173 Properties |
| 2018 | £125,858 | 10% |
163 Properties |
| 2017 | £113,821 | -0,1% |
167 Properties |
| 2016 | £113,933 | 5% |
156 Properties |
| 2015 | £107,683 | 1% |
148 Properties |
| 2014 | £107,052 | 2% |
135 Properties |
| 2013 | £105,310 | 8% |
97 Properties |
| 2012 | £96,682 | -2% |
100 Properties |
| 2011 | £98,810 | -10% |
94 Properties |
| 2010 | £108,336 | 3% |
91 Properties |
| 2009 | £104,651 | -10% |
87 Properties |
| 2008 | £115,224 | -4% |
107 Properties |
| 2007 | £119,345 | 6% |
229 Properties |
| 2006 | £112,214 | 14% |
240 Properties |
| 2005 | £96,883 | 10% |
164 Properties |
| 2004 | £87,027 | 21% |
191 Properties |
| 2003 | £68,894 | 25% |
259 Properties |
| 2002 | £51,655 | 14% |
236 Properties |
| 2001 | £44,404 | 8% |
213 Properties |
| 2000 | £40,871 | -3% |
213 Properties |
| 1999 | £42,111 | -2% |
183 Properties |
| 1998 | £42,753 | 6% |
157 Properties |
| 1997 | £40,285 | -1% |
179 Properties |
| 1996 | £40,536 | -3% |
188 Properties |
| 1995 | £41,895 | - |
139 Properties |
Property Price per Property Type in Beverley
Here you can find historic sold price data in order to help with your property search.
The average Property Paid Price for specific property types in the last three years are:
| Property Type | Average Sold Price | Sold Properties |
|---|---|---|
| Semi Detached House | £167,499.00 | 215 Semi Detached Houses |
| Detached House | £213,142.00 | 28 Detached Houses |
| Terraced House | £139,234.00 | 240 Terraced Houses |
| Flat | £59,236.00 | 29 Flats |

