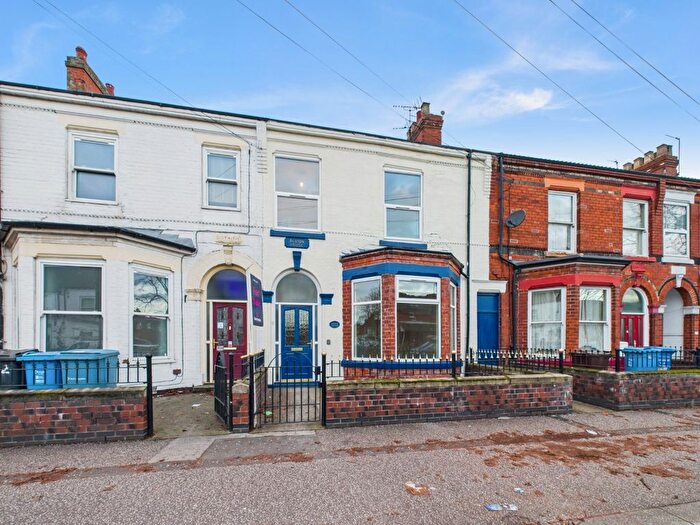
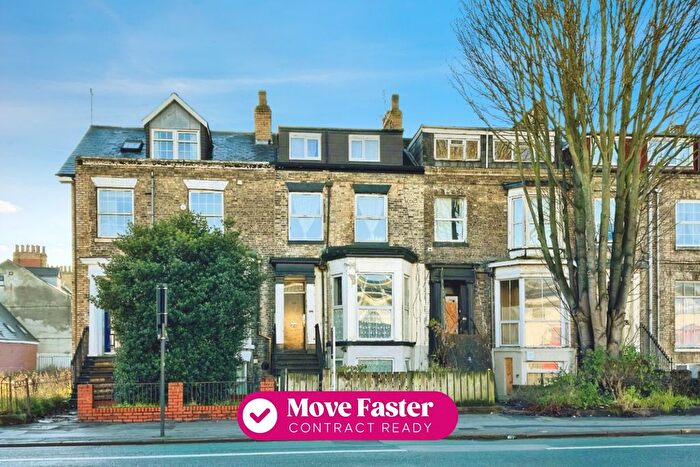
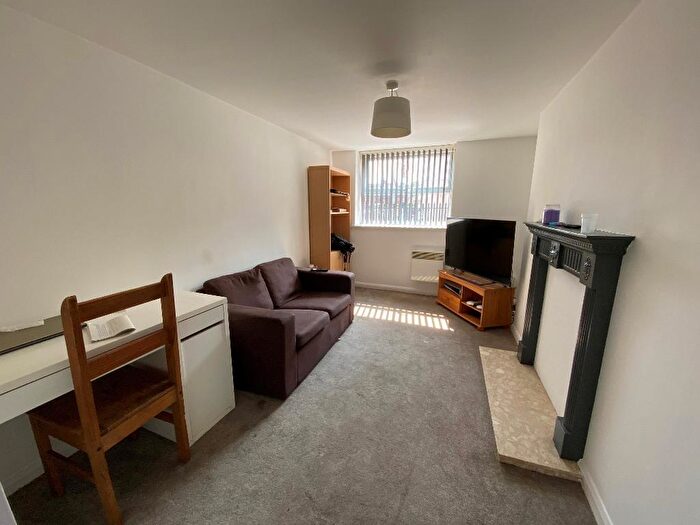
Houses for sale & to rent in St Andrews, Hull
House Prices in St Andrews
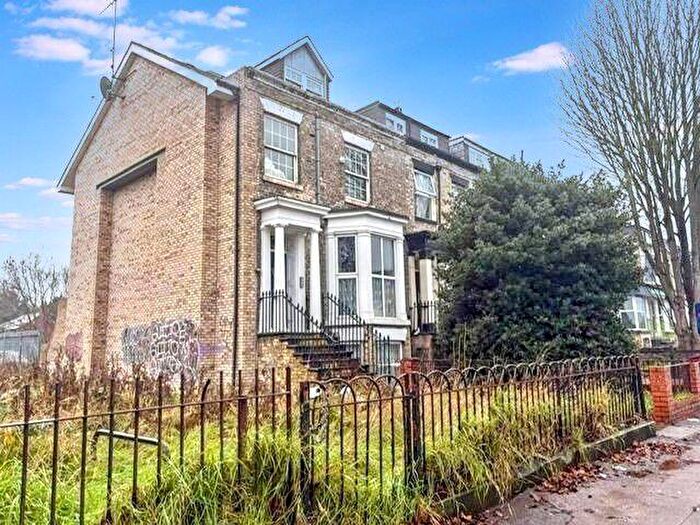
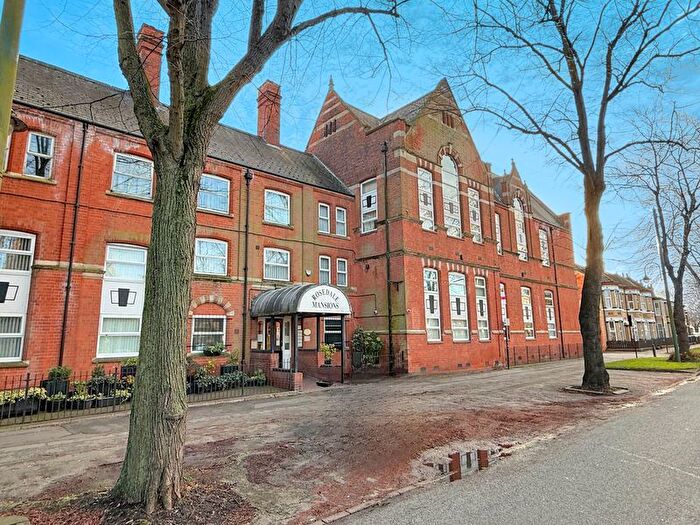
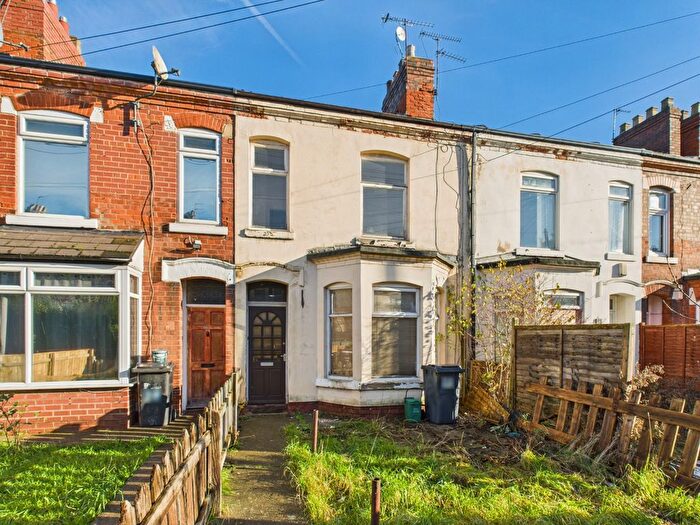
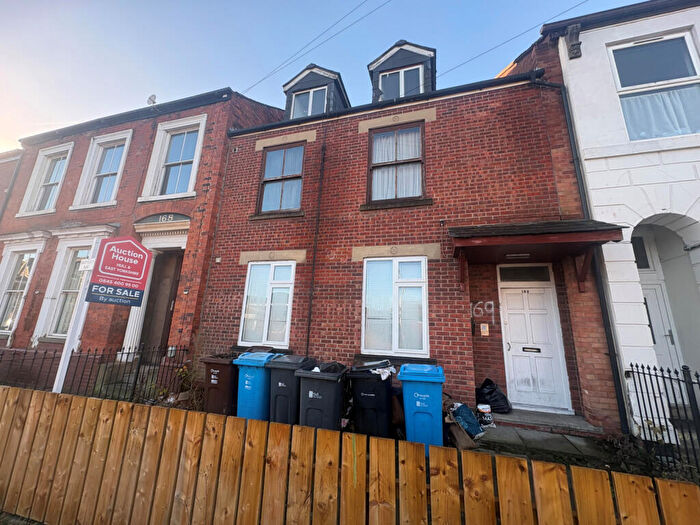
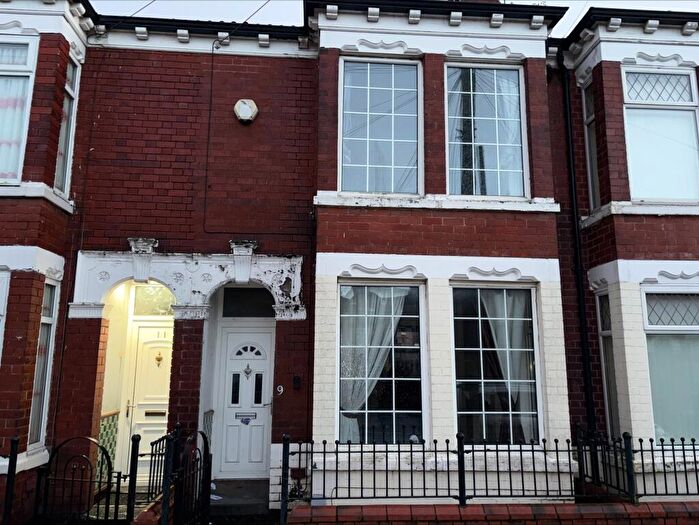
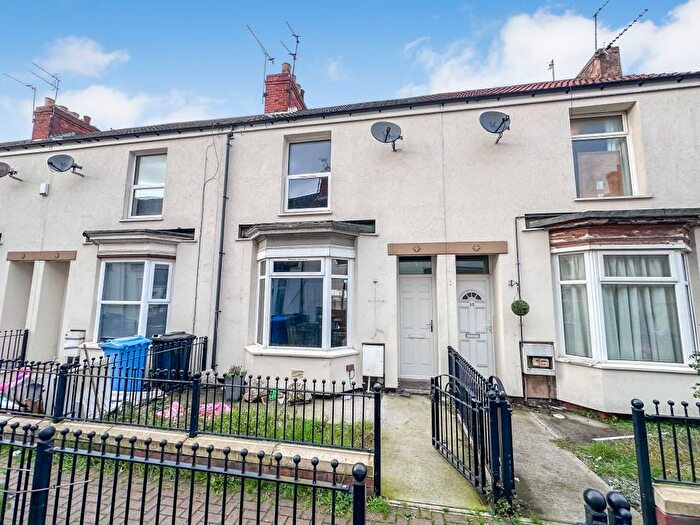
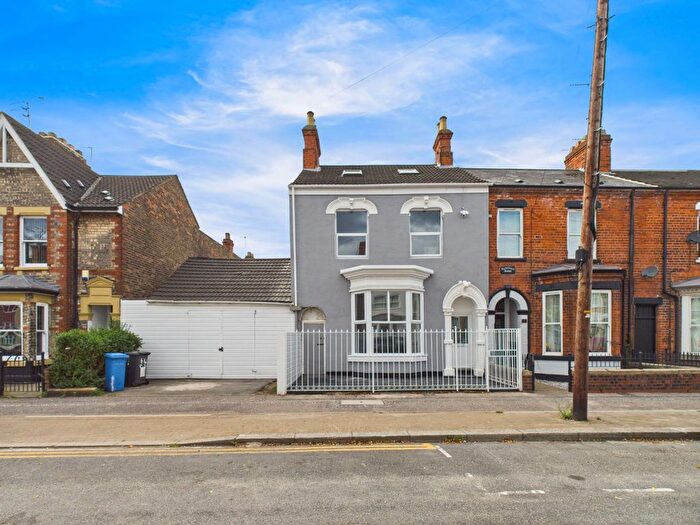
Properties in St Andrews have an average house price of £83,901.00 and had 412 Property Transactions within the last 3 years¹.
St Andrews is an area in Hull, City of Kingston upon Hull with 3,421 households², where the most expensive property was sold for £850,000.00.
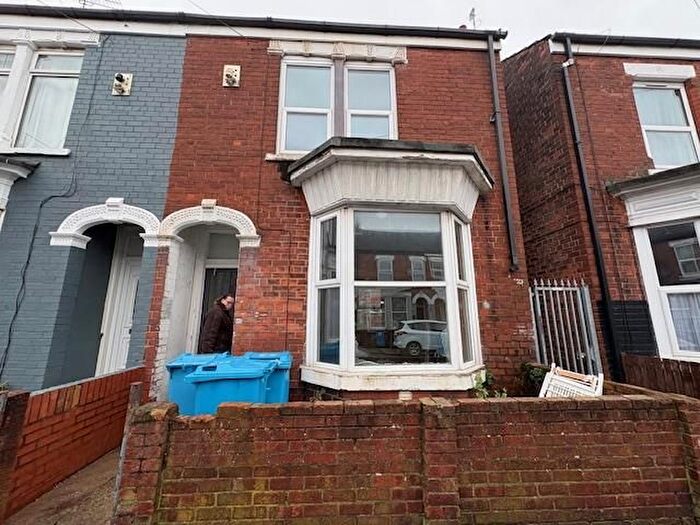
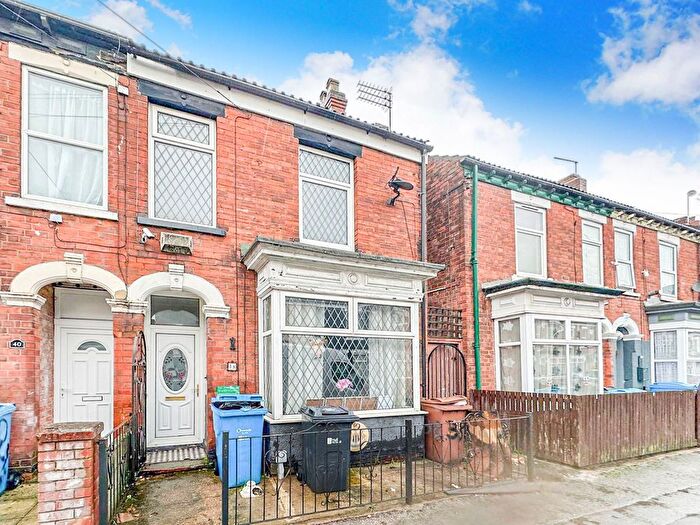
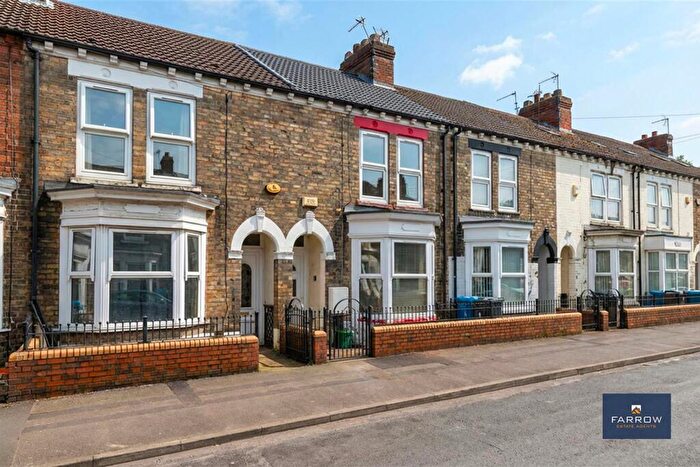
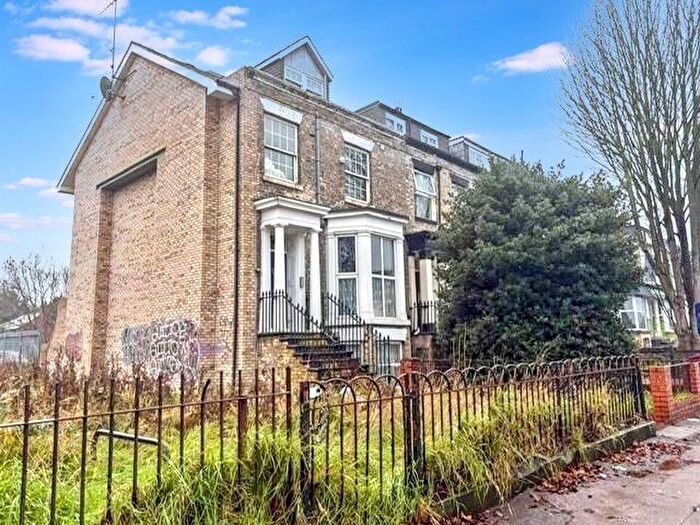
Properties for sale in St Andrews
Roads and Postcodes in St Andrews
Navigate through our locations to find the location of your next house in St Andrews, Hull for sale or to rent.
| Streets | Postcodes |
|---|---|
| Adas Avenue | HU3 2TH |
| Aigburth Avenue | HU3 3QA |
| Airlie Street | HU3 3JD |
| Albemarle Street | HU3 3JN |
| Albert Avenue | HU3 3AP HU3 3EG |
| Albion Grove | HU3 3HY |
| Alfonso Street | HU3 2TN |
| Anlaby Road | HU3 2SA HU3 2SB HU3 2SE |
| Athletic Grove | HU3 3HW |
| Avenue Crescent | HU3 3JW |
| Aylesford Street | HU3 3JJ |
| Bacheler Street | HU3 2TY HU3 2TZ |
| Bean Street | HU3 2PU |
| Beech Close | HU3 2SW |
| Beech Grove | HU3 3AW |
| Borella Grove | HU3 5AB |
| Boulevard | HU3 2TA HU3 2TE HU3 2TS HU3 2UD HU3 2UE HU3 3ED HU3 3EJ HU3 3EL HU3 3EQ |
| Boynton Street | HU3 3BZ |
| Brucella Grove | HU3 5DQ |
| Cadogan Avenue | HU3 3HR |
| Cadogan Grove | HU3 3HS |
| Cadogan Street | HU3 3HP |
| Calthorpe Street | HU3 3HU |
| Camden Street | HU3 3JB |
| Canopias Close | HU3 3LB |
| Carlisle Avenue | HU3 3JU |
| Carrington Street | HU3 3HX |
| Catherine Grove | HU3 3HZ |
| Chester Grove | HU3 3JP |
| Cholmley Street | HU3 3DL HU3 3DN HU3 3DP HU3 3DW |
| Clairbrook Close | HU3 3QQ |
| Clifton Gardens | HU3 3QB |
| Colenso Street | HU3 3PY |
| Coltman Street | HU3 2SF HU3 2SG HU3 2SJ HU3 2SQ |
| Constable Street | HU3 3BL HU3 3DF |
| Conway Close | HU3 3NR |
| Cordella Close | HU3 3QP |
| Cornwall Gardens | HU3 3AU |
| Corsair Grove | HU3 5AU |
| Cuthbert Avenue | HU3 3JG |
| Dairycoates Avenue | HU3 5DB HU3 5DH |
| Dee Street | HU3 3SN |
| Derwent Avenue | HU3 2TW |
| Devonshire Villas | HU3 3BA |
| Division Road | HU3 3NT |
| Doncaster Street | HU3 3PE |
| Dorado Close | HU3 3QR |
| Doris Vale | HU3 3JL |
| Eastbourne Street | HU3 5EF |
| Edinburgh Street | HU3 5AN HU3 5AP HU3 5AR |
| Emerald Grove | HU3 5AE |
| Ena Street | HU3 2TG |
| Enas Crescent | HU3 2TL |
| Euston Close | HU3 2PX |
| Florence Avenue | HU3 3HT |
| Frances Avenue | HU3 3BD |
| Garnet Grove | HU3 5AG |
| Gee Street | HU3 2SL |
| Glasgow Street | HU3 3PR HU3 3PS HU3 3QU |
| Gordon Street | HU3 3HJ HU3 3HN |
| Graham Avenue | HU3 3JQ |
| Hailsham Street | HU3 5DE |
| Hawthorn Avenue | HU3 5JU HU3 5LL |
| Heathfield Square | HU3 5DS |
| Heron Street | HU3 3PF |
| Hessle Road | HU3 3AD HU3 3BE HU3 3DB HU3 3DU HU3 3EA HU3 3LD HU3 3SB HU3 3SD HU3 3SE HU3 4AA HU3 4BE HU3 4BJ HU3 4BL HU3 4BQ HU3 4EH HU3 4EJ HU3 4UD HU3 5BL HU3 5BQ |
| Hunter Grove | HU3 5AH |
| Irene Grove | HU3 3JA |
| Jade Grove | HU3 5AJ |
| Kings Bench Street | HU3 2TU HU3 2TX |
| Kings Cross Close | HU3 2PT |
| Leura Grove | HU3 3SH |
| Lois Crescent | HU3 3JS |
| Malm Street | HU3 2TF |
| Mareham Avenue | HU3 2TQ |
| Marmaduke Street | HU3 3BH |
| Massey Close | HU3 3QT |
| Mckinley Avenue | HU3 3JR |
| Montreal Avenue | HU3 3JT |
| Myrtle Avenue | HU3 3BB |
| Nepean Grove | HU3 3SJ |
| Newton Street | HU3 3EP |
| Princess Grove | HU3 2TJ |
| Queensgate Street | HU3 2TT |
| Raywood Villas | HU3 3AN |
| Redbourne Street | HU3 3ES HU3 3ET |
| Ribble Avenue | HU3 3SG |
| Ribble Street | HU3 3SF |
| Rise Walk | HU3 3DA |
| Riston Street | HU3 3BJ |
| Rosamond Street | HU3 3RA |
| Rose Avenue | HU3 3JH |
| Saltburn Street | HU3 5DY |
| Saner Street | HU3 2TR |
| Sapphire Grove | HU3 5AY |
| Sefton Street | HU3 3SA |
| Selby Street | HU3 3PB HU3 3PT |
| Somerset Street | HU3 3QG HU3 3QH |
| Springburn Street | HU3 5EX |
| St Georges Avenue | HU3 3QD |
| St Georges Road | HU3 3PU HU3 3PX HU3 3QE HU3 3TP |
| St Georges Terrace | HU3 3EZ |
| St Matthew Street | HU3 2UA HU3 2UB |
| Starella Grove | HU3 5DJ |
| Swanella Grove | HU3 5AF |
| Sydney Grove | HU3 3SL |
| The Gardens | HU3 2SY |
| The Mews | HU3 2SZ |
| Thirlmere Avenue | HU3 3AX |
| Thorn Leigh | HU3 2PN |
| Tranmere Close | HU3 3HF |
| Tyne Street | HU3 3SQ |
| Victoria Avenue | HU3 2TP HU3 3AR |
| Wellsted Street | HU3 3AF HU3 3AQ |
| Wesley Court | HU3 2SP |
| West Dock Avenue | HU3 4JR |
| Westbourne Street | HU3 5BS HU3 5BT |
| Westmeath Avenue | HU3 3JX |
| Woodcock Street | HU3 5AX HU3 5DR HU3 5DT HU3 5DW |
Transport near St Andrews
-
Hull Station
-
New Holland Station
-
Barrow Haven Station
-
Hessle Station
-
Cottingham Station
-
Goxhill Station
-
Barton-On-Humber Station
- FAQ
- Price Paid By Year
- Property Type Price
Frequently asked questions about St Andrews
What is the average price for a property for sale in St Andrews?
The average price for a property for sale in St Andrews is £83,901. This amount is 37% lower than the average price in Hull. There are 1,205 property listings for sale in St Andrews.
What streets have the most expensive properties for sale in St Andrews?
The streets with the most expensive properties for sale in St Andrews are Heathfield Square at an average of £177,500, Hailsham Street at an average of £170,000 and Hawthorn Avenue at an average of £156,666.
What streets have the most affordable properties for sale in St Andrews?
The streets with the most affordable properties for sale in St Andrews are Canopias Close at an average of £32,000, Beech Close at an average of £36,650 and Anlaby Road at an average of £45,852.
Which train stations are available in or near St Andrews?
Some of the train stations available in or near St Andrews are Hull, New Holland and Barrow Haven.
Property Price Paid in St Andrews by Year
The average sold property price by year was:
| Year | Average Sold Price | Price Change |
Sold Properties
|
|---|---|---|---|
| 2025 | £86,506 | 4% |
68 Properties |
| 2024 | £83,123 | 5% |
99 Properties |
| 2023 | £79,328 | -9% |
107 Properties |
| 2022 | £86,722 | 7% |
138 Properties |
| 2021 | £80,903 | -6% |
113 Properties |
| 2020 | £85,894 | 16% |
78 Properties |
| 2019 | £71,954 | -8% |
82 Properties |
| 2018 | £77,867 | 5% |
85 Properties |
| 2017 | £74,304 | 14% |
82 Properties |
| 2016 | £63,768 | 7% |
91 Properties |
| 2015 | £59,493 | 13% |
112 Properties |
| 2014 | £52,025 | -19% |
95 Properties |
| 2013 | £61,874 | 25% |
98 Properties |
| 2012 | £46,128 | -47% |
39 Properties |
| 2011 | £67,812 | -10% |
98 Properties |
| 2010 | £74,670 | 16% |
58 Properties |
| 2009 | £62,449 | -5% |
91 Properties |
| 2008 | £65,510 | 8% |
218 Properties |
| 2007 | £60,363 | 11% |
357 Properties |
| 2006 | £53,726 | 23% |
458 Properties |
| 2005 | £41,154 | 21% |
440 Properties |
| 2004 | £32,605 | 18% |
502 Properties |
| 2003 | £26,657 | 15% |
323 Properties |
| 2002 | £22,605 | 17% |
246 Properties |
| 2001 | £18,840 | -3% |
158 Properties |
| 2000 | £19,394 | -8% |
68 Properties |
| 1999 | £21,038 | 11% |
81 Properties |
| 1998 | £18,804 | -9% |
103 Properties |
| 1997 | £20,527 | -10% |
171 Properties |
| 1996 | £22,584 | -7% |
158 Properties |
| 1995 | £24,269 | - |
139 Properties |
Property Price per Property Type in St Andrews
Here you can find historic sold price data in order to help with your property search.
The average Property Paid Price for specific property types in the last three years are:
| Property Type | Average Sold Price | Sold Properties |
|---|---|---|
| Flat | £47,490.00 | 51 Flats |
| Semi Detached House | £117,268.00 | 27 Semi Detached Houses |
| Terraced House | £86,233.00 | 331 Terraced Houses |
| Detached House | £145,333.00 | 3 Detached Houses |

