
Houses for sale in Spennymoor, County Durham
House Prices in Spennymoor
Properties in Spennymoor have an average house price of £140k and had 1,107 Property Transactions within the last 3 years.¹
Spennymoor is an area in County Durham with 10,364 households², where the most expensive property was sold for £805k.
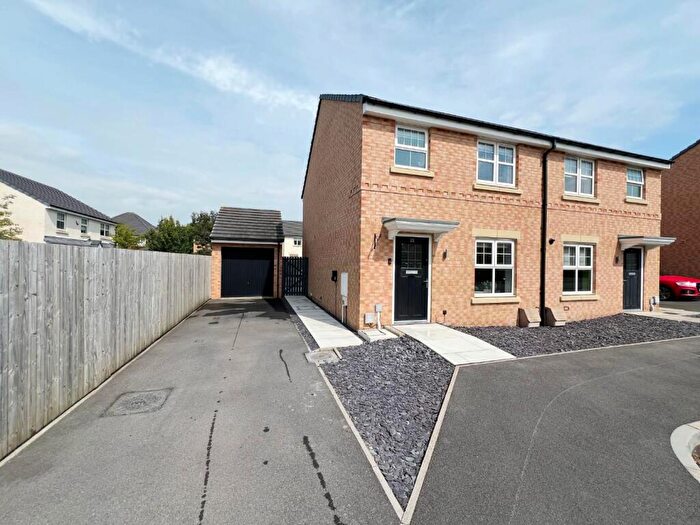
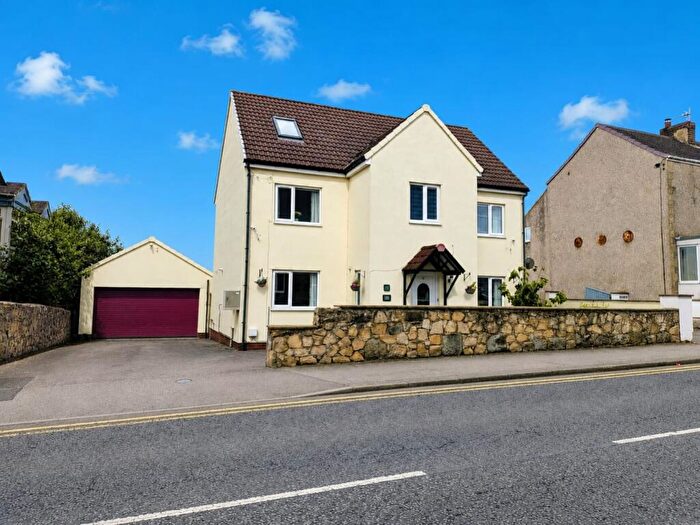
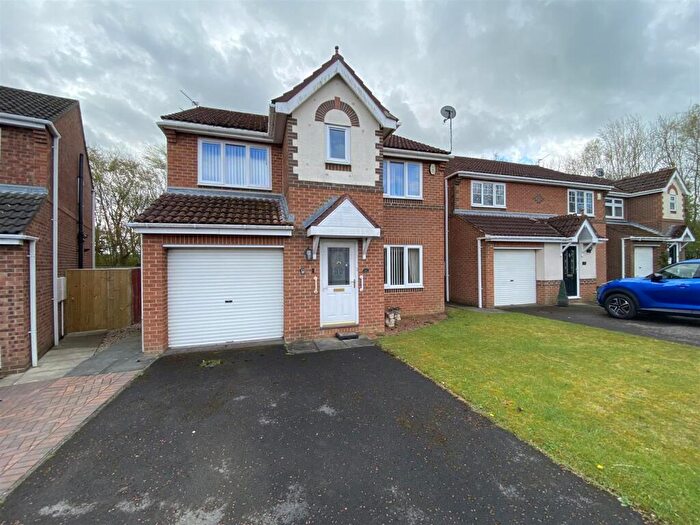
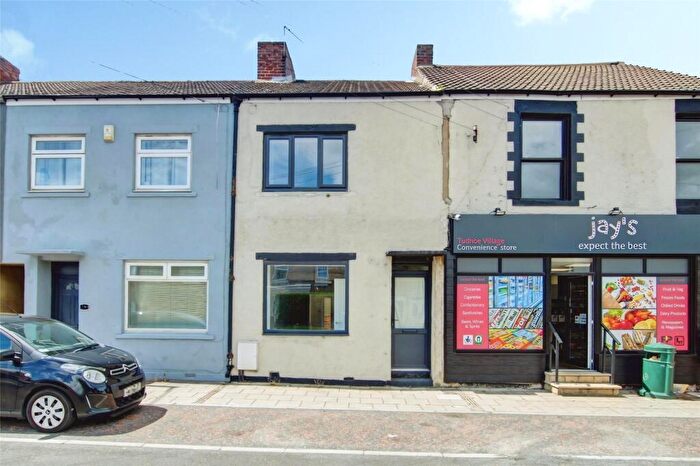
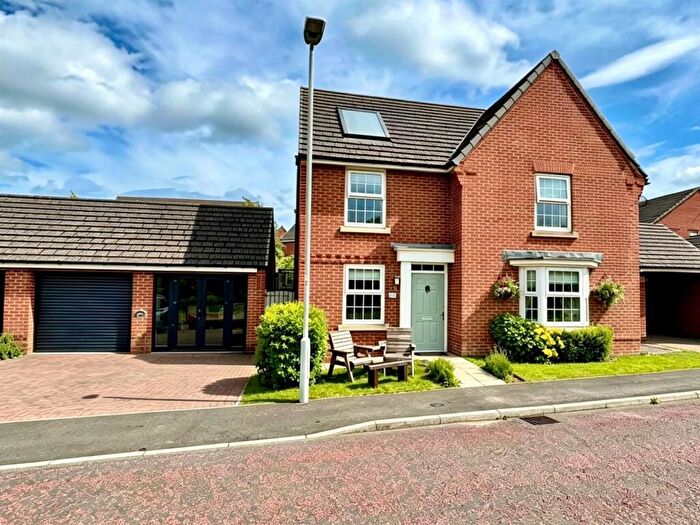
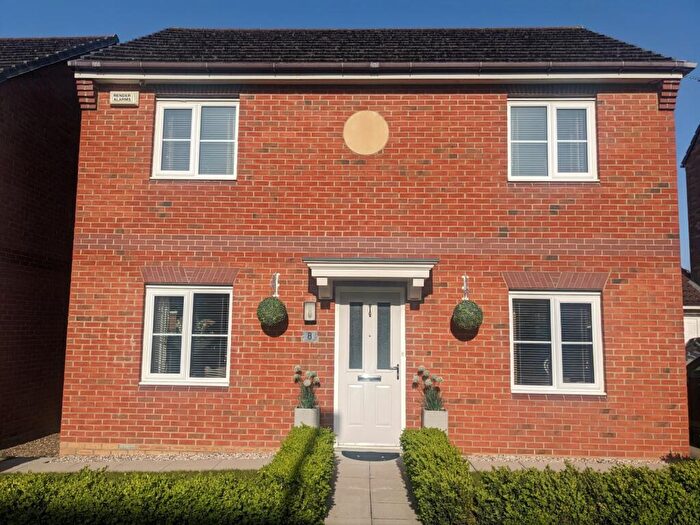
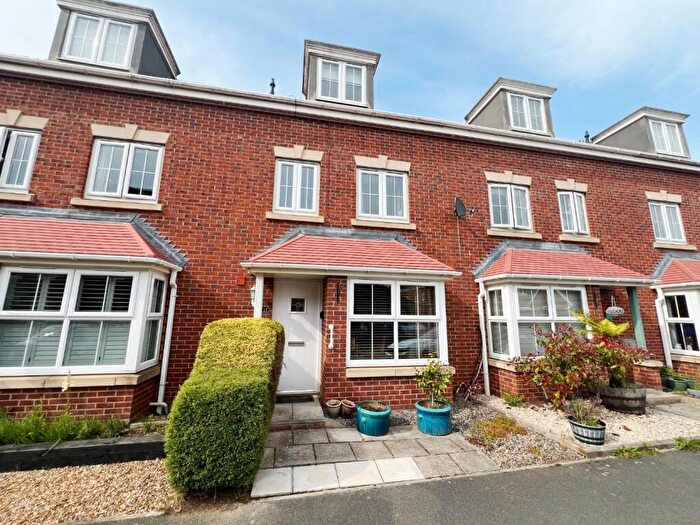
Properties for sale in Spennymoor
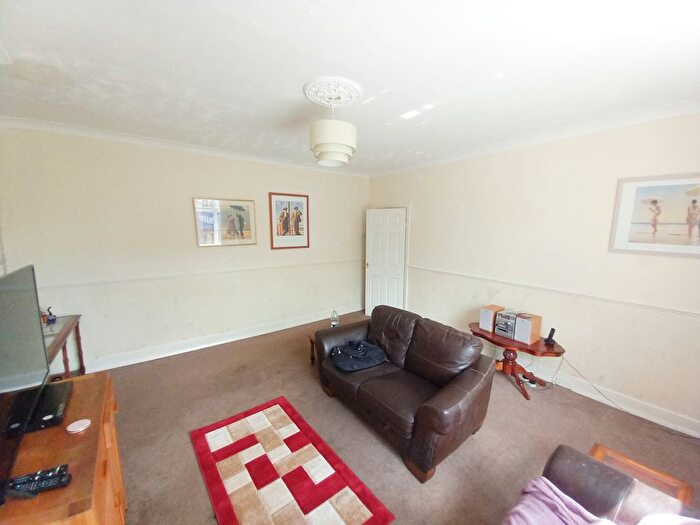
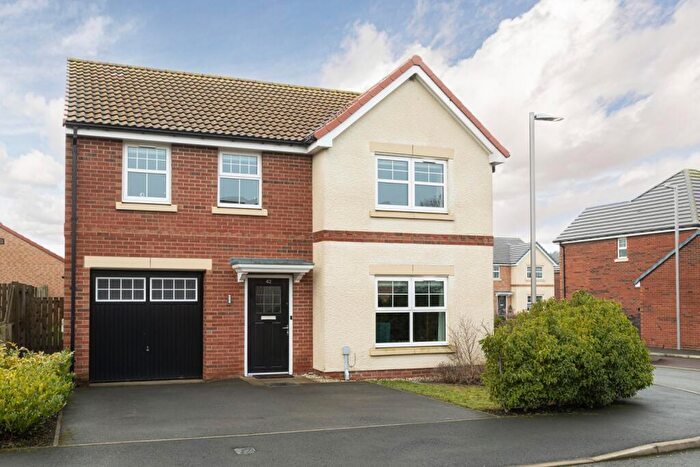
![]()
If you are looking to sell your house, let it out, or receive a property valuation, an expert can help you.
Click the button below to get started.


Neighbourhoods in Spennymoor
Navigate through our locations to find the location of your next house in Spennymoor, County Durham for sale or to rent.
Property price trends in Spennymoor
According to the latest Land Registry data, the average home in Spennymoor sold for £123,362 in 2026. That figure comes from a substantial record of 12,176 sales logged over the past 31 years.
Prices have fallen back over the last three years. Compared with 2023, when the typical sale came in around £138,346, that's a fall of roughly 10.8%.
Looking back five years, average prices are down about 6.6% since 2021, a drop of around £8,658 in cash terms.
Zoom out to the past decade for the fuller picture. Back in 2016, homes here averaged £124,739, so the typical sold price has fallen about 1.1% since then, around 0.1% a year lower. Stretch the view to fifteen years and that annual pace holds at about -0.1%.
Frequently asked questions about Spennymoor
What is the average price for a property for sale in Spennymoor?
The average price for a property for sale in Spennymoor is £139,707. This amount is 1% lower than the average price in County Durham. There are 2,074 property listings for sale in Spennymoor.
What locations have the most expensive properties for sale in Spennymoor?
The locations with the most expensive properties for sale in Spennymoor are Willington And Hunwick at an average of £215,000 and Ferryhill at an average of £182,430.
What locations have the most affordable properties for sale in Spennymoor?
The locations with the most affordable properties for sale in Spennymoor are Spennymoor at an average of £127,603 and Tudhoe at an average of £146,063.
Which train stations are available in or near Spennymoor?
Some of the train stations available in or near Spennymoor are Bishop Auckland, Shildon and Durham.
Property Price Paid in Spennymoor by Year
The average sold property price by year was:
| Year | Average Sold Price | Price Change |
Sold Properties
|
|---|---|---|---|
| 2026 | £123,362 | -19% |
32 Properties |
| 2025 | £147,121 | 7% |
325 Properties |
| 2024 | £136,113 | -2% |
388 Properties |
| 2023 | £138,346 | 1% |
362 Properties |
| 2022 | £137,623 | 4% |
459 Properties |
| 2021 | £132,020 | 4% |
616 Properties |
| 2020 | £126,349 | 3% |
456 Properties |
| 2019 | £122,959 | -5% |
533 Properties |
| 2018 | £128,900 | 3% |
565 Properties |
| 2017 | £124,466 | -0,2% |
463 Properties |
Property Price per Property Type in Spennymoor
Here you can find historic sold price data in order to help with your property search.
The average Property Paid Price for specific property types in the last three years are:
| Property Type | Average Sold Price | Sold Properties |
|---|---|---|
| Semi Detached House | £138,640.00 | 327 Semi Detached Houses |
| Detached House | £253,796.00 | 238 Detached Houses |
| Terraced House | £91,150.00 | 516 Terraced Houses |
| Flat | £72,430.00 | 26 Flats |
Transport in Spennymoor
Please see below transportation links in this area:
