
Houses for sale in Crook, County Durham
House Prices in Crook
Properties in Crook have an average house price of £127k and had 1,144 Property Transactions within the last 3 years.¹
Crook is an area in County Durham with 10,465 households², where the most expensive property was sold for £680k.
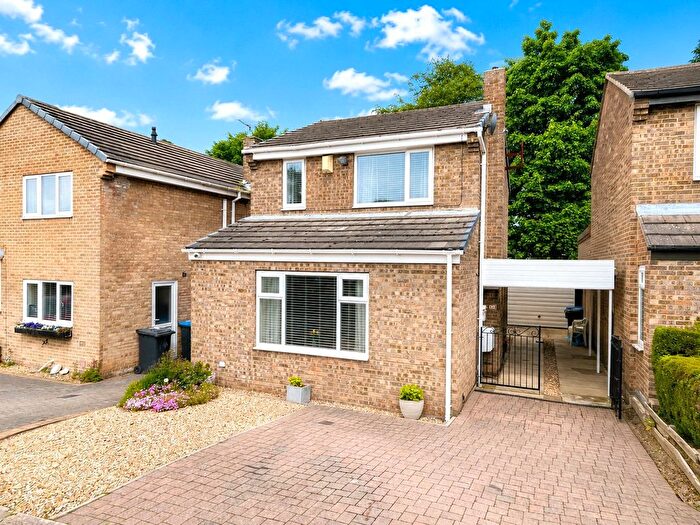
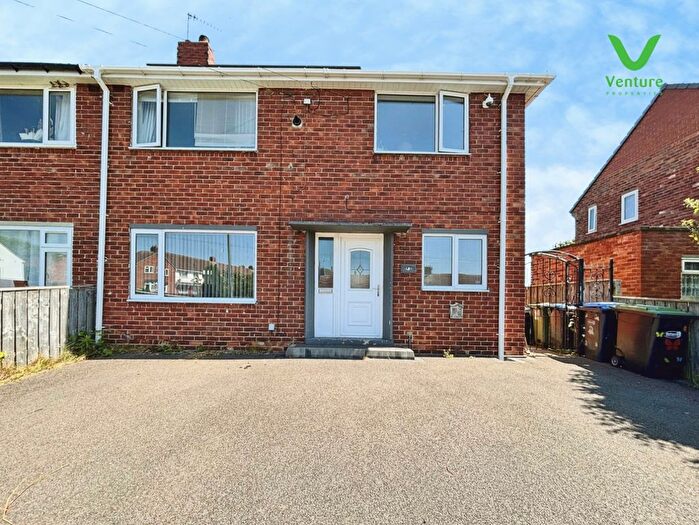
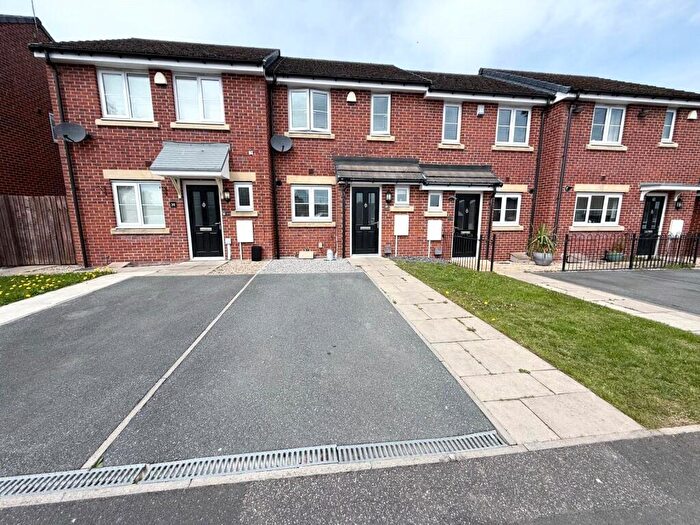
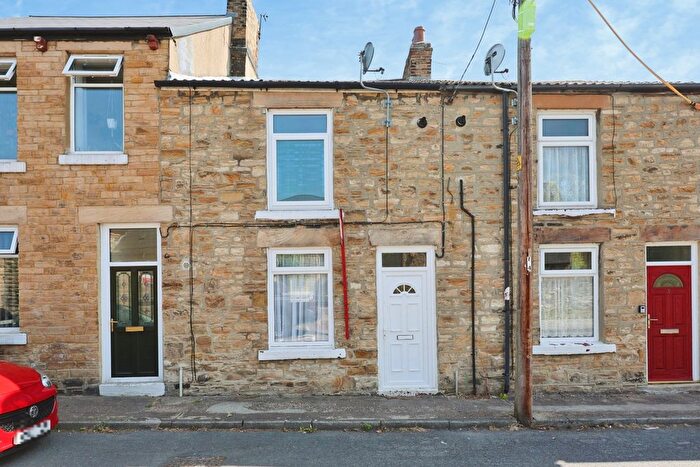
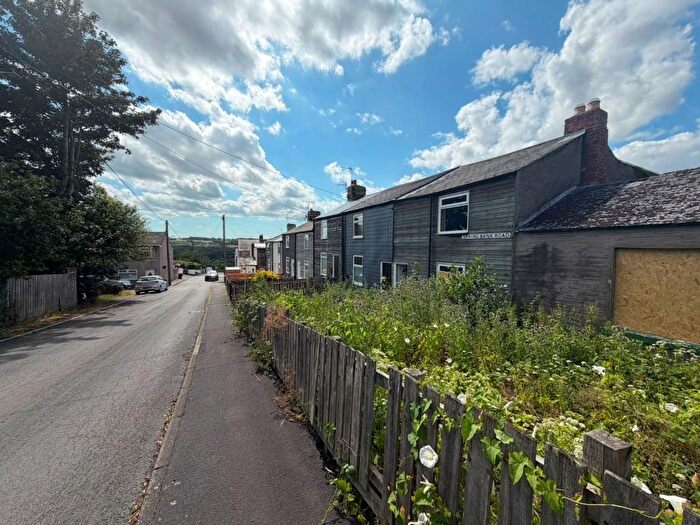
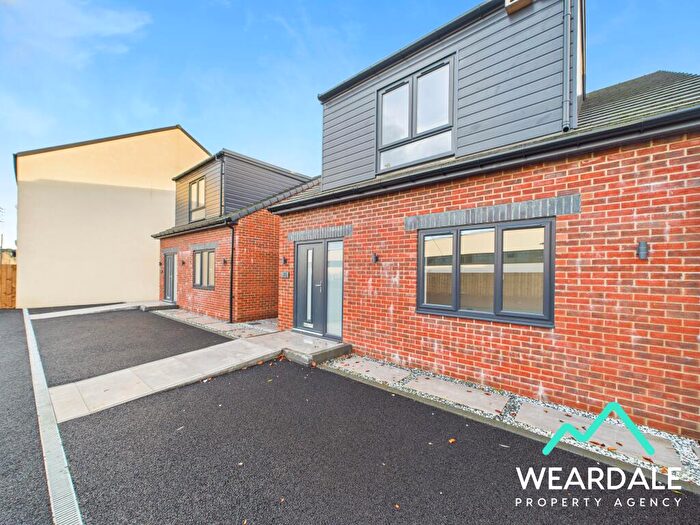
Properties for sale in Crook
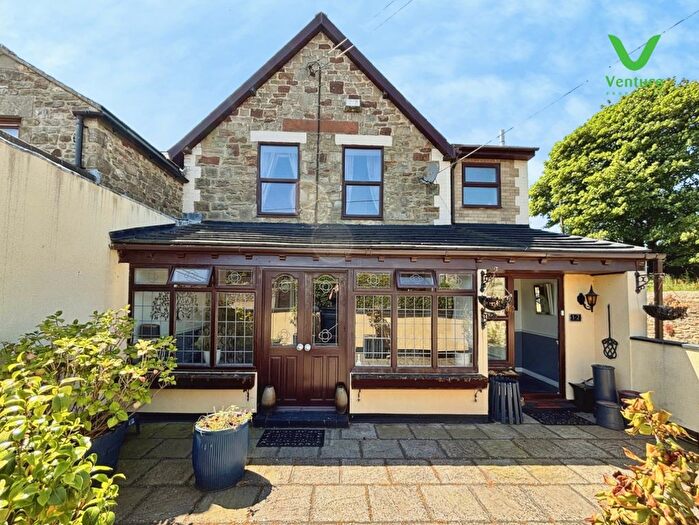
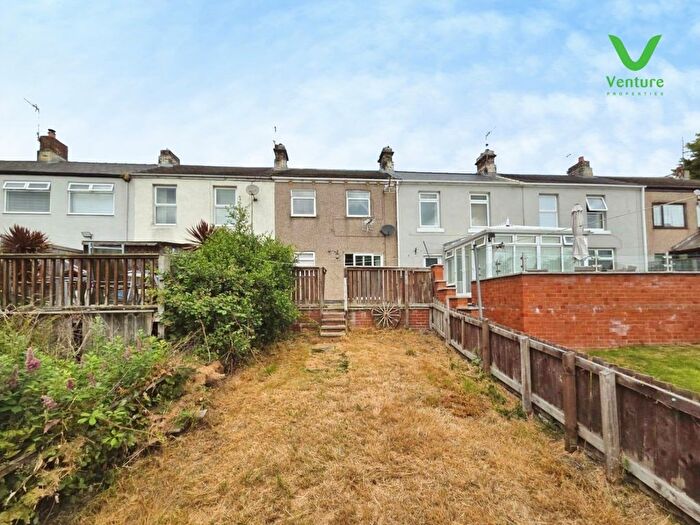
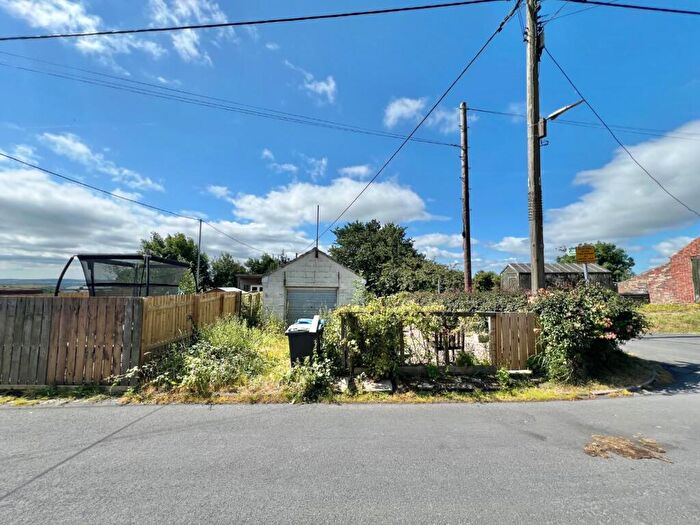
![]()
If you are looking to sell your house, let it out, or receive a property valuation, an expert can help you.
Click the button below to get started.

Neighbourhoods in Crook
Navigate through our locations to find the location of your next house in Crook, County Durham for sale or to rent.
Property price trends in Crook
According to the latest Land Registry data, the average home in Crook sold for £123,434 in 2026. That figure comes from a substantial record of 11,892 sales logged over the past 31 years.
Prices have softened over the last three years. Compared with 2023, when the typical sale came in around £125,963, that's a fall of roughly 2%.
Looking back five years, average prices are down about 5.3% since 2021, a drop of around £6,891 in cash terms.
Zoom out to the past decade for the fuller picture. Back in 2016, homes here averaged £111,244, so the typical sold price has climbed about 11% since then, roughly 1% a year. Stretch the view to fifteen years and that annual pace eases back to about 0.4%.
Frequently asked questions about Crook
What is the average price for a property for sale in Crook?
The average price for a property for sale in Crook is £127,015. This amount is 10% lower than the average price in County Durham. There are 3,492 property listings for sale in Crook.
What locations have the most expensive properties for sale in Crook?
The locations with the most expensive properties for sale in Crook are Deerness at an average of £510,000, Weardale at an average of £142,500 and Willington And Hunwick at an average of £130,124.
What locations have the most affordable properties for sale in Crook?
The locations with the most affordable properties for sale in Crook are Tow Law at an average of £118,342 and Crook at an average of £125,699.
Which train stations are available in or near Crook?
Some of the train stations available in or near Crook are Bishop Auckland, Shildon and Durham.
Property Price Paid in Crook by Year
The average sold property price by year was:
| Year | Average Sold Price | Price Change |
Sold Properties
|
|---|---|---|---|
| 2026 | £123,434 | -10% |
23 Properties |
| 2025 | £135,710 | 11% |
336 Properties |
| 2024 | £120,917 | -4% |
399 Properties |
| 2023 | £125,963 | -3% |
386 Properties |
| 2022 | £129,226 | -1% |
390 Properties |
| 2021 | £130,325 | 8% |
470 Properties |
| 2020 | £119,517 | 8% |
352 Properties |
| 2019 | £109,654 | 1% |
380 Properties |
| 2018 | £108,749 | -1% |
403 Properties |
| 2017 | £109,368 | -2% |
381 Properties |
Property Price per Property Type in Crook
Here you can find historic sold price data in order to help with your property search.
The average Property Paid Price for specific property types in the last three years are:
| Property Type | Average Sold Price | Sold Properties |
|---|---|---|
| Semi Detached House | £124,162.00 | 253 Semi Detached Houses |
| Detached House | £241,801.00 | 246 Detached Houses |
| Terraced House | £85,152.00 | 629 Terraced Houses |
| Flat | £53,031.00 | 16 Flats |
Transport in Crook
Please see below transportation links in this area:
