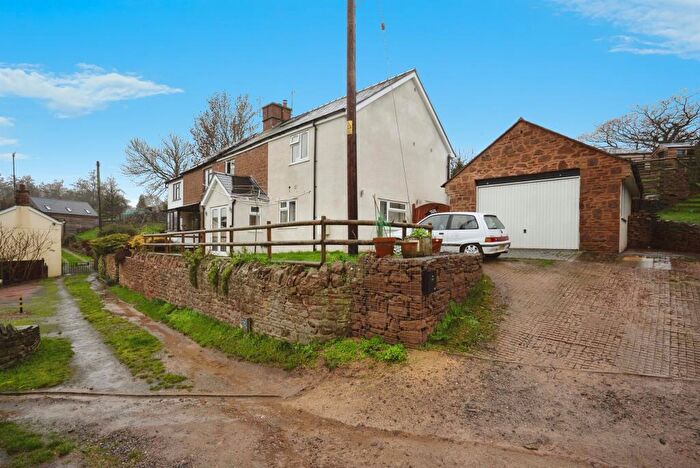
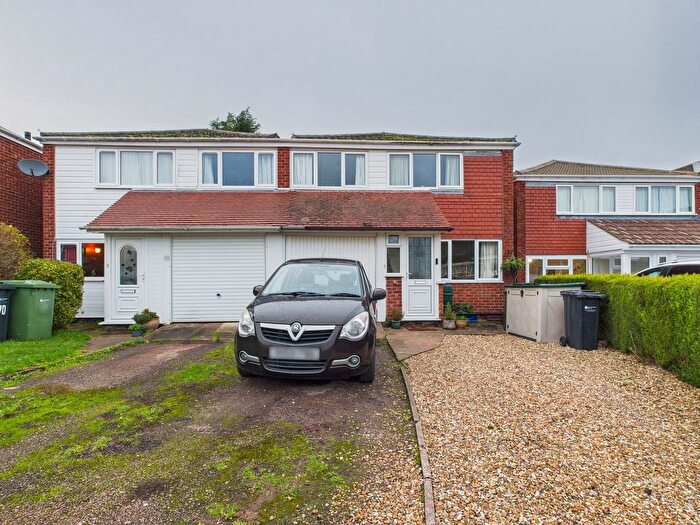
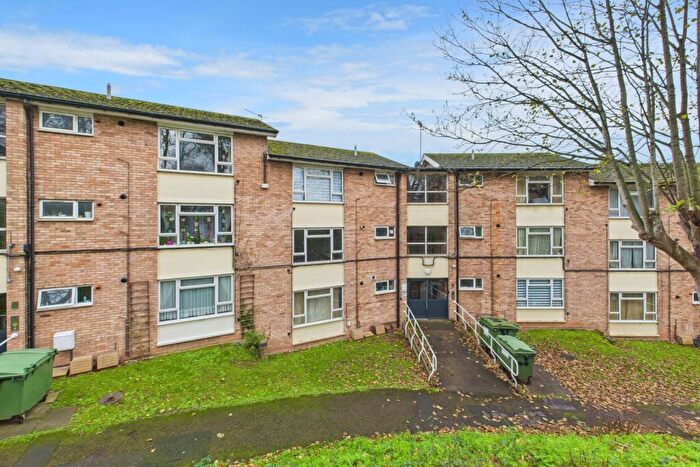
Houses for sale & to rent in Old Gore, Ross-on-wye
House Prices in Old Gore
Properties in Old Gore have an average house price of £544,418.00 and had 42 Property Transactions within the last 3 years¹.
Old Gore is an area in Ross-on-wye, County of Herefordshire with 477 households², where the most expensive property was sold for £1,250,000.00.
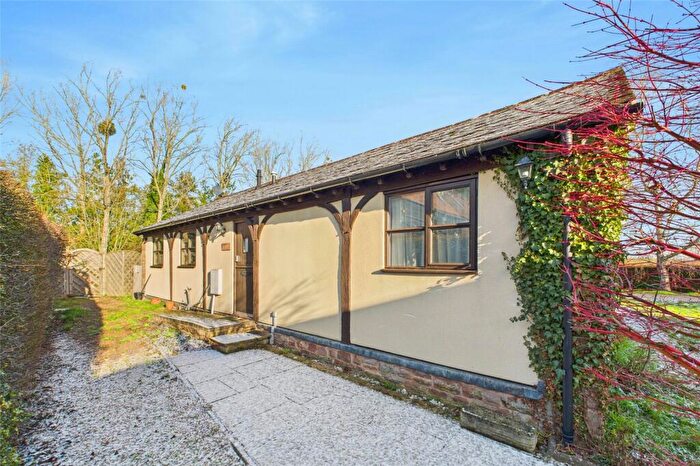
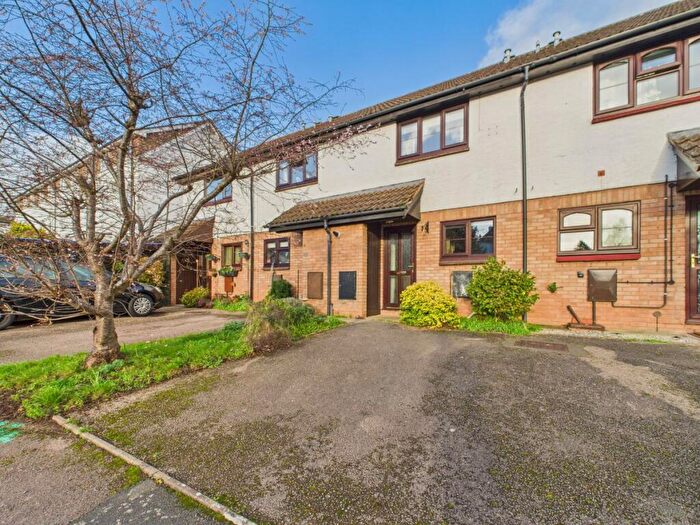
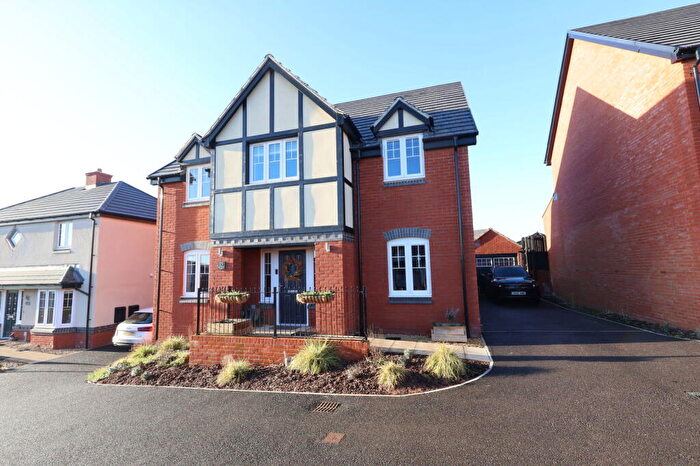
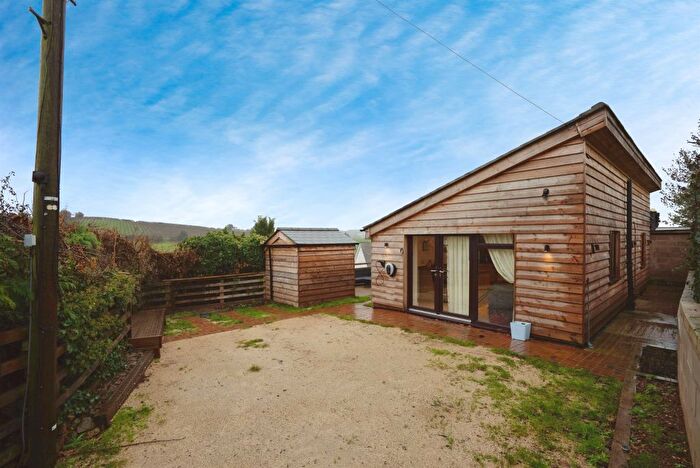
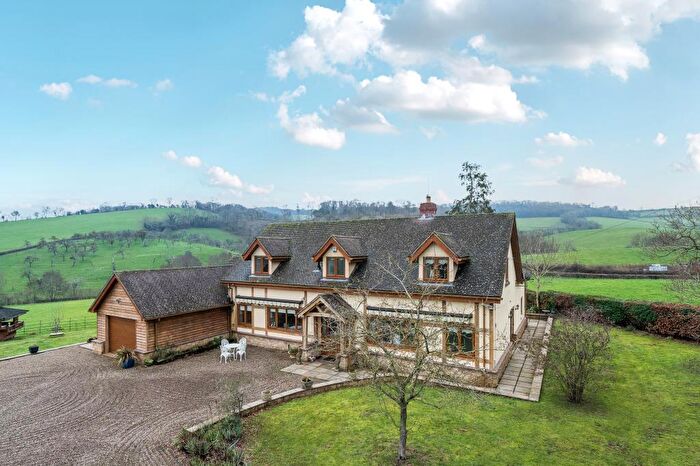
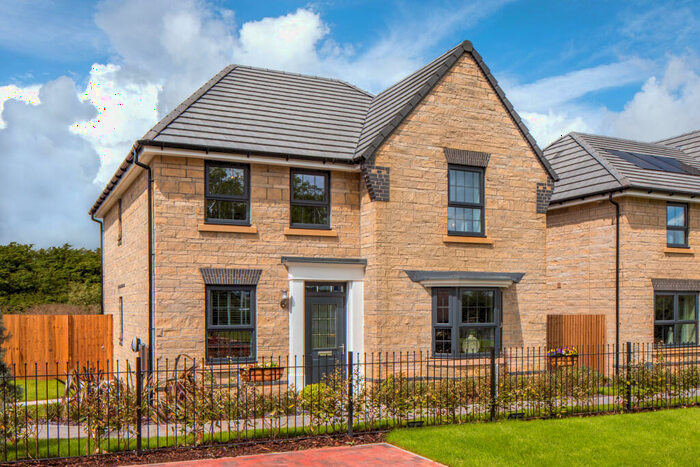
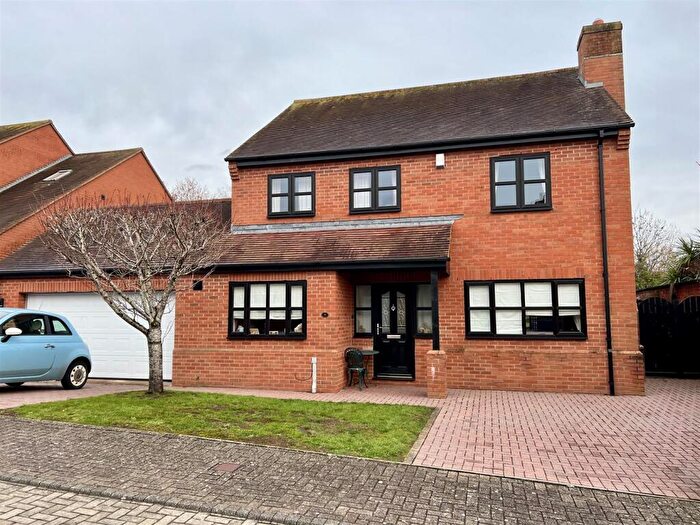
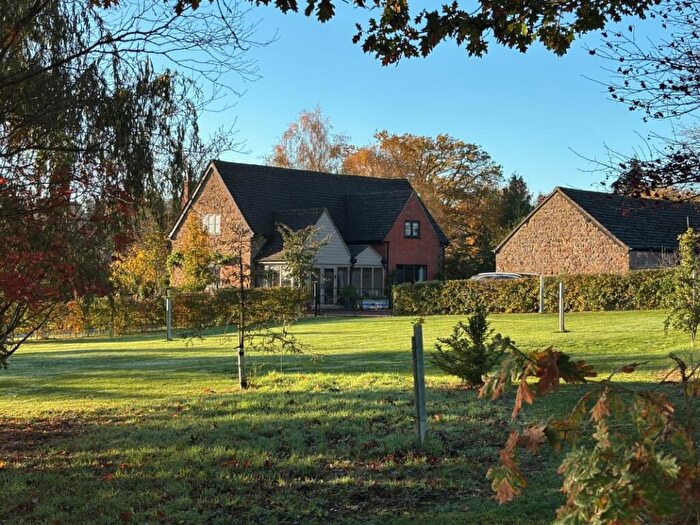
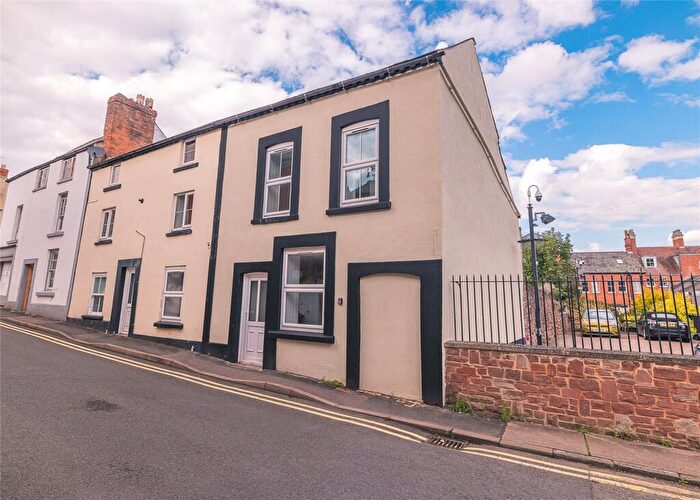
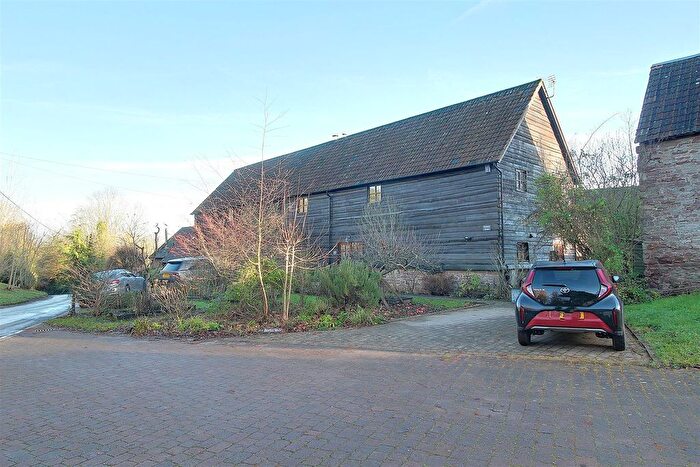
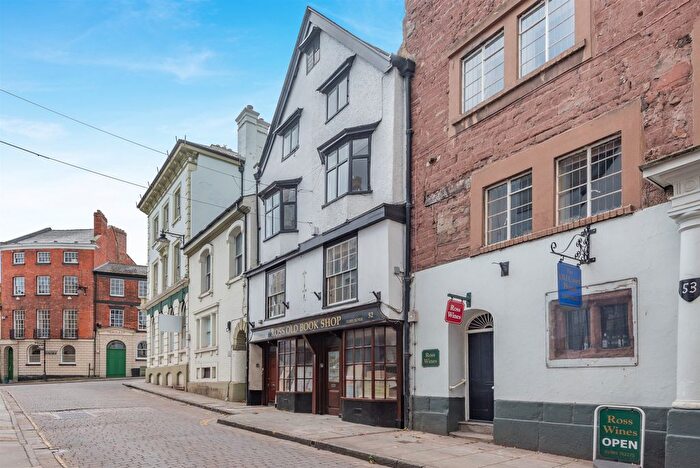
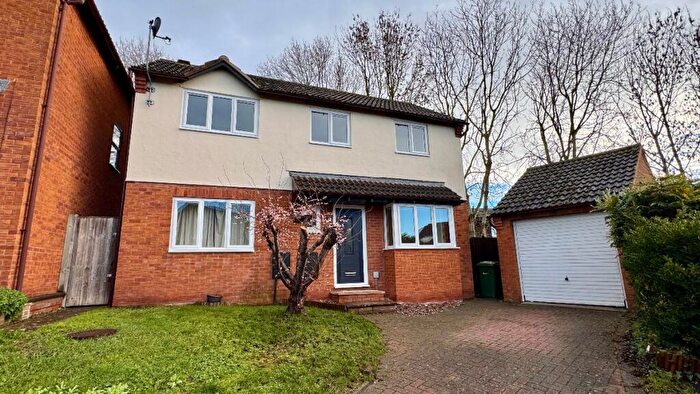
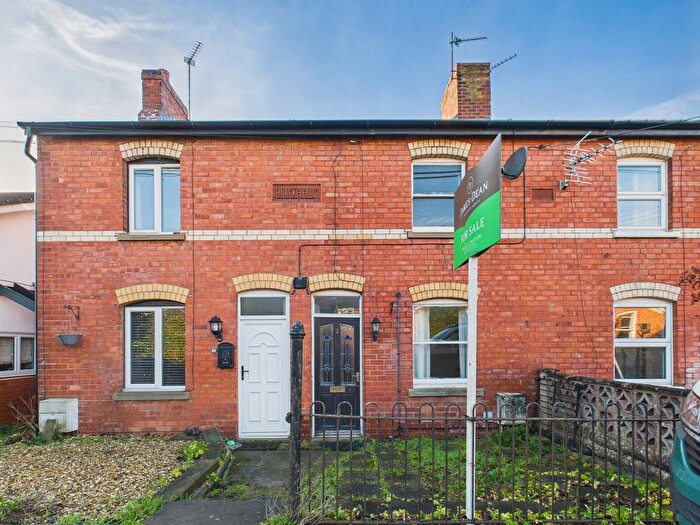
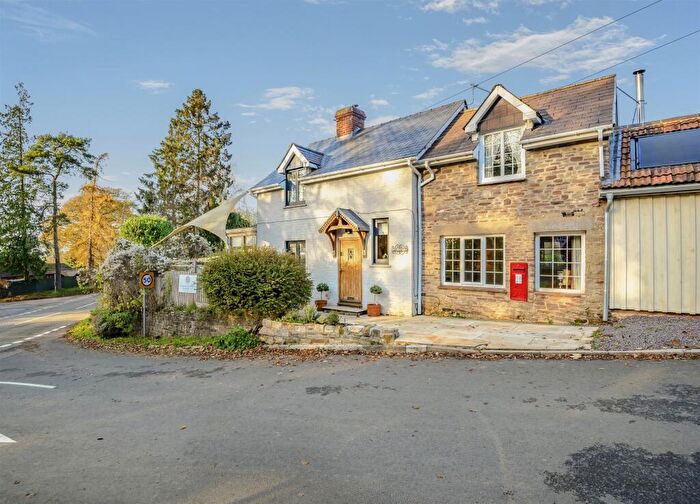
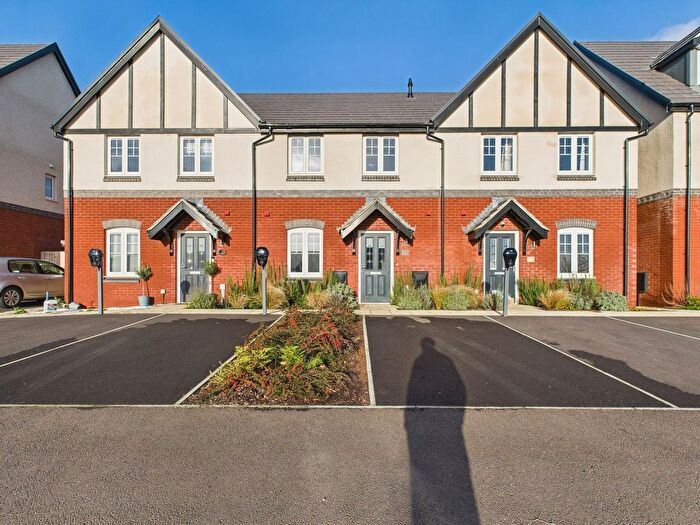
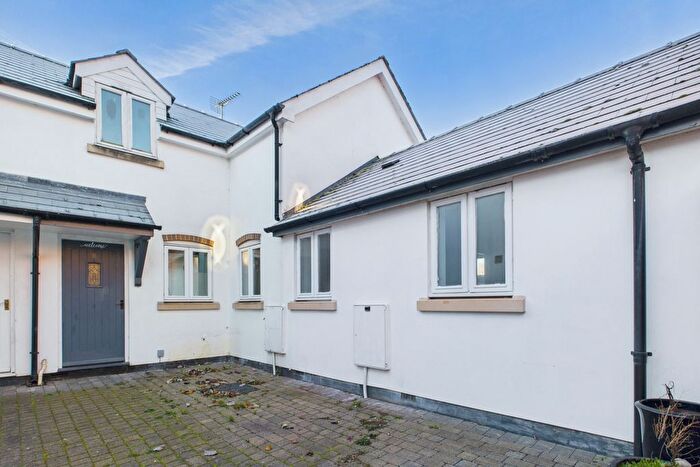
Properties for sale in Old Gore
Roads and Postcodes in Old Gore
Navigate through our locations to find the location of your next house in Old Gore, Ross-on-wye for sale or to rent.
| Streets | Postcodes |
|---|---|
| Gatsford Road | HR9 7JF |
| Green Close | HR9 7JB |
| Orchard Meadow | HR9 7YX |
| Park Farm Cottages | HR9 7QN |
| Perrystone Hill | HR9 7QX HR9 7QY HR9 7QU |
| Phocle Green | HR9 7TL HR9 7TN HR9 7TP HR9 7TS HR9 7TW HR9 7TR HR9 7XU |
| Pomona Grove | HR9 7WB |
| Powell Croft | HR9 7UZ |
| Ross Road | HR9 7JA |
| Spring Meadow | HR9 7SS |
| Swagwater Lane | HR9 7EB |
| The Grove | HR9 7JH |
| The Pastures | HR9 7UU |
| HR9 6QY HR9 6QZ HR9 6RA HR9 6RB HR9 7JD HR9 7JE HR9 7JG HR9 7JJ HR9 7JL HR9 7JN HR9 7JQ HR9 7JW HR9 7QL HR9 7QP HR9 7QT HR9 7QW HR9 7RB HR9 7RF HR9 7RG HR9 7TT HR9 7TU HR9 7TX HR9 7TZ HR9 7UD HR9 7UE HR9 7UF HR9 7UG HR9 7UJ HR9 7UL HR9 7UN HR9 7UP HR9 7UR HR9 7UW HR9 6RD HR9 7HZ HR9 7QR HR9 7QS HR9 7QZ HR9 7RA HR9 7RD HR9 7UA HR9 7UB |
Transport near Old Gore
- FAQ
- Price Paid By Year
- Property Type Price
Frequently asked questions about Old Gore
What is the average price for a property for sale in Old Gore?
The average price for a property for sale in Old Gore is £544,418. This amount is 45% higher than the average price in Ross-on-wye. There are 1,452 property listings for sale in Old Gore.
What streets have the most expensive properties for sale in Old Gore?
The streets with the most expensive properties for sale in Old Gore are Phocle Green at an average of £561,300 and Gatsford Road at an average of £300,000.
What streets have the most affordable properties for sale in Old Gore?
The street with the most affordable properties for sale in Old Gore is Pomona Grove at an average of £260,000.
Which train stations are available in or near Old Gore?
Some of the train stations available in or near Old Gore are Ledbury, Hereford and Colwall.
Property Price Paid in Old Gore by Year
The average sold property price by year was:
| Year | Average Sold Price | Price Change |
Sold Properties
|
|---|---|---|---|
| 2025 | £519,850 | 5% |
10 Properties |
| 2024 | £492,915 | -16% |
11 Properties |
| 2023 | £570,033 | -8% |
15 Properties |
| 2022 | £615,750 | 17% |
6 Properties |
| 2021 | £510,914 | 7% |
21 Properties |
| 2020 | £474,385 | 35% |
14 Properties |
| 2019 | £307,818 | -30% |
11 Properties |
| 2018 | £398,714 | 5% |
21 Properties |
| 2017 | £377,363 | 19% |
19 Properties |
| 2016 | £306,396 | 6% |
15 Properties |
| 2015 | £288,781 | -5% |
16 Properties |
| 2014 | £304,521 | -4% |
21 Properties |
| 2013 | £316,470 | -1% |
17 Properties |
| 2012 | £318,541 | 16% |
12 Properties |
| 2011 | £267,800 | -16% |
10 Properties |
| 2010 | £311,000 | -1% |
13 Properties |
| 2009 | £312,666 | 14% |
9 Properties |
| 2008 | £269,227 | -22% |
11 Properties |
| 2007 | £328,162 | 1% |
16 Properties |
| 2006 | £325,571 | -1% |
14 Properties |
| 2005 | £327,412 | 31% |
12 Properties |
| 2004 | £225,222 | -25% |
9 Properties |
| 2003 | £280,418 | 23% |
16 Properties |
| 2002 | £216,090 | 15% |
22 Properties |
| 2001 | £183,062 | 10% |
16 Properties |
| 2000 | £165,296 | -3% |
15 Properties |
| 1999 | £169,885 | 3% |
27 Properties |
| 1998 | £164,246 | 41% |
16 Properties |
| 1997 | £96,857 | 18% |
21 Properties |
| 1996 | £79,500 | 5% |
20 Properties |
| 1995 | £75,812 | - |
16 Properties |
Property Price per Property Type in Old Gore
Here you can find historic sold price data in order to help with your property search.
The average Property Paid Price for specific property types in the last three years are:
| Property Type | Average Sold Price | Sold Properties |
|---|---|---|
| Semi Detached House | £420,409.00 | 11 Semi Detached Houses |
| Detached House | £631,243.00 | 27 Detached Houses |
| Terraced House | £299,375.00 | 4 Terraced Houses |

