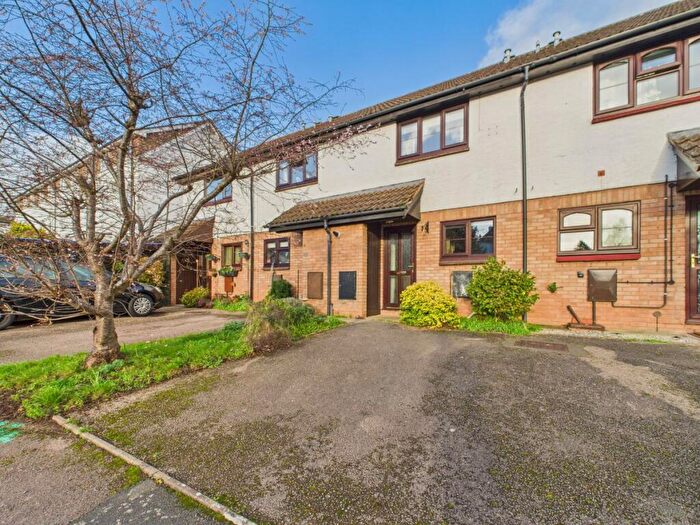
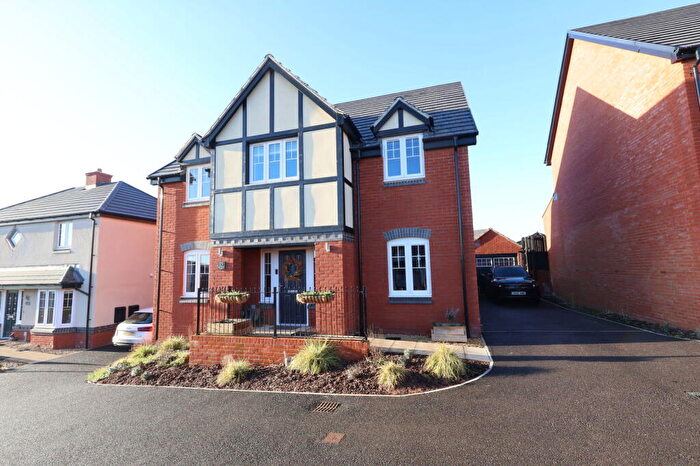
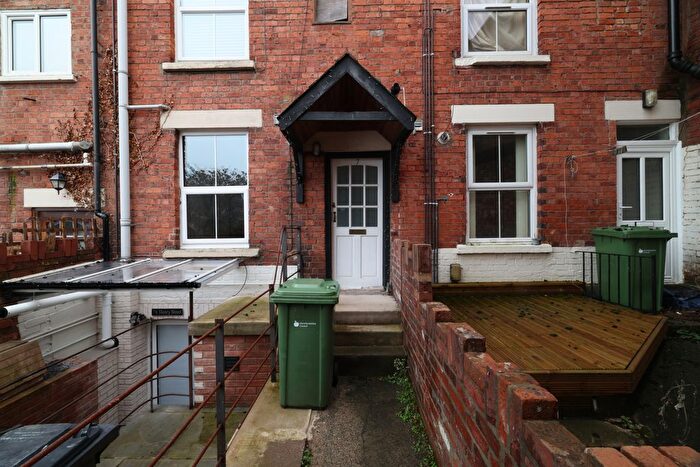
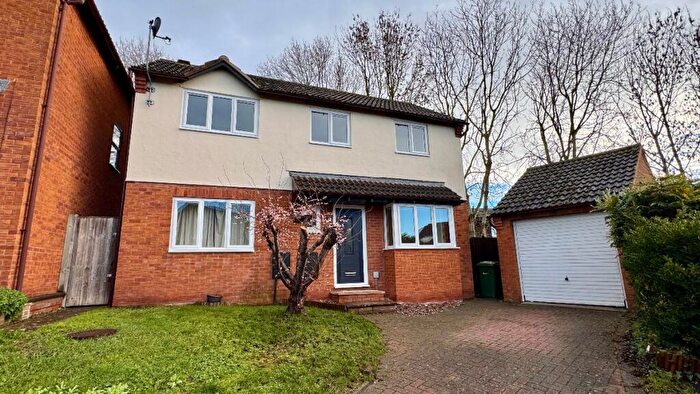
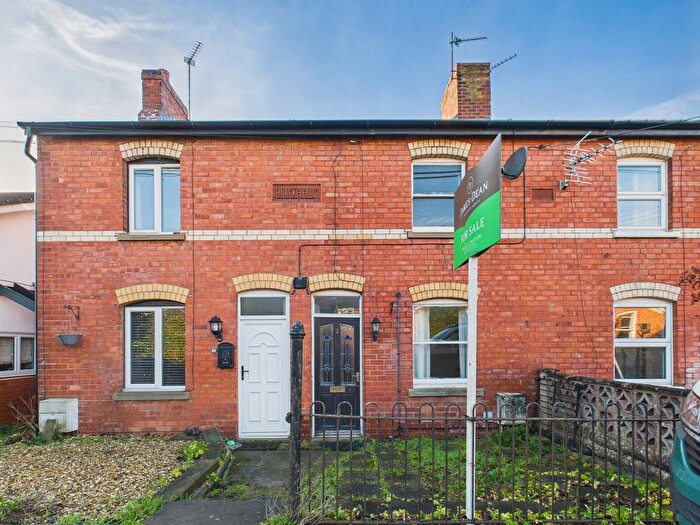
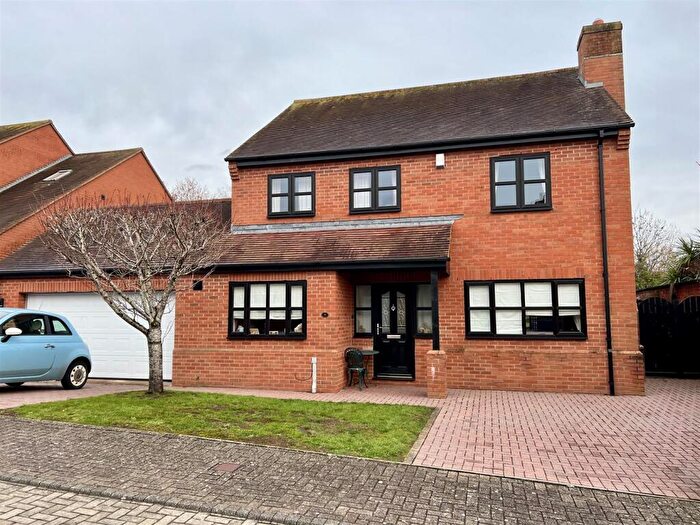
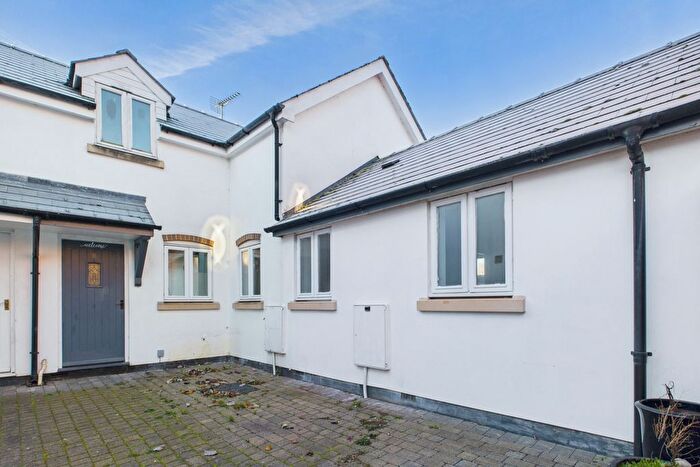
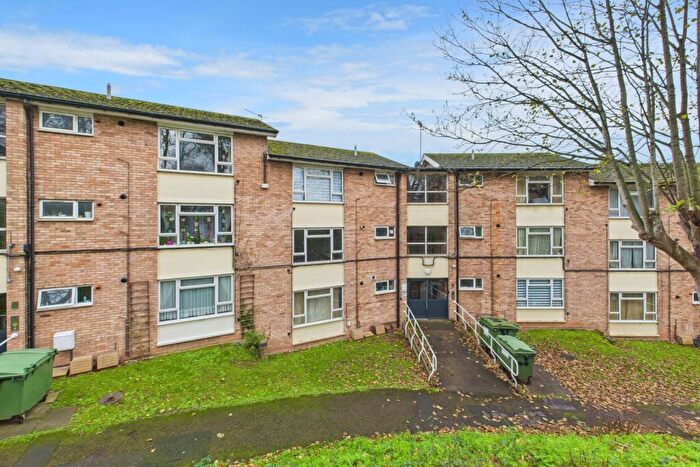
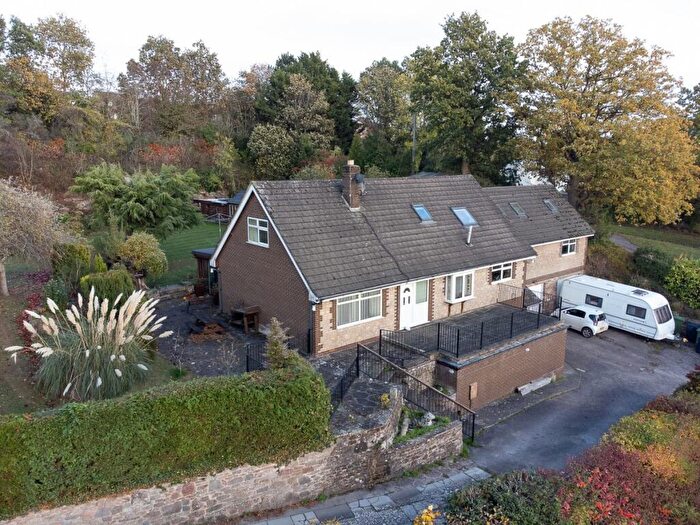
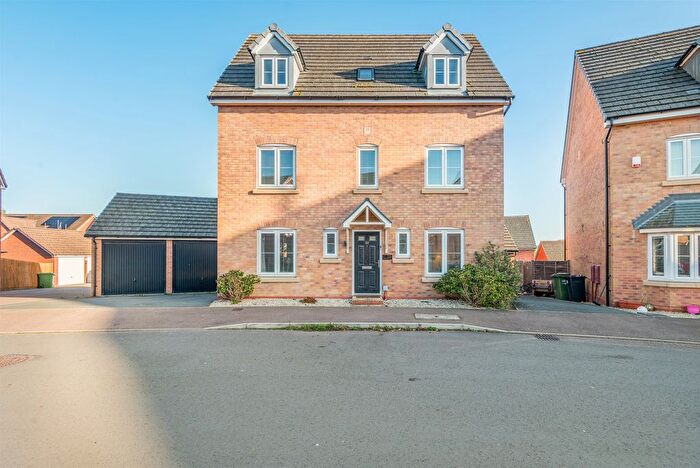
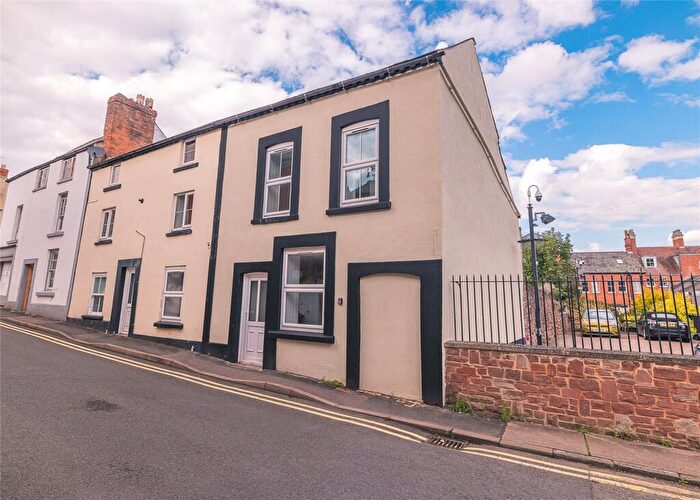
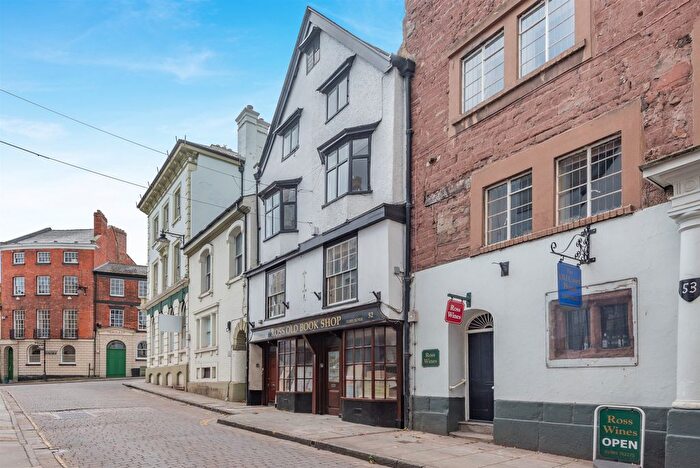
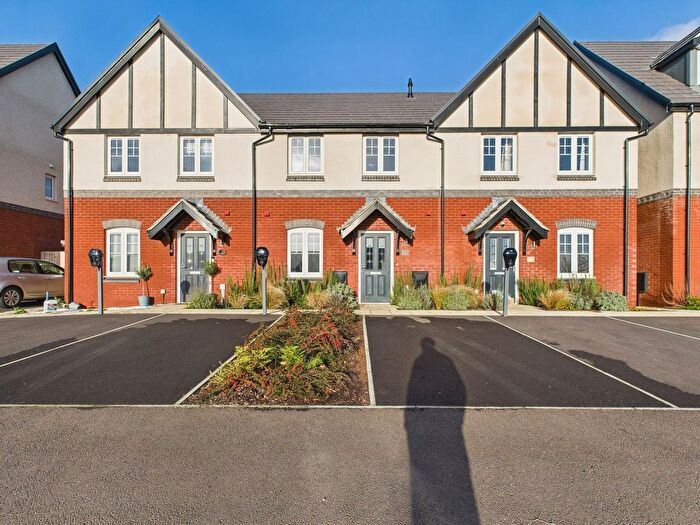
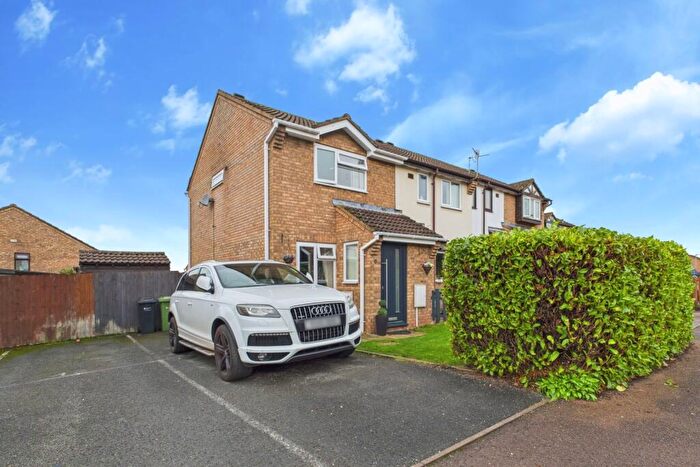
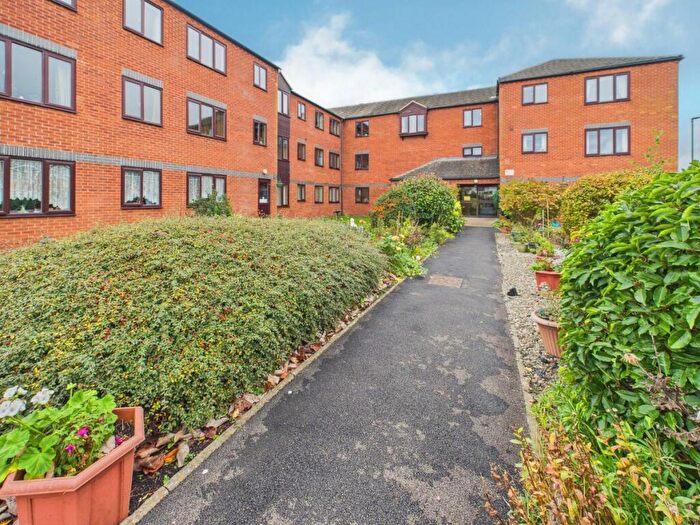
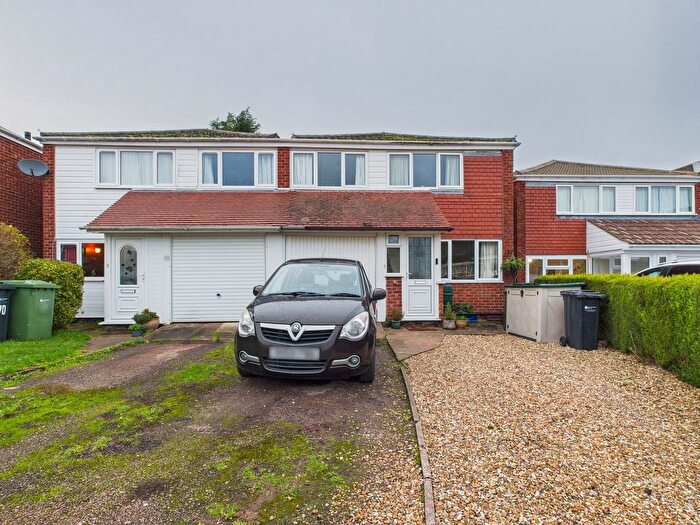
Houses for sale & to rent in Ross North, Ross-on-wye
House Prices in Ross North
Properties in Ross North have an average house price of £349,818.00 and had 11 Property Transactions within the last 3 years¹.
Ross North is an area in Ross-on-wye, County of Herefordshire with 41 households², where the most expensive property was sold for £595,000.00.
Properties for sale in Ross North
Roads and Postcodes in Ross North
Navigate through our locations to find the location of your next house in Ross North, Ross-on-wye for sale or to rent.
| Streets | Postcodes |
|---|---|
| Aachen Close | HR9 7YU |
| Archangel Close | HR9 7YJ |
| Beamhouse Drive | HR9 7GR |
| Brampton Road | HR9 7FX |
| Brook Road | HR9 7QG |
| Brookfield Road | HR9 7EJ |
| Cordwainers Lane | HR9 7GS |
| Dragoon Road | HR9 7YR |
| Fantail Crescent | HR9 7WT |
| Frillbank Road | HR9 7WU |
| Great Western Court | HR9 7XP |
| Harness Walk | HR9 7GF |
| Horseman Close | HR9 7YG |
| Jacobin Lane | HR9 7WQ |
| Ledbury Road | HR9 7AJ HR9 7ET HR9 7QJ |
| Netherton Road | HR9 7QQ |
| River View | HR9 7DT |
| Saddlers Rise | HR9 7GU |
| Saxon Avenue | HR9 7WR |
| Skylark Lane | HR9 7XY |
| Starling Road | HR9 7WP |
| The Orchard | HR9 7BP |
| Thuringen Street | HR9 7WX |
| Turbit Close | HR9 7WW |
| HR9 7QH HR9 7US |
Transport near Ross North
- FAQ
- Price Paid By Year
- Property Type Price
Frequently asked questions about Ross North
What is the average price for a property for sale in Ross North?
The average price for a property for sale in Ross North is £349,818. This amount is 7% lower than the average price in Ross-on-wye. There are 960 property listings for sale in Ross North.
What streets have the most expensive properties for sale in Ross North?
The streets with the most expensive properties for sale in Ross North are The Orchard at an average of £525,500, Harness Walk at an average of £480,000 and Beamhouse Drive at an average of £295,000.
What streets have the most affordable properties for sale in Ross North?
The streets with the most affordable properties for sale in Ross North are Saddlers Rise at an average of £117,000 and Cordwainers Lane at an average of £270,000.
Which train stations are available in or near Ross North?
Some of the train stations available in or near Ross North are Ledbury, Hereford and Colwall.
Property Price Paid in Ross North by Year
The average sold property price by year was:
| Year | Average Sold Price | Price Change |
Sold Properties
|
|---|---|---|---|
| 2025 | £334,000 | -14% |
6 Properties |
| 2024 | £379,500 | 22% |
2 Properties |
| 2023 | £297,500 | -65% |
2 Properties |
| 2022 | £490,000 | 35% |
1 Property |
| 2021 | £320,071 | 24% |
7 Properties |
| 2020 | £243,000 | -1% |
6 Properties |
| 2019 | £245,000 | -1% |
6 Properties |
| 2018 | £247,681 | 0,3% |
8 Properties |
| 2017 | £246,915 | 15% |
6 Properties |
| 2016 | £209,121 | -16% |
4 Properties |
| 2015 | £241,631 | 18% |
28 Properties |
| 2014 | £198,863 | - |
15 Properties |
Property Price per Property Type in Ross North
Here you can find historic sold price data in order to help with your property search.
The average Property Paid Price for specific property types in the last three years are:
| Property Type | Average Sold Price | Sold Properties |
|---|---|---|
| Semi Detached House | £286,000.00 | 5 Semi Detached Houses |
| Terraced House | £117,000.00 | 1 Terraced House |
| Detached House | £460,200.00 | 5 Detached Houses |

