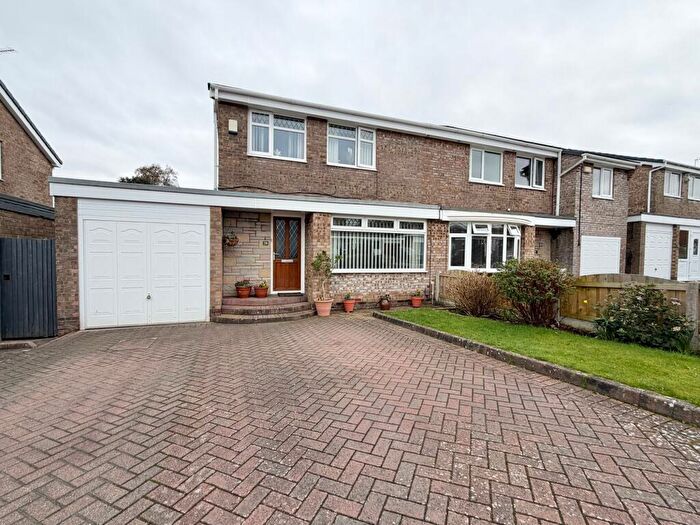
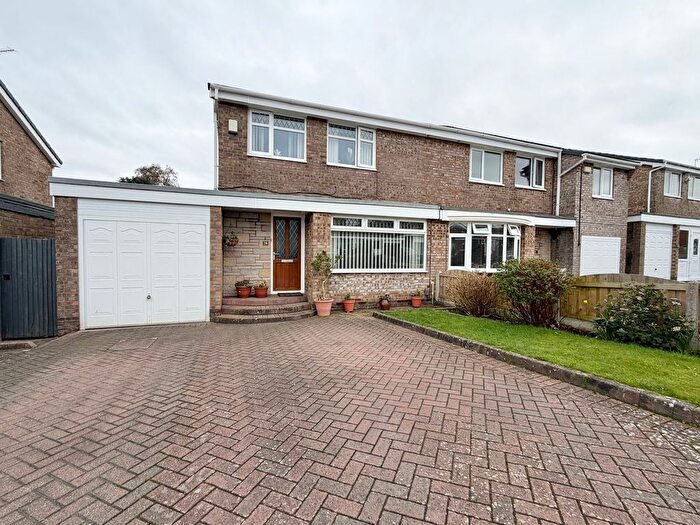
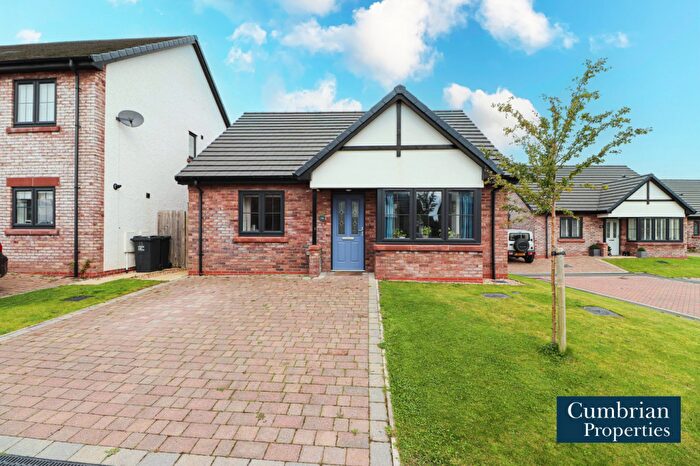
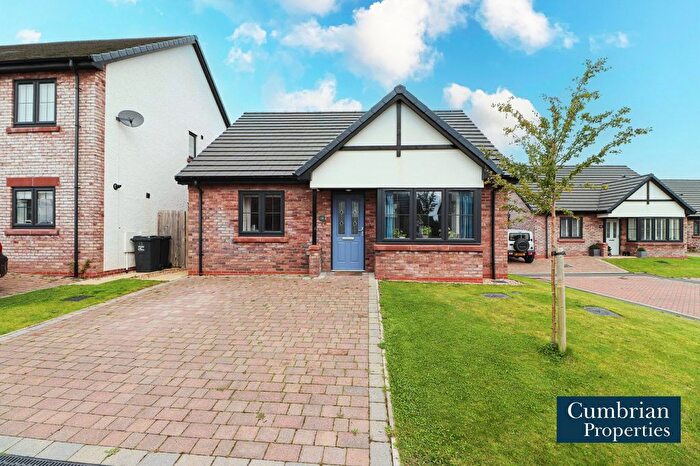
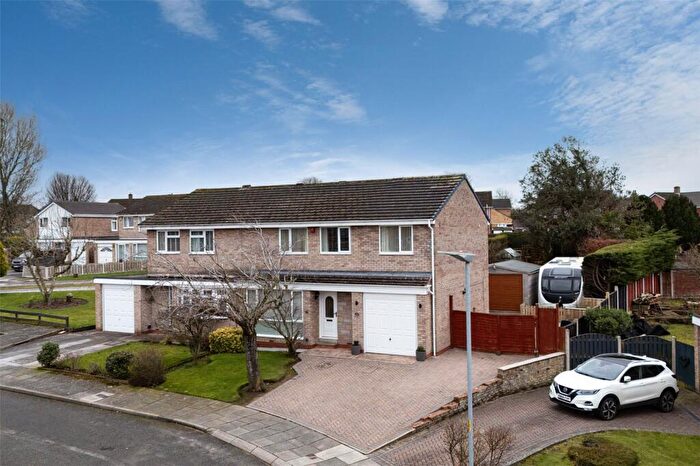
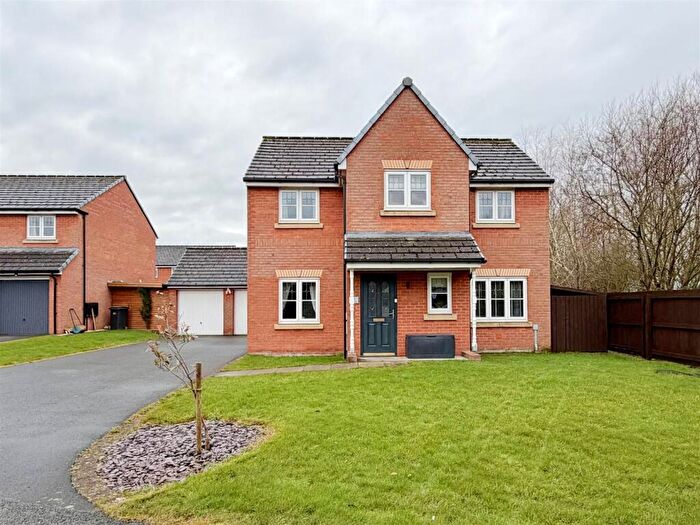
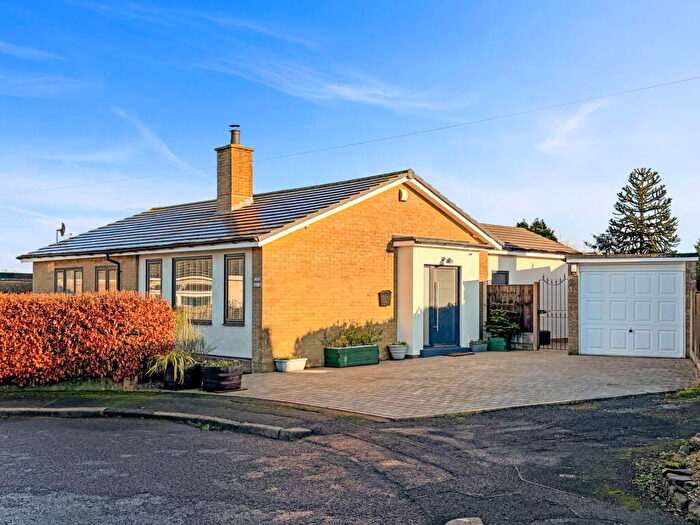
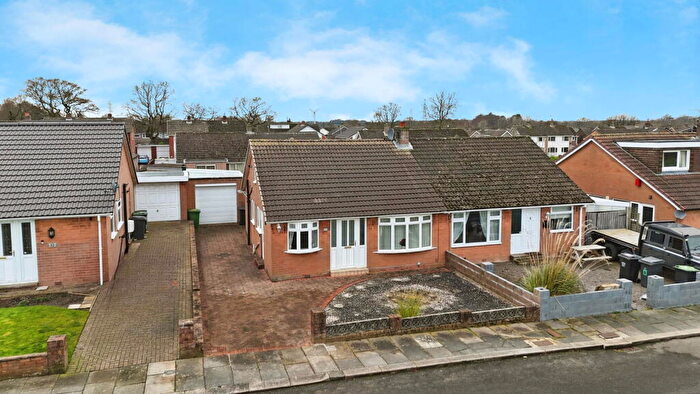
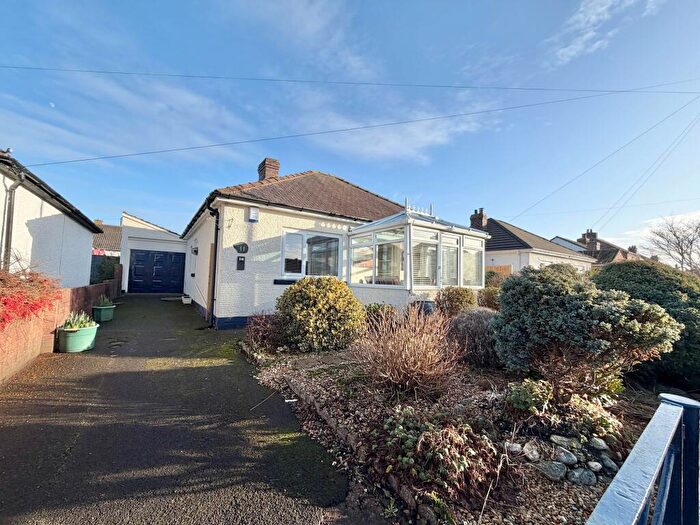
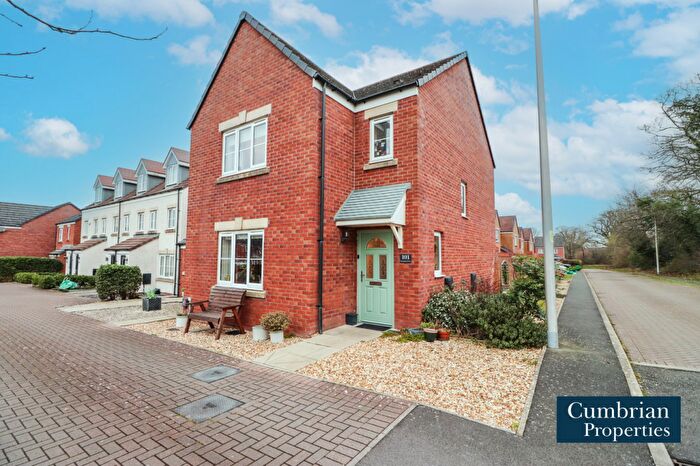
Houses for sale & to rent in Burgh, Carlisle
House Prices in Burgh
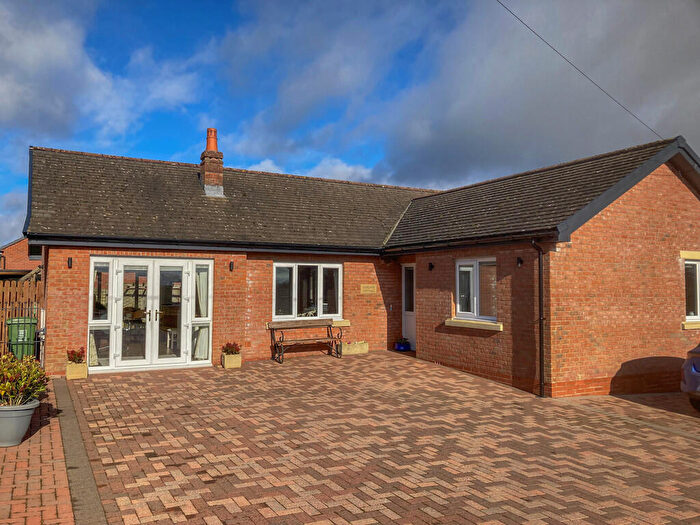
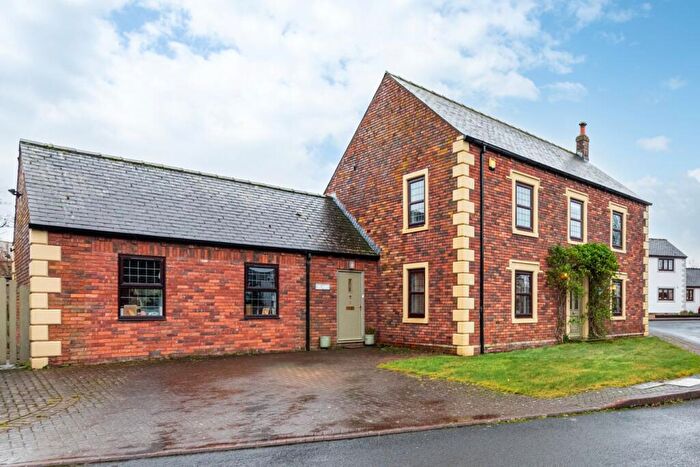
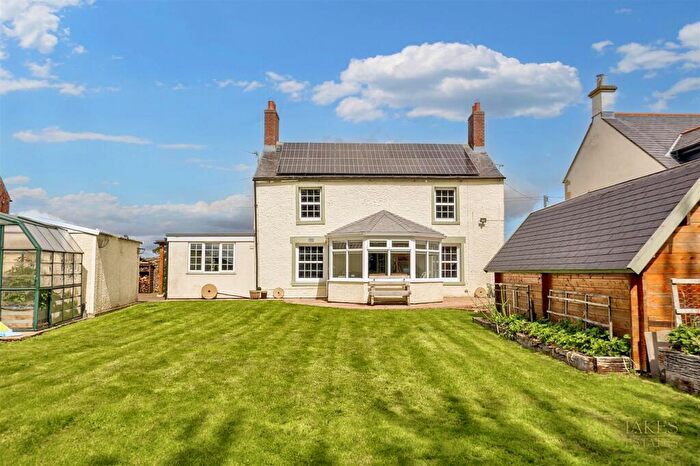
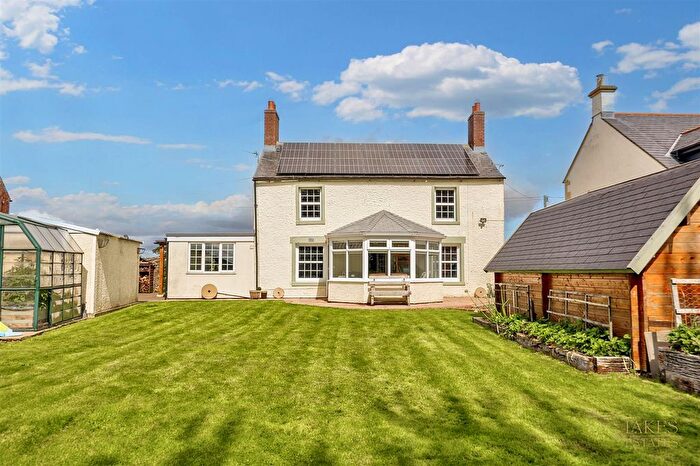
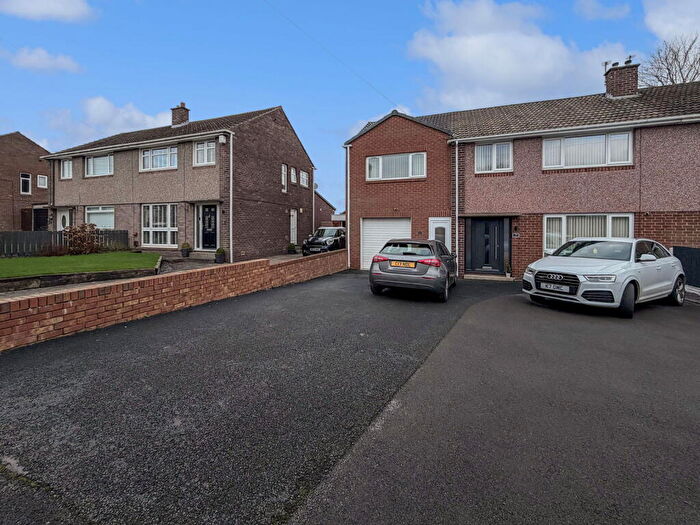
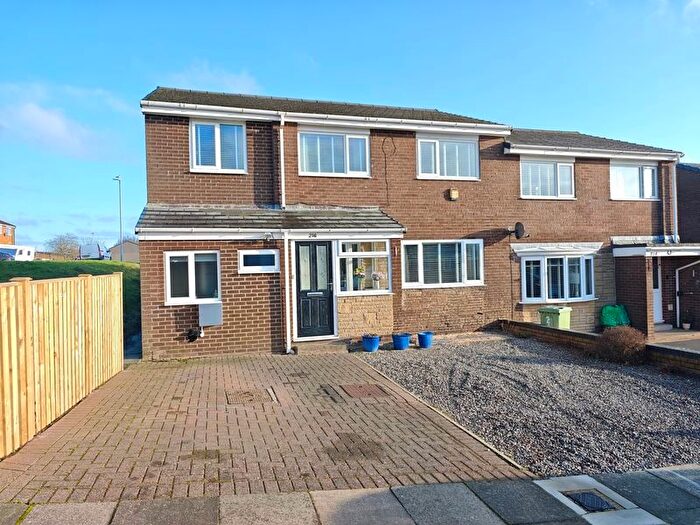
Properties in Burgh have an average house price of £280,897.00 and had 49 Property Transactions within the last 3 years¹.
Burgh is an area in Carlisle, Cumbria with 787 households², where the most expensive property was sold for £605,000.00.
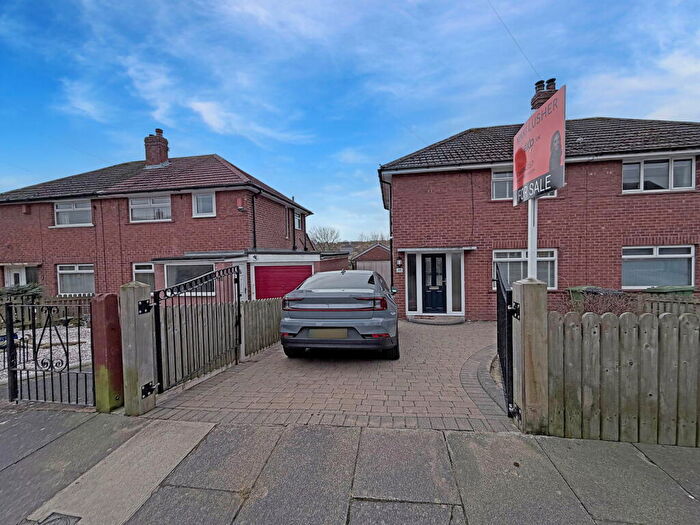
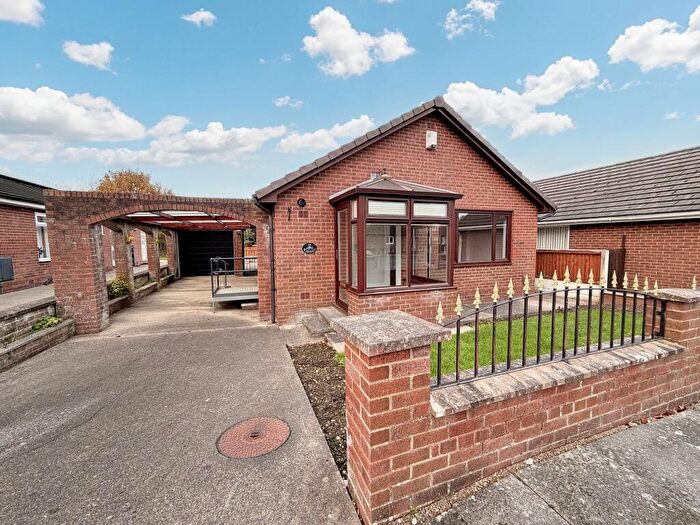
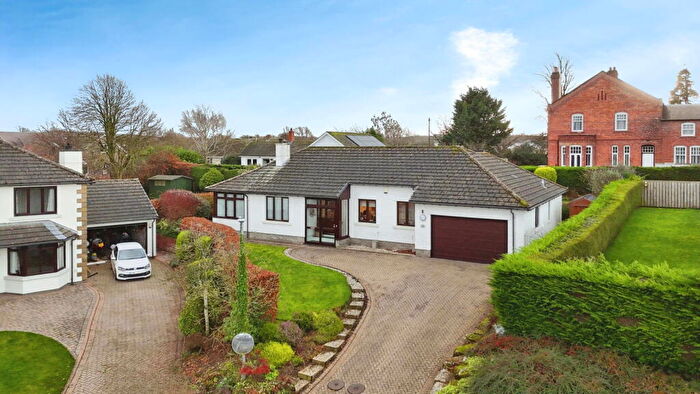
Properties for sale in Burgh
Roads and Postcodes in Burgh
Navigate through our locations to find the location of your next house in Burgh, Carlisle for sale or to rent.
| Streets | Postcodes |
|---|---|
| Amberfield | CA5 6AS |
| Ash Tree Square | CA5 6AY |
| Beech Croft | CA5 6AU |
| Boustead Hill | CA5 6AA |
| Braelees | CA5 6DU |
| Broad View | CA5 6LY |
| Bunkers Hill | CA2 6RA |
| Chapel Field | CA5 6HJ |
| Chapelfield Lane | CA5 6HP |
| Cross Farm Cottages | CA5 6AN CA5 6AP |
| Cross House Gardens | CA5 6NW |
| Custy Steps | CA5 6LU |
| Follet Close | CA5 6EL |
| Grinsdale Bridge | CA5 6DP CA5 6DR |
| Hadrians Court | CA5 6DT |
| Hill Top | CA5 6HF |
| Holmecroft | CA5 6LQ |
| Hosket Hill | CA5 6DN |
| Linden Gate | CA5 6LS |
| Longburgh | CA5 6AF CA5 6BJ |
| Longburgh Fauld | CA5 6AE |
| Ludgate Hill | CA5 6AT |
| Mains Fauld | CA5 6LP |
| Marsh House Gardens | CA5 6AX |
| Milton Lane | CA5 6BG |
| Monkhill | CA5 6DB CA5 6DD |
| Monkhill Fauld | CA5 6DG |
| Monkhill Road | CA5 6ER |
| Moorhouse Road | CA2 7RL CA5 6EJ CA5 6JJ |
| North End | CA5 6BD |
| Orchard Close | CA5 6BZ |
| Orton Park | CA5 6JU CA5 6JX |
| Orton Rigg | CA5 6LL |
| Sceughmire | CA5 6JS |
| Shepherds Hill Court | CA5 6HH |
| South View Cottages | CA5 6LX |
| Southfield | CA5 6BT |
| St Lawrence Place | CA5 6BS |
| Station Road | CA5 6AZ |
| The Courtyards | CA5 6EX |
| The Croft | CA5 6BB |
| The Pack | CA5 6BE |
| Vallum Place | CA5 6DE |
| West End | CA5 6BW |
| CA5 6AG CA5 6AL CA5 6AQ CA5 6AW CA5 6BH CA5 6BQ CA5 6DA CA5 6DH CA5 6DJ CA5 6DL CA5 6DS CA5 6DW CA5 6DX CA5 6EB CA5 6ED CA5 6EF CA5 6EP CA5 6EW CA5 6EY CA5 6HA CA5 6HD CA5 6HE CA5 6HG CA5 6HL CA5 6HN CA5 6HQ CA5 6LJ CA5 6LW CA5 6LZ CA5 6NA CA5 6NB CA5 6ND CA5 6NE |
Transport near Burgh
- FAQ
- Price Paid By Year
- Property Type Price
Frequently asked questions about Burgh
What is the average price for a property for sale in Burgh?
The average price for a property for sale in Burgh is £280,897. This amount is 54% higher than the average price in Carlisle. There are 1,141 property listings for sale in Burgh.
What streets have the most expensive properties for sale in Burgh?
The streets with the most expensive properties for sale in Burgh are Longburgh at an average of £525,000, Holmecroft at an average of £510,000 and North End at an average of £390,000.
What streets have the most affordable properties for sale in Burgh?
The streets with the most affordable properties for sale in Burgh are Beech Croft at an average of £165,000, Station Road at an average of £166,333 and Monkhill Fauld at an average of £170,000.
Which train stations are available in or near Burgh?
Some of the train stations available in or near Burgh are Carlisle, Dalston and Gretna Green.
Property Price Paid in Burgh by Year
The average sold property price by year was:
| Year | Average Sold Price | Price Change |
Sold Properties
|
|---|---|---|---|
| 2025 | £303,593 | 7% |
16 Properties |
| 2024 | £281,975 | 11% |
20 Properties |
| 2023 | £251,307 | -15% |
13 Properties |
| 2022 | £289,957 | -4% |
28 Properties |
| 2021 | £302,128 | 10% |
35 Properties |
| 2020 | £272,129 | 5% |
27 Properties |
| 2019 | £258,062 | 2% |
16 Properties |
| 2018 | £252,400 | 13% |
25 Properties |
| 2017 | £220,819 | -5% |
21 Properties |
| 2016 | £231,622 | 0,1% |
35 Properties |
| 2015 | £231,462 | -5% |
28 Properties |
| 2014 | £243,670 | 13% |
20 Properties |
| 2013 | £211,592 | -25% |
27 Properties |
| 2012 | £264,457 | 8% |
17 Properties |
| 2011 | £242,114 | 8% |
25 Properties |
| 2010 | £223,850 | 9% |
20 Properties |
| 2009 | £203,233 | -26% |
15 Properties |
| 2008 | £255,294 | 9% |
17 Properties |
| 2007 | £231,603 | -4% |
38 Properties |
| 2006 | £240,382 | 14% |
26 Properties |
| 2005 | £206,182 | 5% |
34 Properties |
| 2004 | £196,611 | 10% |
36 Properties |
| 2003 | £176,615 | 21% |
29 Properties |
| 2002 | £139,461 | 24% |
46 Properties |
| 2001 | £105,784 | 9% |
22 Properties |
| 2000 | £96,061 | 2% |
39 Properties |
| 1999 | £94,511 | -2% |
40 Properties |
| 1998 | £96,042 | 17% |
36 Properties |
| 1997 | £79,652 | 5% |
21 Properties |
| 1996 | £75,694 | 6% |
36 Properties |
| 1995 | £71,130 | - |
18 Properties |
Property Price per Property Type in Burgh
Here you can find historic sold price data in order to help with your property search.
The average Property Paid Price for specific property types in the last three years are:
| Property Type | Average Sold Price | Sold Properties |
|---|---|---|
| Semi Detached House | £230,076.00 | 13 Semi Detached Houses |
| Detached House | £342,553.00 | 28 Detached Houses |
| Terraced House | £146,071.00 | 7 Terraced Houses |
| Flat | £159,000.00 | 1 Flat |

