
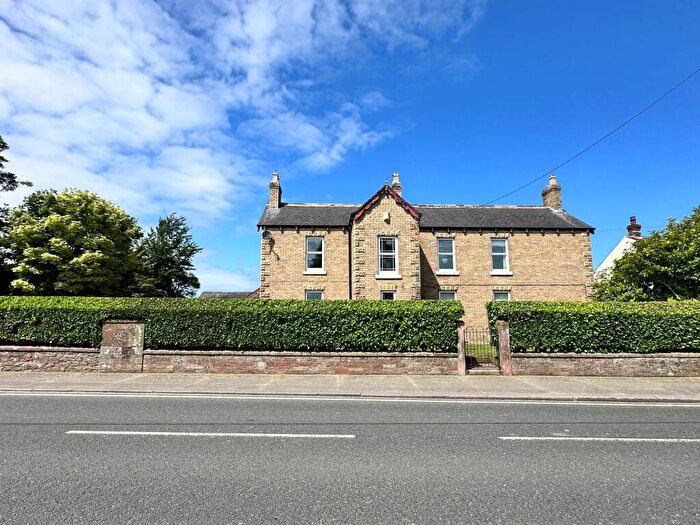
Houses for sale in Marsh, Carlisle
House Prices in Marsh
Properties in Marsh have an average house price of £303k and had 13 Property Transactions within the last 3 years¹.
Marsh is an area in Carlisle, Cumbria with 143 households², where the most expensive property was sold for £415k.
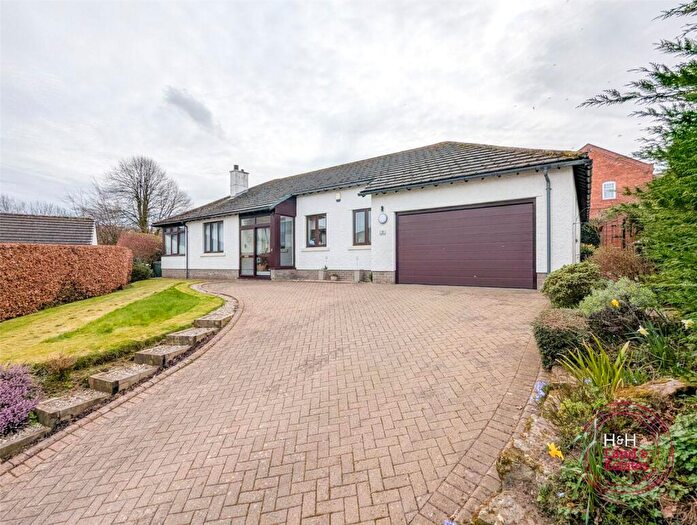
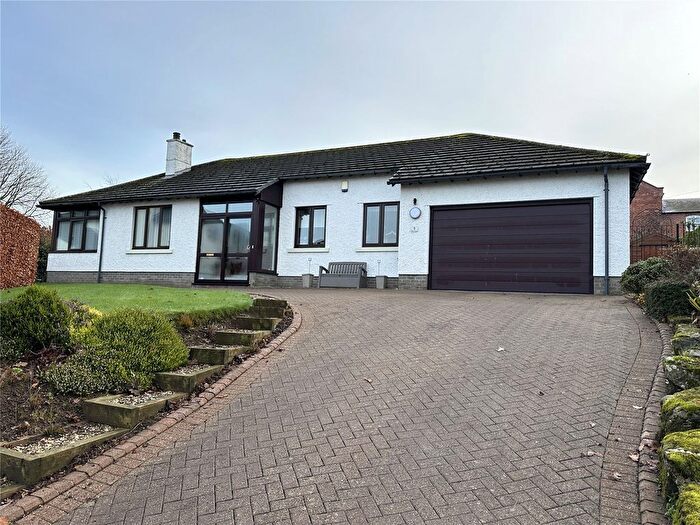
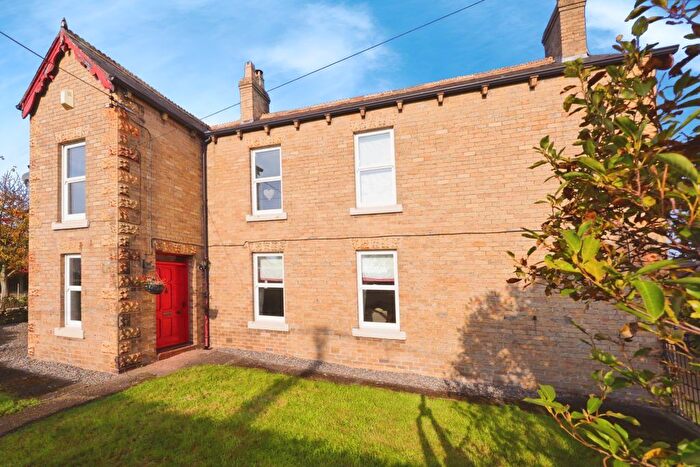
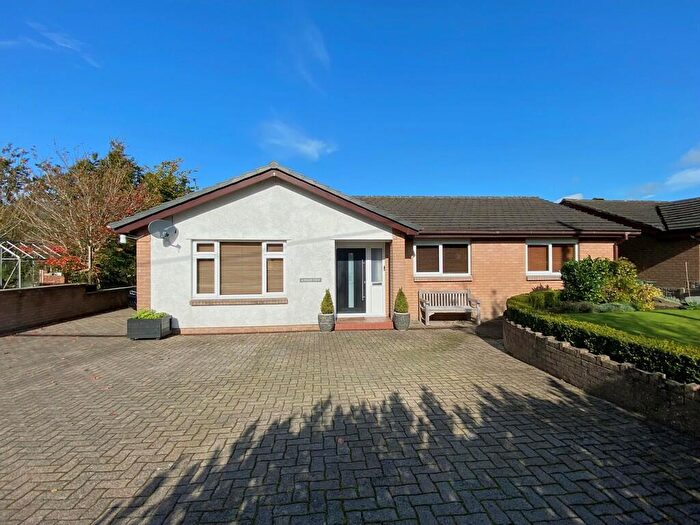
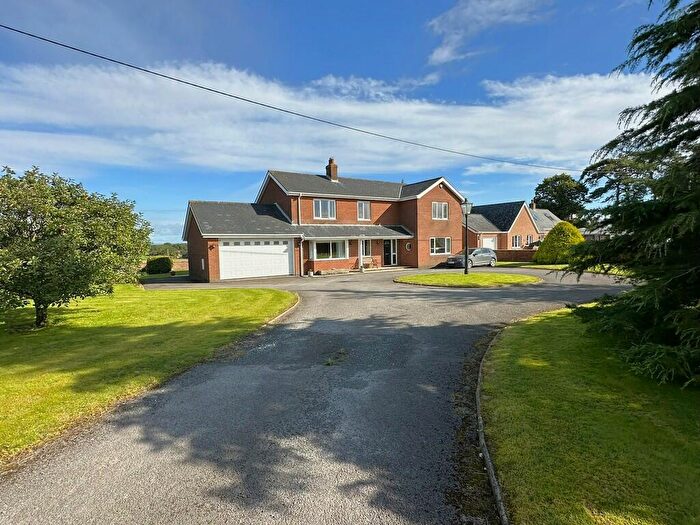
Properties for sale in Marsh
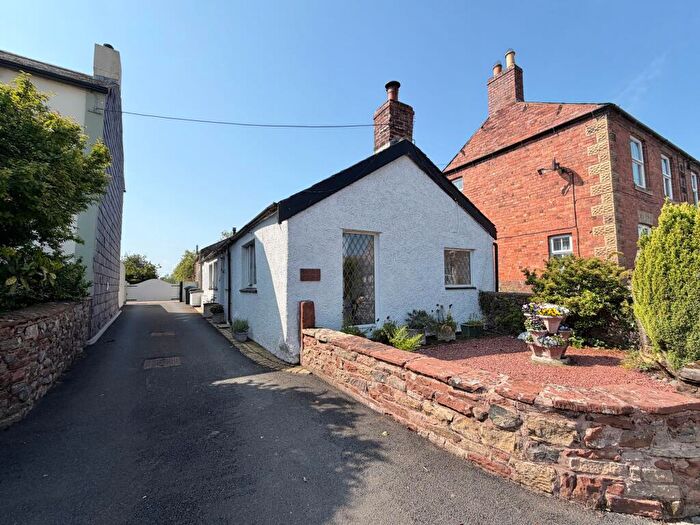
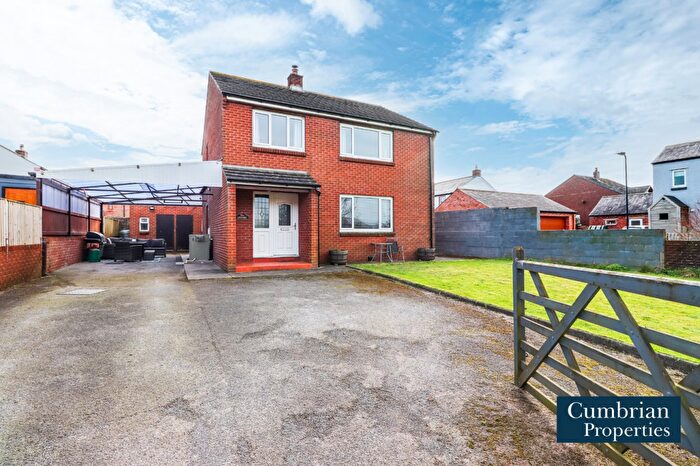
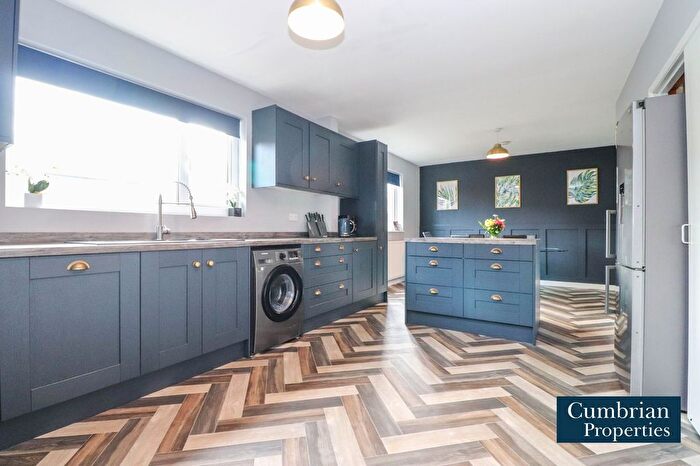
Previously listed properties in Marsh

![]()
If you are looking to sell your house, let it out, or receive a property valuation, an expert can help you.
Click the button below to get started.


Roads and Postcodes in Marsh
Navigate through our locations to find the location of your next house in Marsh, Carlisle for sale or to rent.
| Streets | Postcodes |
|---|---|
| East End | CA5 6HS |
| Oaks Lane | CA5 6HY |
| Solway View | CA5 6HR |
| St Peters Court | CA5 6JN |
| CA5 6HT CA5 6HU CA5 6HX CA5 6JB CA5 6JD CA5 6JE CA5 6JF CA5 6JH CA5 6JQ |
Property price trends in Marsh
According to the latest Land Registry data, the average home in Marsh sold for £299,833 in 2025. That figure comes from 144 sales logged over the past 30 years.
Prices have moved up over the last three years. Compared with 2022, when the typical sale came in around £288,400, that's a rise of roughly 4%.
Looking back five years, average prices are up about 3.3% since 2020, a gain of around £9,583 in cash terms.
Zoom out to the past decade for the fuller picture. Back in 2015, homes here averaged £184,875, so the typical sold price has climbed about 62.2% since then, roughly 5% a year. Stretch the view to fifteen years and that annual pace eases back to about 0.3%.
Frequently asked questions about Marsh
What is the average price for a property for sale in Marsh?
The average price for a property for sale in Marsh is £303,380. This amount is 65% higher than the average price in Carlisle. There are 22 property listings for sale in Marsh.
What streets have the most expensive properties for sale in Marsh?
The street with the most expensive properties for sale in Marsh is Oaks Lane at an average of £415,000.
What streets have the most affordable properties for sale in Marsh?
The street with the most affordable properties for sale in Marsh is Solway View at an average of £277,487.
Which train stations are available in or near Marsh?
Some of the train stations available in or near Marsh are Dalston, Wigton and Carlisle.
Property Price Paid in Marsh by Year
The average sold property price by year was:
| Year | Average Sold Price | Price Change |
Sold Properties
|
|---|---|---|---|
| 2025 | £299,833 | -3% |
6 Properties |
| 2024 | £307,491 | 2% |
6 Properties |
| 2023 | £300,000 | 4% |
1 Property |
| 2022 | £288,400 | 4% |
5 Properties |
| 2021 | £276,333 | -5% |
3 Properties |
| 2020 | £290,250 | 6% |
2 Properties |
| 2019 | £273,000 | 21% |
5 Properties |
| 2018 | £216,750 | -10% |
8 Properties |
| 2017 | £237,916 | 5% |
6 Properties |
| 2016 | £225,625 | 18% |
4 Properties |
Property Price per Property Type in Marsh
Here you can find historic sold price data in order to help with your property search.
The average Property Paid Price for specific property types in the last three years are:
| Property Type | Average Sold Price | Sold Properties |
|---|---|---|
| Semi Detached House | £249,000.00 | 1 Semi Detached House |
| Detached House | £307,912.00 | 12 Detached Houses |
