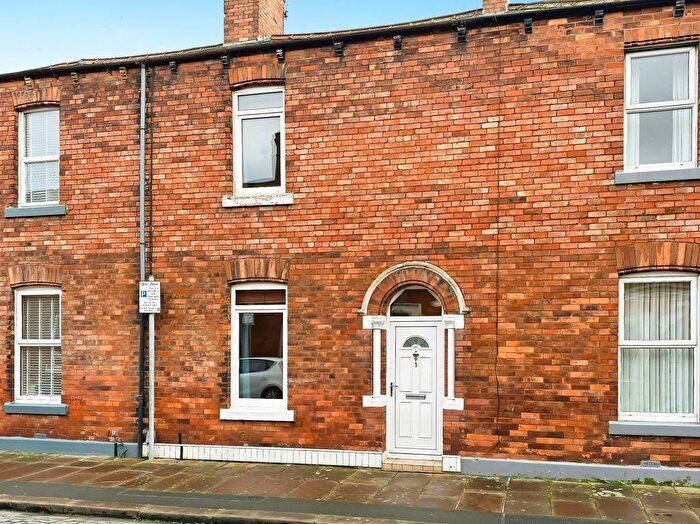
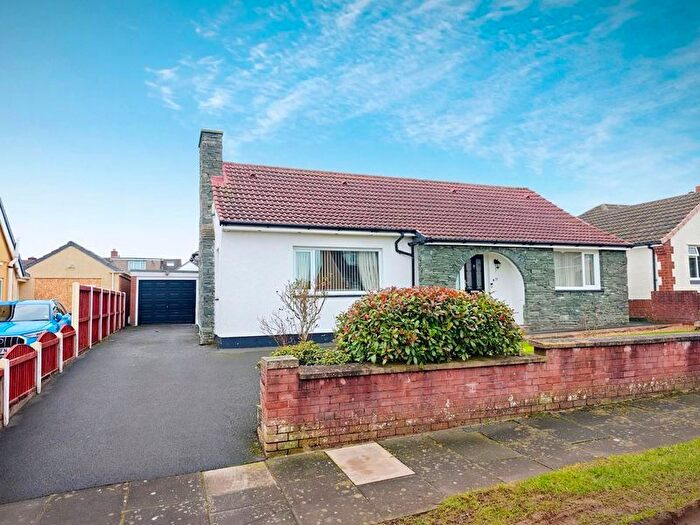
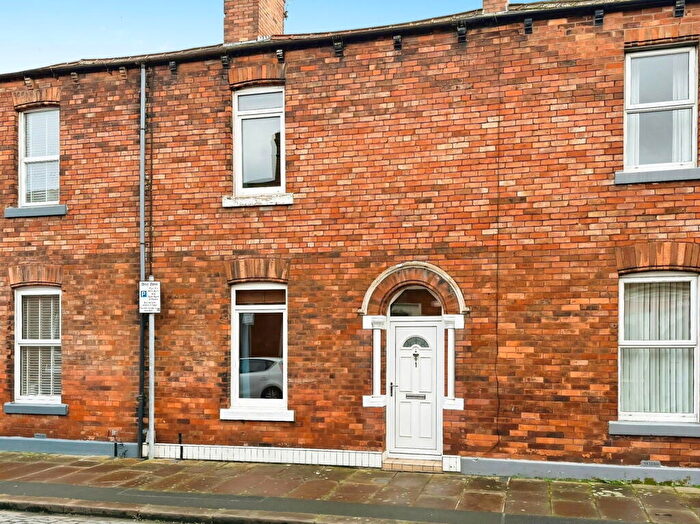
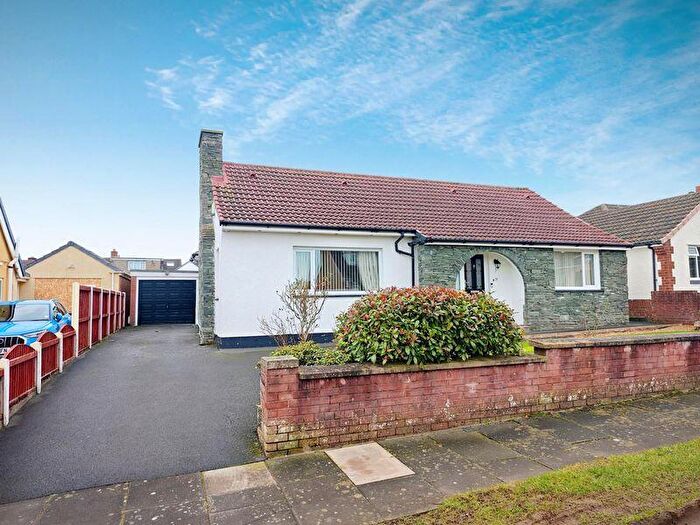
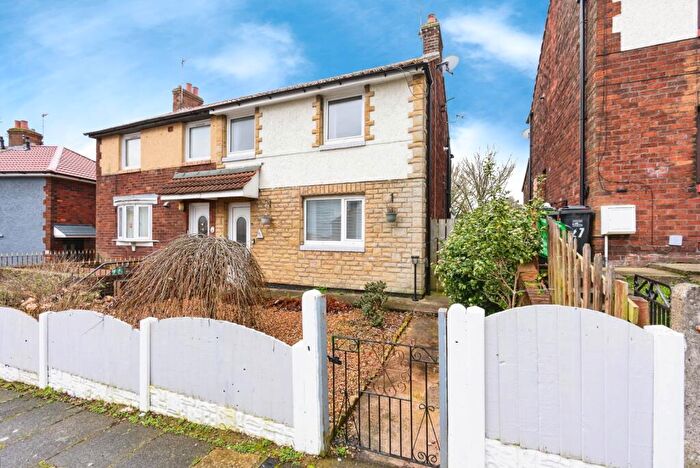
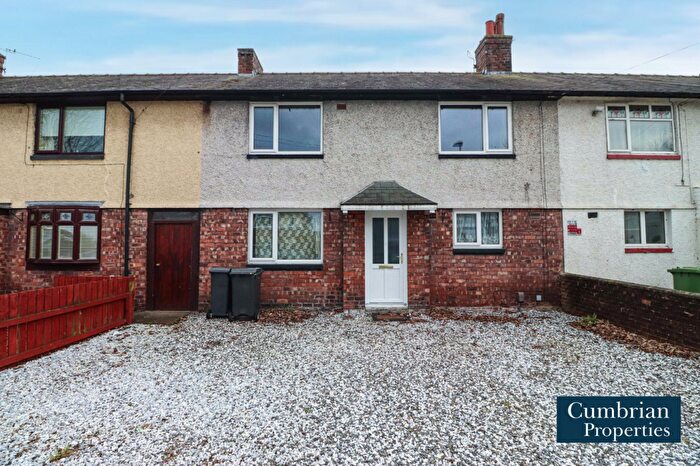
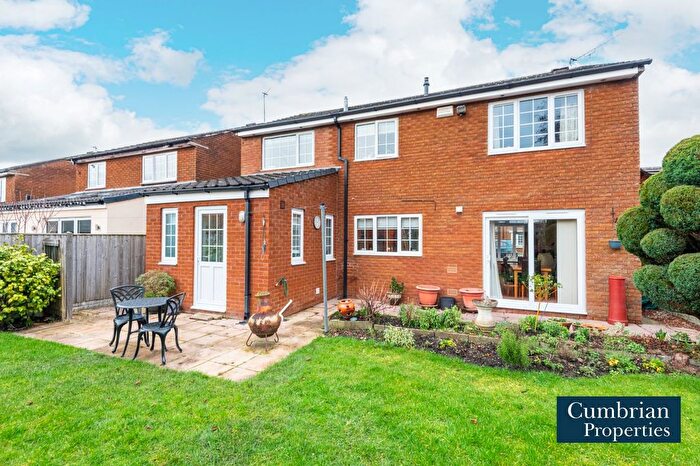
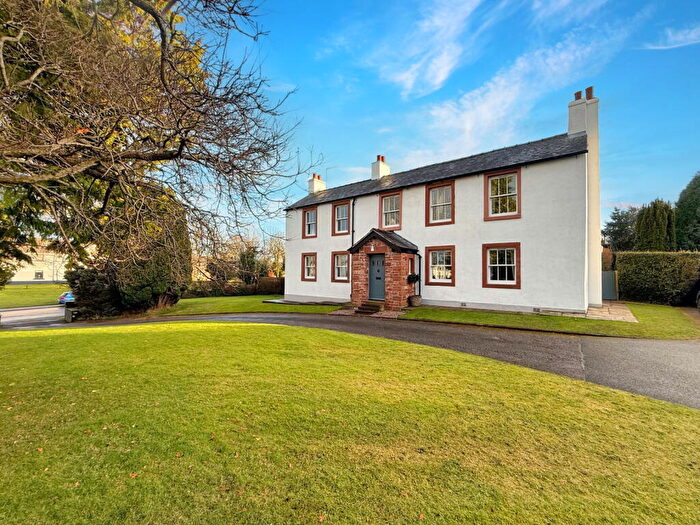
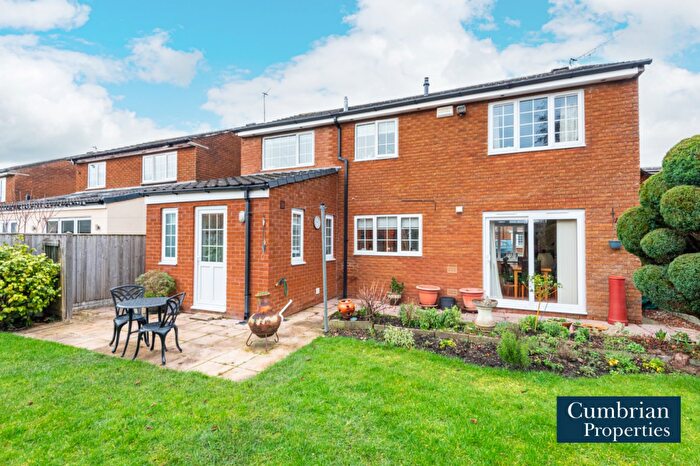
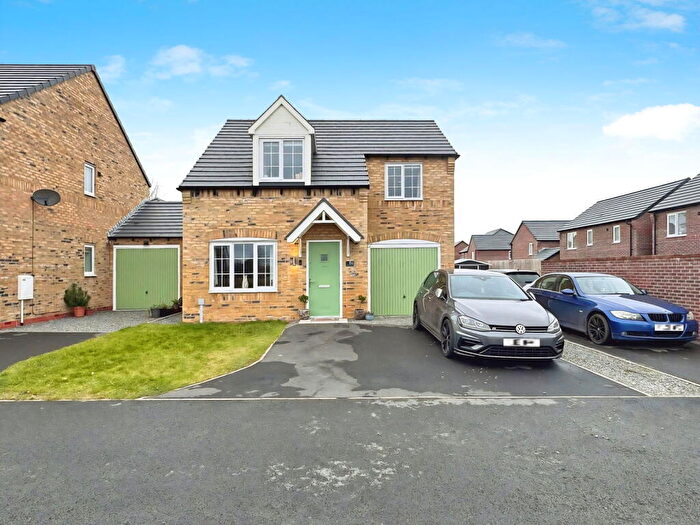
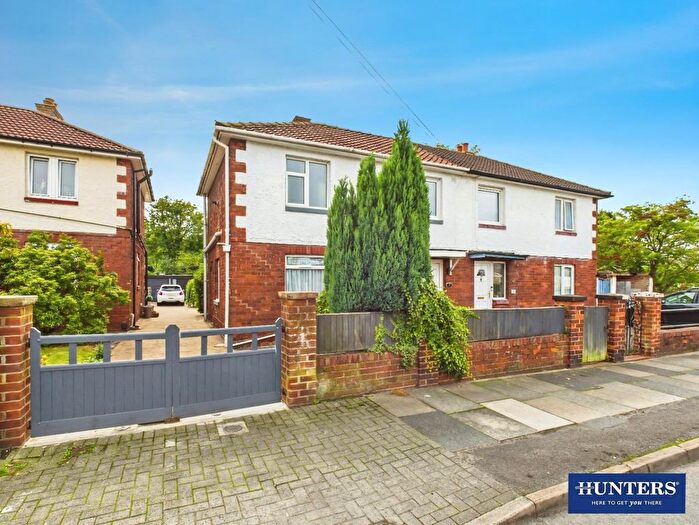
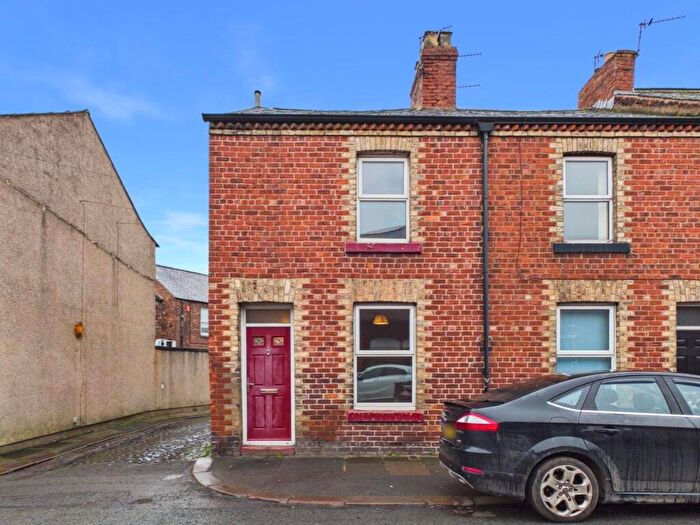
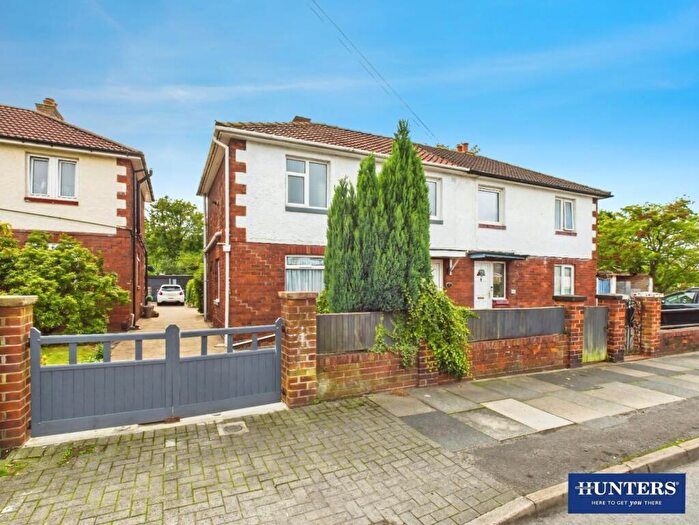
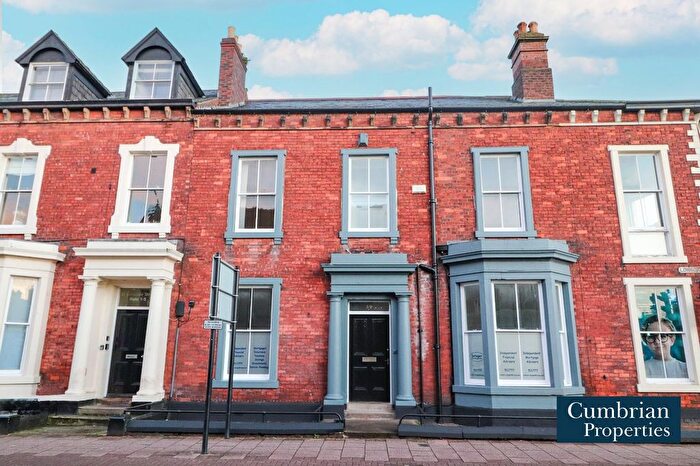
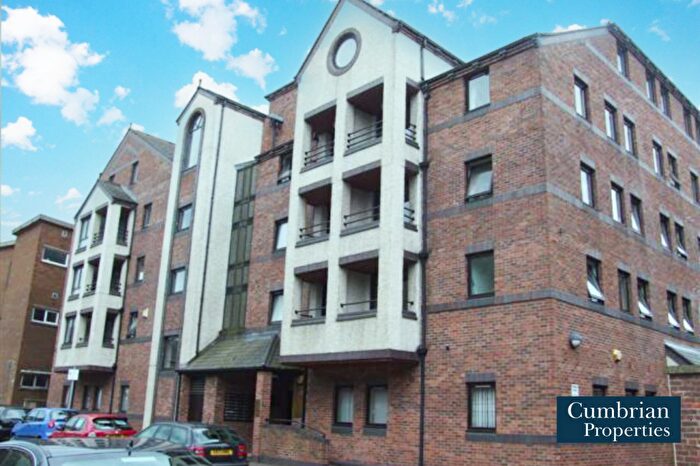
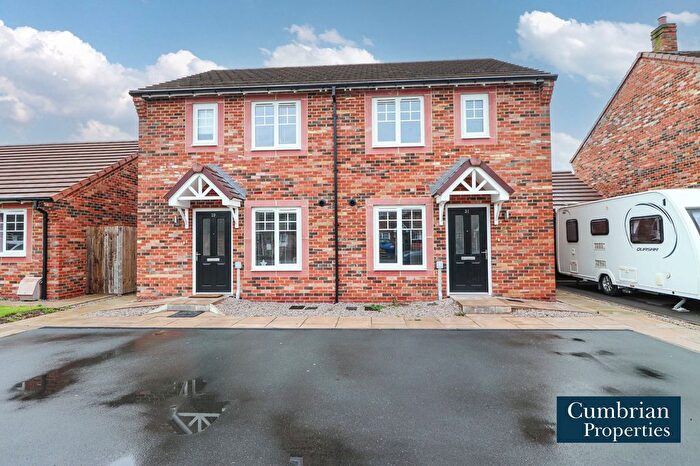
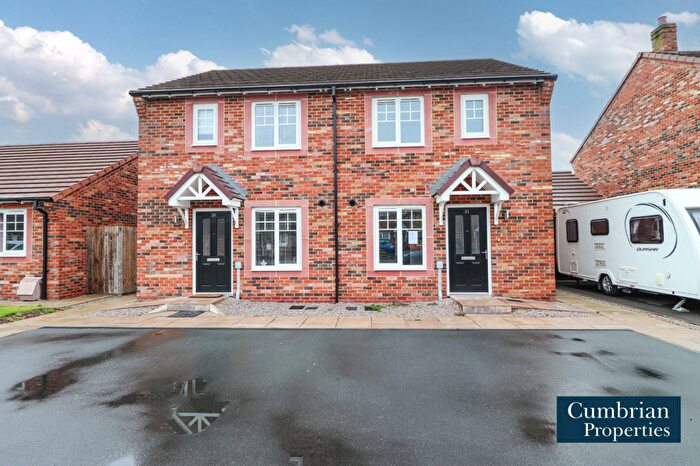
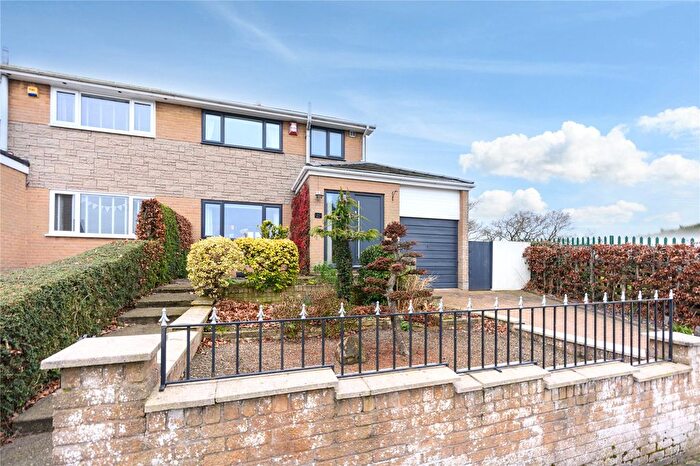
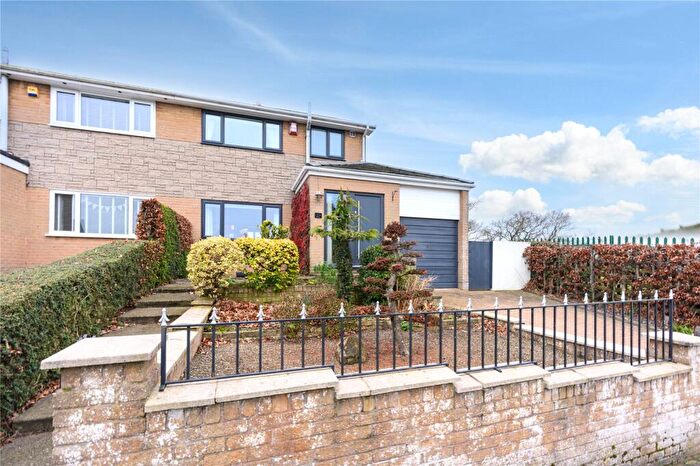
Houses for sale & to rent in Dalston & Burgh, Carlisle
House Prices in Dalston & Burgh
Properties in Dalston & Burgh have an average house price of £261,361.00 and had 82 Property Transactions within the last 3 years¹.
Dalston & Burgh is an area in Carlisle, Cumbria with 159 households², where the most expensive property was sold for £751,000.00.
Properties for sale in Dalston & Burgh
Roads and Postcodes in Dalston & Burgh
Navigate through our locations to find the location of your next house in Dalston & Burgh, Carlisle for sale or to rent.
| Streets | Postcodes |
|---|---|
| Apple Tree Close | CA2 4TQ CA5 7LQ |
| Ascot Way | CA2 4NB |
| Barras Lane | CA5 7LX CA5 7ND CA5 7NY |
| Bishops Way | CA5 7LF |
| Buebank Road | CA5 7RD |
| Burgh Road | CA2 7RF |
| Carleton Road | CA1 3DN |
| Carlisle Road | CA5 7JS CA5 7NJ |
| Chepstow Close | CA2 4QT |
| Church Lane | CA5 7PL |
| Croftlands Close | CA5 6BY |
| Cumdivock | CA5 7JN |
| Durdar Road | CA2 4TS |
| Epsom Way | CA2 4RX |
| Gaitsgill | CA5 7AW |
| Goodwood Drive | CA2 4QW |
| Green Lane | CA5 7QE |
| Greensyke Close | CA5 7JT |
| Greensyke Court | CA5 7JY |
| Hamilton Drive | CA2 4QS |
| Harrison Gardens | CA5 6DF |
| Haydock Drive | CA2 4QY |
| Hillcroft | CA5 6HW |
| Huntingdon Lane | CA2 4QZ |
| Inglewood Drive | CA5 7LZ |
| Kempton Drive | CA2 4DQ |
| King Edwards Fauld | CA5 6AR |
| Laripots Close | CA5 7LG |
| Leslie Gardens | CA2 4TZ |
| Lingeyclose | CA5 7JZ |
| Lingfield Close | CA2 4SR |
| Low Moorlands | CA5 7NU |
| Lowry Street | CA2 4SN |
| Marsh Terrace | CA5 6BA |
| Marsh View | CA5 6AD |
| Moorclose | CA5 6NH |
| Moorhouse Road | CA2 7RJ |
| Newbury Way | CA2 4QN |
| North Park Cottages | CA4 0RA |
| North View | CA5 6AB |
| Orchard Way | CA5 7LY |
| Orton Grange | CA5 6JZ |
| Prior Rigg Lane | CA2 7RG |
| Ripon Close | CA2 4RP |
| Sandsfield Lane | CA2 7AE |
| Sceughmire | CA5 6JT |
| Sedgefield Lane | CA2 4ET |
| Southwell Square | CA2 4TD |
| St Marys Court | CA4 0RG |
| Station Road | CA5 7JB |
| Stoneraise | CA5 7AX |
| The Square | CA5 7LW |
| Townhead Road | CA5 7QS |
| West Winds | CA5 6BP |
| White Cottages | CA1 3EA |
| Woodhouses | CA5 6LN |
| CA1 3DY CA2 4SE CA2 4SW CA2 4UN CA2 6BH CA2 6BT CA2 6BU CA2 7RH CA4 0AB CA4 0AD CA4 0AE CA4 0AH CA4 0AN CA4 0PS CA4 0RB CA4 0RE CA4 0RH CA4 0RR CA5 6BN CA5 6DY CA5 6EA CA5 6EG CA5 6EH CA5 6EN CA5 6EZ CA5 6HB CA5 6LE CA5 6LG CA5 6LR CA5 6NF CA5 7AE CA5 7AU CA5 7AZ CA5 7BY CA5 7DA CA5 7NH CA5 7NN CA5 7QF CA5 7QJ |
Transport near Dalston & Burgh
- FAQ
- Price Paid By Year
- Property Type Price
Frequently asked questions about Dalston & Burgh
What is the average price for a property for sale in Dalston & Burgh?
The average price for a property for sale in Dalston & Burgh is £261,361. This amount is 43% higher than the average price in Carlisle. There are 8,467 property listings for sale in Dalston & Burgh.
What streets have the most expensive properties for sale in Dalston & Burgh?
The streets with the most expensive properties for sale in Dalston & Burgh are St Marys Court at an average of £380,000, Hillcroft at an average of £346,666 and Ascot Way at an average of £337,500.
What streets have the most affordable properties for sale in Dalston & Burgh?
The streets with the most affordable properties for sale in Dalston & Burgh are Chepstow Close at an average of £115,500, North Park Cottages at an average of £115,500 and Sedgefield Lane at an average of £140,000.
Which train stations are available in or near Dalston & Burgh?
Some of the train stations available in or near Dalston & Burgh are Dalston, Carlisle and Wetheral.
Property Price Paid in Dalston & Burgh by Year
The average sold property price by year was:
| Year | Average Sold Price | Price Change |
Sold Properties
|
|---|---|---|---|
| 2025 | £237,928 | -20% |
28 Properties |
| 2024 | £284,410 | 7% |
23 Properties |
| 2023 | £265,425 | 3% |
31 Properties |
| 2022 | £256,858 | 10% |
24 Properties |
| 2021 | £231,256 | -2% |
46 Properties |
| 2020 | £235,601 | 12% |
58 Properties |
| 2019 | £206,249 | 1% |
64 Properties |
| 2018 | £204,715 | 0,2% |
75 Properties |
| 2017 | £204,211 | -3% |
63 Properties |
| 2016 | £211,197 | -10% |
102 Properties |
| 2015 | £231,417 | 11% |
93 Properties |
| 2014 | £205,423 | 43% |
18 Properties |
| 2008 | £117,000 | -968% |
1 Property |
| 2007 | £1,250,000 | 91% |
1 Property |
| 2006 | £115,000 | -48% |
1 Property |
| 2003 | £169,819 | -7% |
3 Properties |
| 2001 | £181,000 | - |
2 Properties |
Property Price per Property Type in Dalston & Burgh
Here you can find historic sold price data in order to help with your property search.
The average Property Paid Price for specific property types in the last three years are:
| Property Type | Average Sold Price | Sold Properties |
|---|---|---|
| Semi Detached House | £225,222.00 | 27 Semi Detached Houses |
| Detached House | £368,248.00 | 28 Detached Houses |
| Terraced House | £210,142.00 | 19 Terraced Houses |
| Flat | £130,875.00 | 8 Flats |

