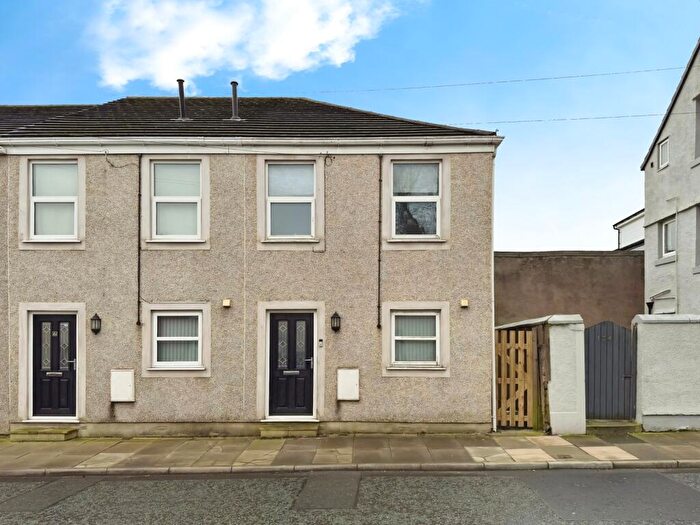
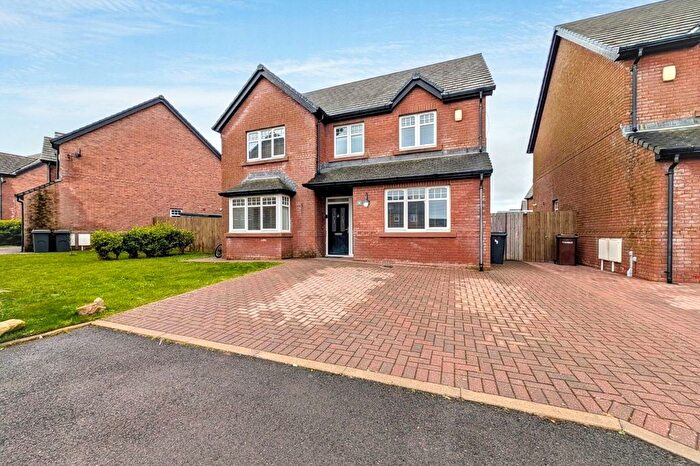
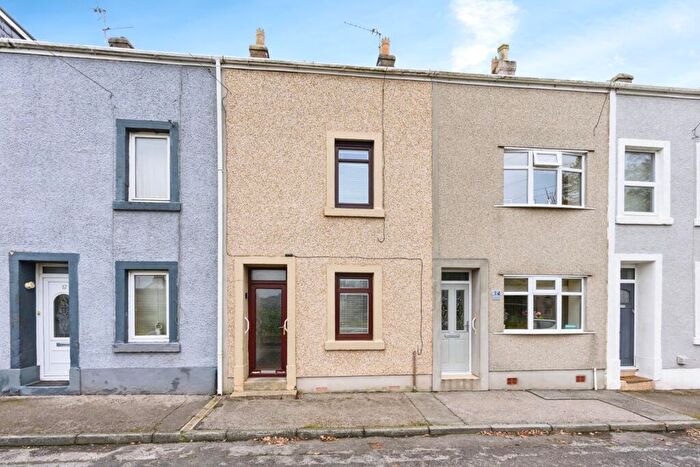
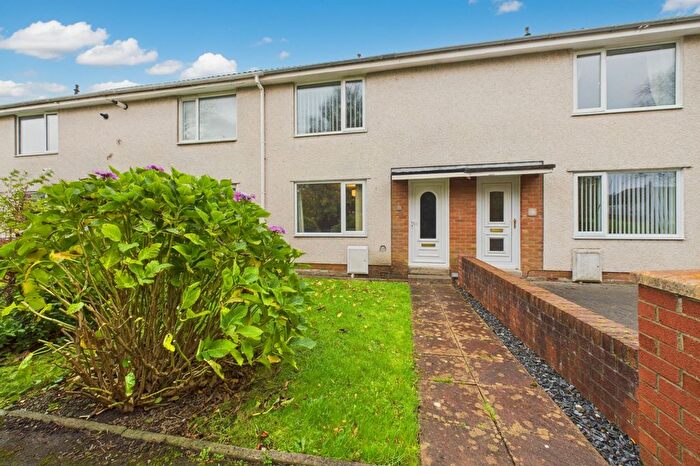
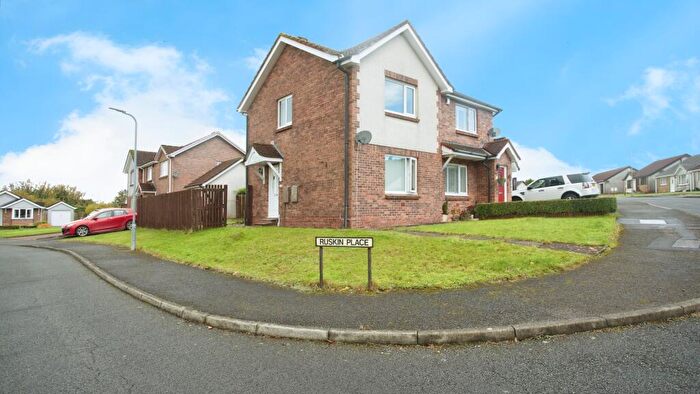
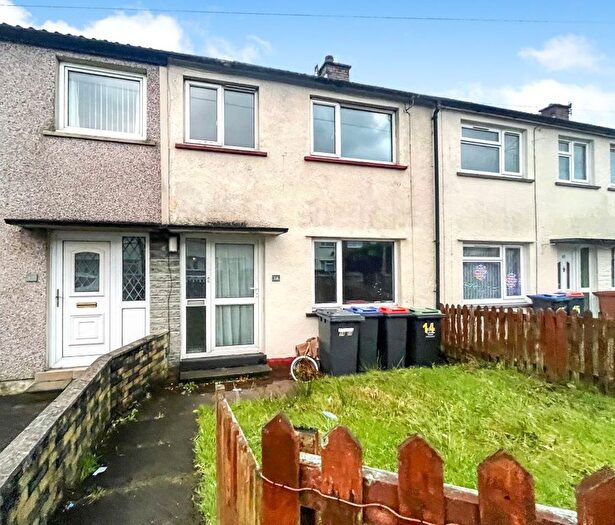
Houses for sale & to rent in Cleator Moor North, Cleator Moor
House Prices in Cleator Moor North
Properties in Cleator Moor North have an average house price of £131,837.00 and had 129 Property Transactions within the last 3 years¹.
Cleator Moor North is an area in Cleator Moor, Cumbria with 1,658 households², where the most expensive property was sold for £439,995.00.
Properties for sale in Cleator Moor North
Previously listed properties in Cleator Moor North
Roads and Postcodes in Cleator Moor North
Navigate through our locations to find the location of your next house in Cleator Moor North, Cleator Moor for sale or to rent.
| Streets | Postcodes |
|---|---|
| Aldby Grove | CA25 5DY |
| Aldby Lane | CA25 5DH |
| Aldby Street | CA25 5AQ |
| Birks Road | CA25 5HP CA25 5HR CA25 5HS CA25 5HT CA25 5HU |
| Border Avenue | CA25 5JQ |
| Bowthorn Road | CA25 5JF CA25 5JG CA25 5JT CA25 5JU |
| Brantwood Lane | CA25 5QG |
| Coniston Park | CA25 5QF |
| Cross North Street | CA25 5AF |
| Crossfield Road | CA25 5BU CA25 5BY CA25 5DB |
| Crossings Close | CA25 5QH |
| Crowgarth Close | CA25 5AZ |
| Daniels Close | CA25 5BE |
| Dawson Street | CA25 5HY |
| Dent Place | CA25 5EE CA25 5EF |
| Duke Street | CA25 5BG |
| Ehen Place | CA25 5ED |
| Ehen Road | CA25 5EA CA25 5EB |
| Eleanors Way | CA25 5DQ |
| Ennerdale Road | CA25 5LD CA25 5LE CA25 5LJ CA25 5LS |
| Eskdale Close | CA25 5JW |
| Fir Garth | CA25 5HB |
| Frizington Road | CA25 5EP CA25 5EZ |
| Furnace Court | CA25 5BX |
| Greystone Avenue | CA25 5ER |
| Greystone Place | CA25 5ES CA25 5ET |
| Greystone Terrace | CA25 5EW |
| Grizedale Close | CA25 5PY |
| Heathcote Park | CA25 5HL |
| Henry Street | CA25 5HX |
| High Street | CA25 5AH CA25 5BL CA25 5BN CA25 5BW CA25 5LB |
| Hope Pit Cottages | CA25 5ST |
| Hopedene | CA25 5RU CA25 5RX |
| Jacktrees Road | CA25 5AY CA25 5BD |
| James Street | CA25 5HZ |
| John Colligan Drive | CA25 5JX |
| John Colligan Walk | CA25 5JY |
| Keekle Mews | CA25 5RJ |
| Keir Hardie Avenue | CA25 5EH CA25 5EJ CA25 5EL CA25 5EQ |
| Layfield Lane | CA25 5HN |
| Leconfield Street | CA25 5BT CA25 5QA CA25 5QQ |
| Litt Place | CA25 5NG |
| Little Croft | CA25 5AG |
| Mark Thompson Close | CA25 5JB |
| Mill Hill | CA25 5SB CA25 5SD CA25 5SE CA25 5SJ CA25 5SL CA25 5SN CA25 5SP CA25 5SQ CA25 5SR CA25 5SW |
| Norbeck Park | CA25 5RL |
| Oakdene | CA25 5NH |
| Orchard Place | CA25 5DT |
| Queen Street | CA25 5BH |
| Red Beck Park | CA25 5EU CA25 5EX CA25 5EY |
| Robert Owen Avenue | CA25 5DJ CA25 5DN |
| Robert Owen Place | CA25 5DW |
| Ruskin Place | CA25 5QD |
| Sanderson Park | CA25 5JZ |
| Snowdon Avenue | CA25 5JN |
| St Johns Close | CA25 5DD |
| The Crescent | CA25 5QJ CA25 5QL |
| The Hawthorns | CA25 5RS CA25 5RT |
| Threaplands | CA25 5HA |
| Thwaite Close | CA25 5RP |
| Wastwater Close | CA25 5JP |
| Weddicar Gardens | CA25 5JH CA25 5JJ |
| Wheatley Terrace | CA25 5NE |
| Whinney Hill | CA25 5QR |
| Whitehaven Road | CA25 5QN CA25 5QP CA25 5QW |
| William Morris Avenue | CA25 5DR CA25 5DS |
| Wyndham Street | CA25 5AN |
Transport near Cleator Moor North
- FAQ
- Price Paid By Year
- Property Type Price
Frequently asked questions about Cleator Moor North
What is the average price for a property for sale in Cleator Moor North?
The average price for a property for sale in Cleator Moor North is £131,837. This amount is 13% lower than the average price in Cleator Moor. There are 396 property listings for sale in Cleator Moor North.
What streets have the most expensive properties for sale in Cleator Moor North?
The streets with the most expensive properties for sale in Cleator Moor North are Crossfield Road at an average of £326,873, Layfield Lane at an average of £325,000 and Greystone Terrace at an average of £240,000.
What streets have the most affordable properties for sale in Cleator Moor North?
The streets with the most affordable properties for sale in Cleator Moor North are Duke Street at an average of £48,500, Queen Street at an average of £57,250 and The Hawthorns at an average of £66,000.
Which train stations are available in or near Cleator Moor North?
Some of the train stations available in or near Cleator Moor North are Corkickle, Whitehaven and St.Bees.
Property Price Paid in Cleator Moor North by Year
The average sold property price by year was:
| Year | Average Sold Price | Price Change |
Sold Properties
|
|---|---|---|---|
| 2025 | £133,270 | 13% |
37 Properties |
| 2024 | £116,436 | -21% |
36 Properties |
| 2023 | £140,790 | 13% |
56 Properties |
| 2022 | £122,396 | -2% |
63 Properties |
| 2021 | £124,493 | 8% |
87 Properties |
| 2020 | £114,043 | 3% |
54 Properties |
| 2019 | £110,241 | -10% |
62 Properties |
| 2018 | £121,788 | 7% |
47 Properties |
| 2017 | £112,776 | -0,1% |
36 Properties |
| 2016 | £112,916 | -5% |
59 Properties |
| 2015 | £118,627 | 1% |
57 Properties |
| 2014 | £117,481 | 5% |
68 Properties |
| 2013 | £111,472 | 14% |
40 Properties |
| 2012 | £96,394 | -2% |
35 Properties |
| 2011 | £98,576 | -12% |
47 Properties |
| 2010 | £110,431 | 1% |
37 Properties |
| 2009 | £109,696 | -6% |
38 Properties |
| 2008 | £115,930 | 13% |
46 Properties |
| 2007 | £101,288 | 4% |
76 Properties |
| 2006 | £96,764 | 26% |
105 Properties |
| 2005 | £72,049 | -16% |
64 Properties |
| 2004 | £83,761 | 36% |
80 Properties |
| 2003 | £53,474 | 13% |
113 Properties |
| 2002 | £46,501 | 5% |
94 Properties |
| 2001 | £44,152 | -7% |
78 Properties |
| 2000 | £47,025 | -5% |
58 Properties |
| 1999 | £49,319 | 15% |
72 Properties |
| 1998 | £41,981 | -23% |
53 Properties |
| 1997 | £51,713 | 21% |
47 Properties |
| 1996 | £40,900 | 3% |
45 Properties |
| 1995 | £39,707 | - |
50 Properties |
Property Price per Property Type in Cleator Moor North
Here you can find historic sold price data in order to help with your property search.
The average Property Paid Price for specific property types in the last three years are:
| Property Type | Average Sold Price | Sold Properties |
|---|---|---|
| Semi Detached House | £174,747.00 | 22 Semi Detached Houses |
| Detached House | £225,534.00 | 29 Detached Houses |
| Terraced House | £84,117.00 | 77 Terraced Houses |
| Flat | £145,000.00 | 1 Flat |

