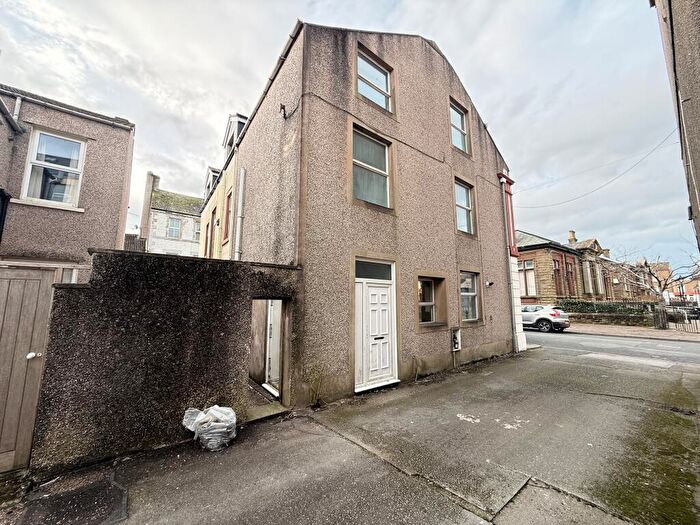
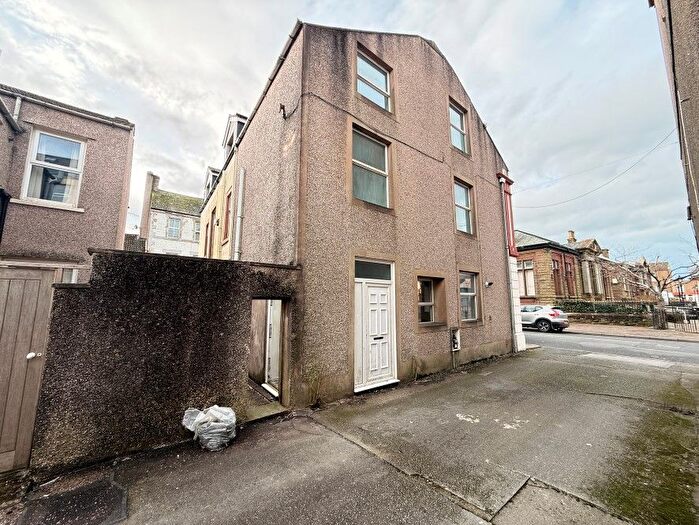
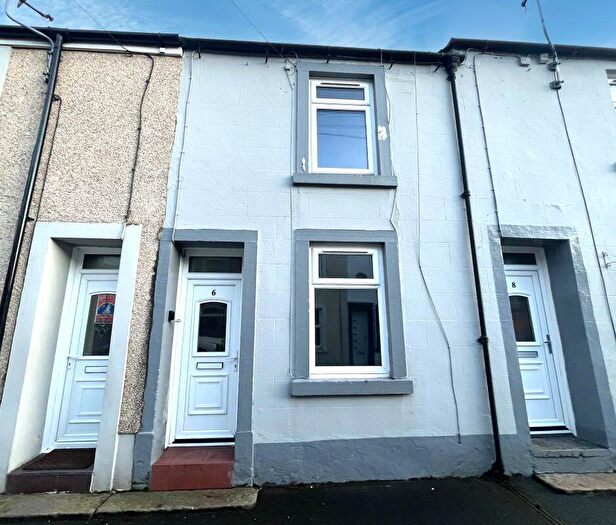
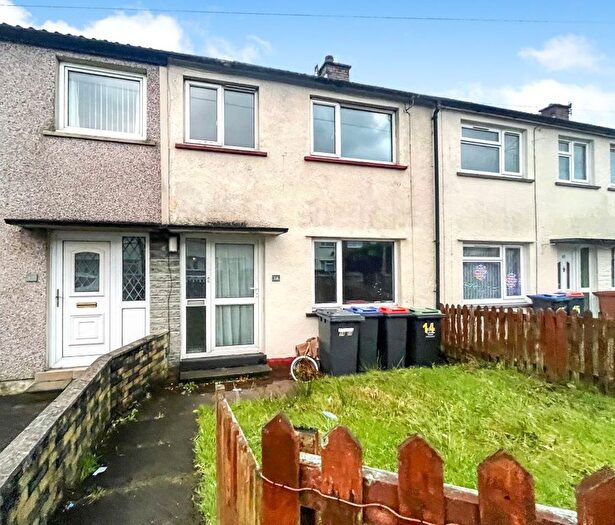
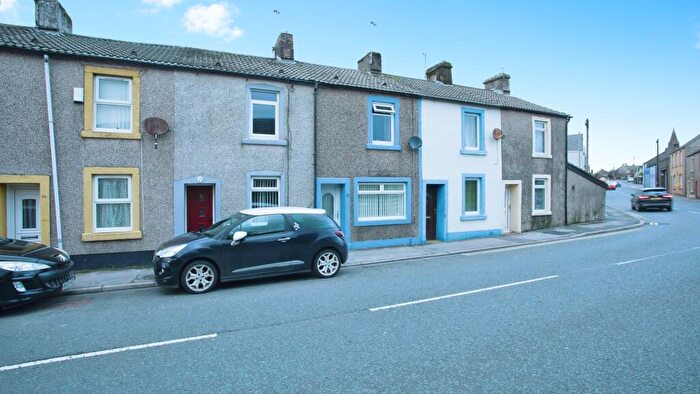
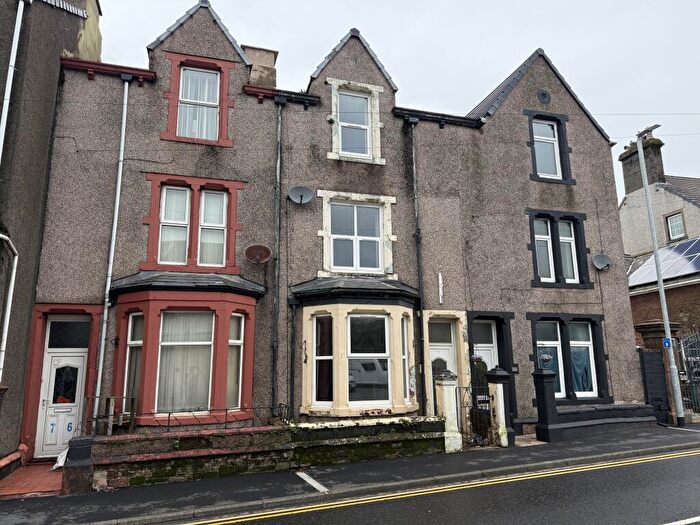
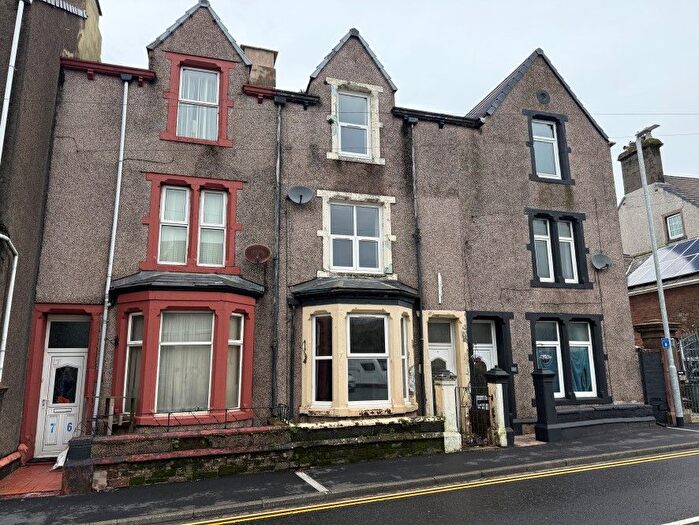
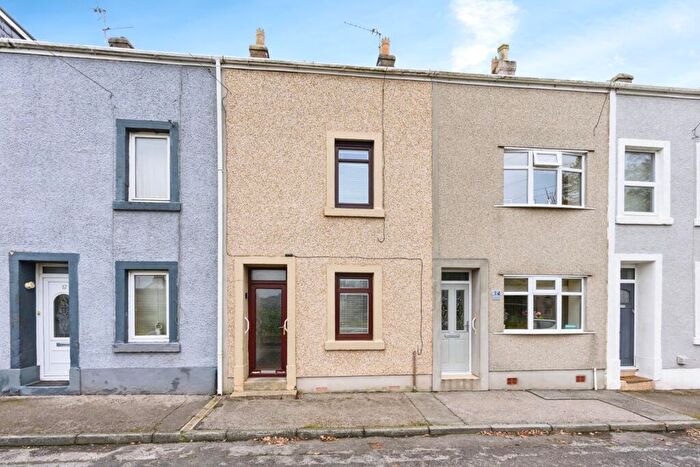
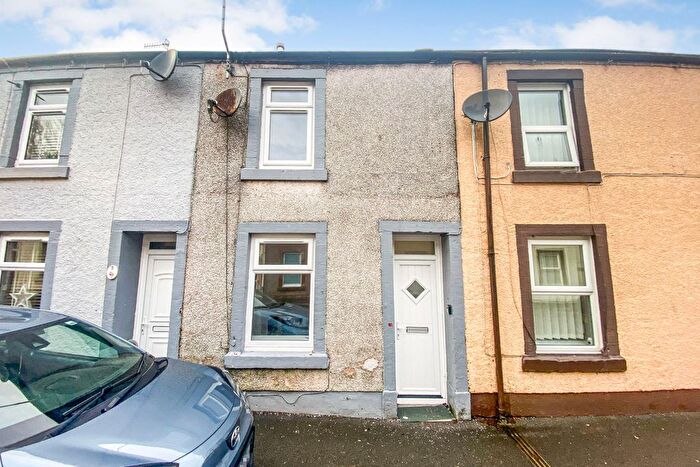
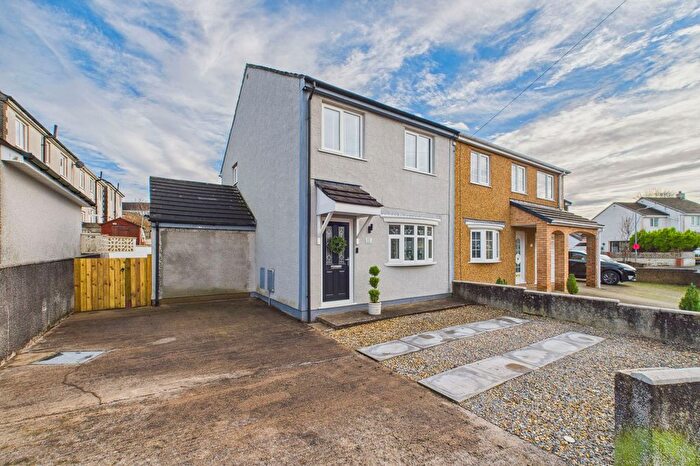
Houses for sale & to rent in Cleator Moor South, Cleator Moor
House Prices in Cleator Moor South
Properties in Cleator Moor South have an average house price of £99,199.00 and had 42 Property Transactions within the last 3 years¹.
Cleator Moor South is an area in Cleator Moor, Cumbria with 682 households², where the most expensive property was sold for £225,000.00.
Properties for sale in Cleator Moor South
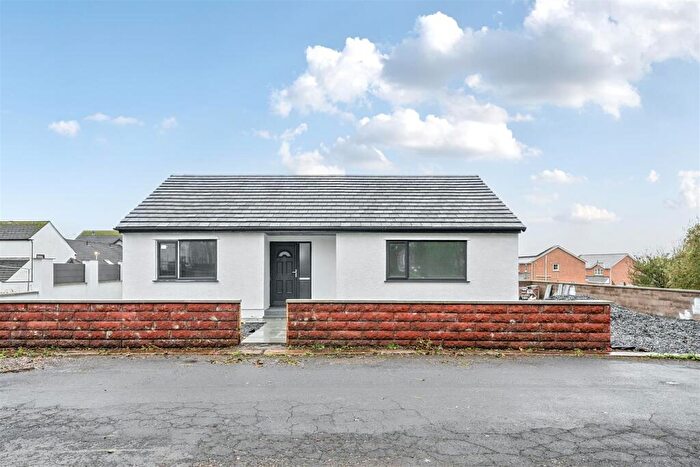
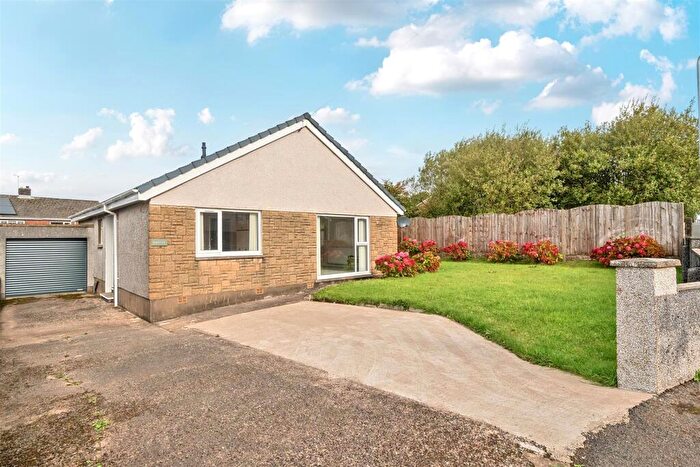
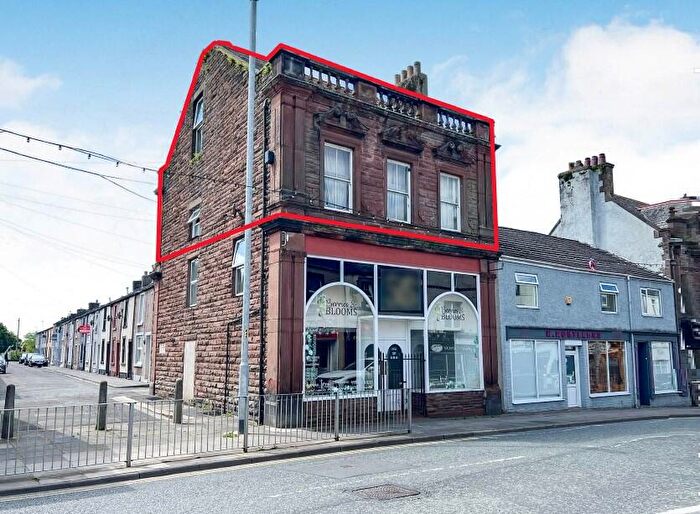
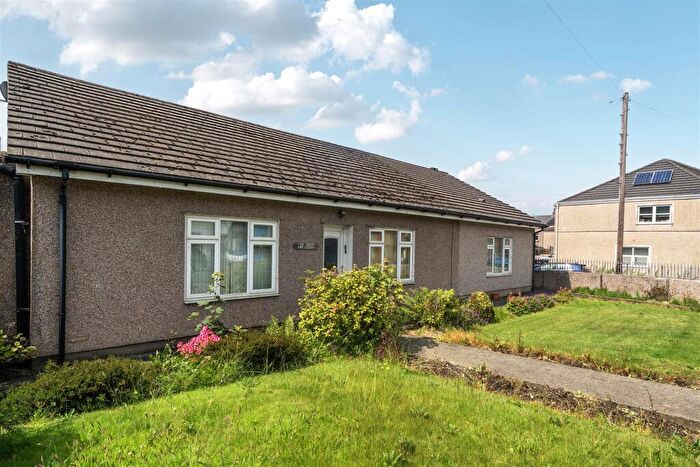
Previously listed properties in Cleator Moor South
Roads and Postcodes in Cleator Moor South
Navigate through our locations to find the location of your next house in Cleator Moor South, Cleator Moor for sale or to rent.
| Streets | Postcodes |
|---|---|
| Brierley Road | CA25 5PJ |
| Buckle Avenue | CA25 5NZ |
| Calder Crescent | CA25 5NR |
| Clayton Avenue | CA25 5PB CA25 5PE CA25 5PF CA25 5PG |
| Cragg Road | CA25 5PP CA25 5PR CA25 5PS |
| Earl Street | CA25 5AU |
| Ennerdale Road | CA25 5LF CA25 5LG CA25 5LN CA25 5LP CA25 5LQ CA25 5LR |
| Fletcher Street | CA25 5NF |
| Greenthwaite | CA25 5NP |
| High Street | CA25 5LA |
| Highfield Road | CA25 5NT |
| Holden Place | CA25 5NY |
| Jacktrees Crescent | CA25 5PA |
| Jacktrees Road | CA25 5BA CA25 5BB |
| Kinniside Place | CA25 5LX |
| Longbarrow | CA25 5NW |
| Market Square | CA25 5AR |
| Melbreak Avenue | CA25 5NU CA25 5NX |
| Montreal Avenue | CA25 5NJ CA25 5NL |
| Montreal Close | CA25 5NN |
| Priory Drive | CA25 5NA CA25 5ND |
| Sea View Place | CA25 5LZ |
| Thornfield Close | CA25 5NS |
| Todholes Road | CA25 5LU CA25 5PN |
| Victoria Street | CA25 5AS |
| Victoria Villas | CA25 5PW |
Transport near Cleator Moor South
- FAQ
- Price Paid By Year
- Property Type Price
Frequently asked questions about Cleator Moor South
What is the average price for a property for sale in Cleator Moor South?
The average price for a property for sale in Cleator Moor South is £99,199. This amount is 35% lower than the average price in Cleator Moor. There are 433 property listings for sale in Cleator Moor South.
What streets have the most expensive properties for sale in Cleator Moor South?
The streets with the most expensive properties for sale in Cleator Moor South are Jacktrees Road at an average of £144,500, Thornfield Close at an average of £123,000 and Montreal Avenue at an average of £120,873.
What streets have the most affordable properties for sale in Cleator Moor South?
The streets with the most affordable properties for sale in Cleator Moor South are Sea View Place at an average of £53,333, Longbarrow at an average of £70,500 and Todholes Road at an average of £73,333.
Which train stations are available in or near Cleator Moor South?
Some of the train stations available in or near Cleator Moor South are Corkickle, St.Bees and Whitehaven.
Property Price Paid in Cleator Moor South by Year
The average sold property price by year was:
| Year | Average Sold Price | Price Change |
Sold Properties
|
|---|---|---|---|
| 2025 | £107,909 | 11% |
11 Properties |
| 2024 | £96,160 | 0,1% |
15 Properties |
| 2023 | £96,062 | 16% |
16 Properties |
| 2022 | £81,005 | 3% |
19 Properties |
| 2021 | £78,464 | 10% |
14 Properties |
| 2020 | £70,609 | - |
20 Properties |
| 2019 | £70,639 | 49% |
14 Properties |
| 2018 | £36,000 | -128% |
1 Property |
| 2017 | £81,906 | 19% |
16 Properties |
| 2016 | £66,742 | 9% |
14 Properties |
| 2015 | £60,857 | 6% |
14 Properties |
| 2014 | £57,225 | -50% |
10 Properties |
| 2013 | £85,817 | 24% |
11 Properties |
| 2012 | £65,388 | -25% |
9 Properties |
| 2011 | £81,993 | 17% |
8 Properties |
| 2010 | £68,062 | 16% |
8 Properties |
| 2009 | £57,500 | -56% |
5 Properties |
| 2008 | £89,772 | -1% |
11 Properties |
| 2007 | £90,859 | 20% |
22 Properties |
| 2006 | £72,321 | 22% |
14 Properties |
| 2005 | £56,363 | 7% |
15 Properties |
| 2004 | £52,183 | 21% |
18 Properties |
| 2003 | £41,169 | 27% |
23 Properties |
| 2002 | £30,030 | 4% |
15 Properties |
| 2001 | £28,918 | -31% |
12 Properties |
| 2000 | £37,938 | 38% |
9 Properties |
| 1999 | £23,604 | -24% |
12 Properties |
| 1998 | £29,216 | 4% |
9 Properties |
| 1997 | £27,992 | 38% |
7 Properties |
| 1996 | £17,250 | -70% |
3 Properties |
| 1995 | £29,375 | - |
9 Properties |
Property Price per Property Type in Cleator Moor South
Here you can find historic sold price data in order to help with your property search.
The average Property Paid Price for specific property types in the last three years are:
| Property Type | Average Sold Price | Sold Properties |
|---|---|---|
| Semi Detached House | £111,090.00 | 16 Semi Detached Houses |
| Detached House | £225,000.00 | 1 Detached House |
| Terraced House | £86,557.00 | 25 Terraced Houses |

