
Houses for sale in Cleator Moor, Cleator
House Prices in Cleator Moor
Properties in Cleator Moor have an average house price of £415k and had 1 Property Transaction within the last 3 years¹.
Cleator Moor is an area in Cleator, Cumbria with 19 households², where the most expensive property was sold for £415k.
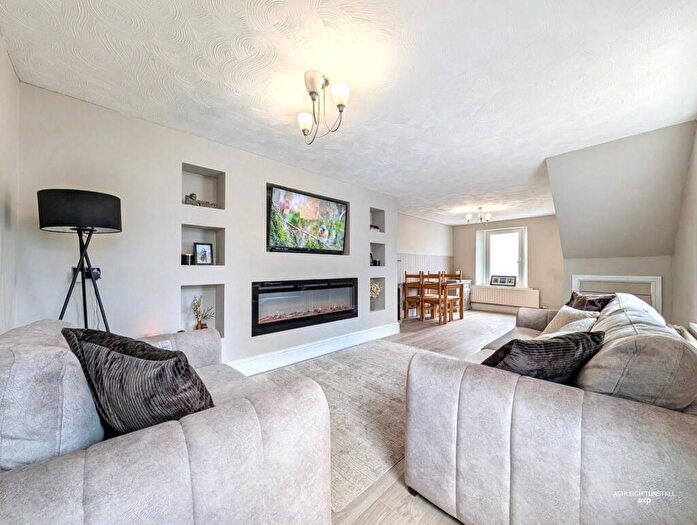
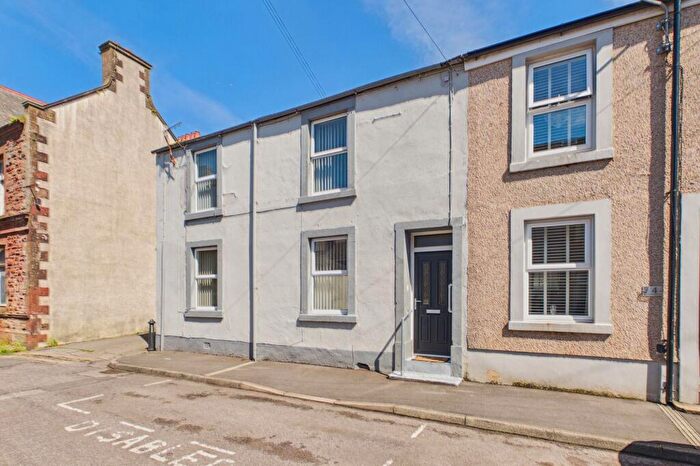
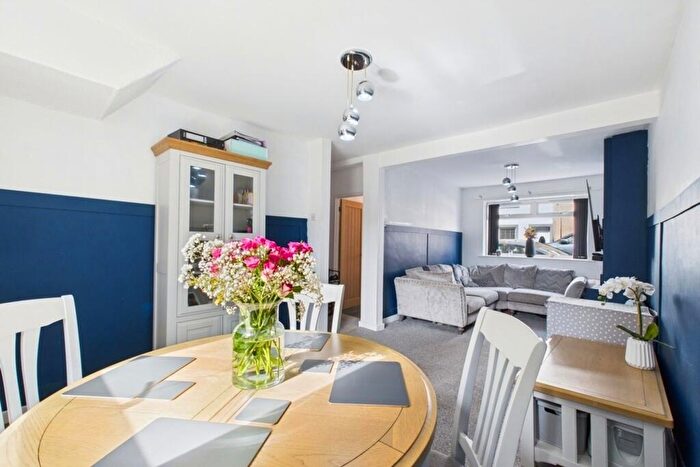
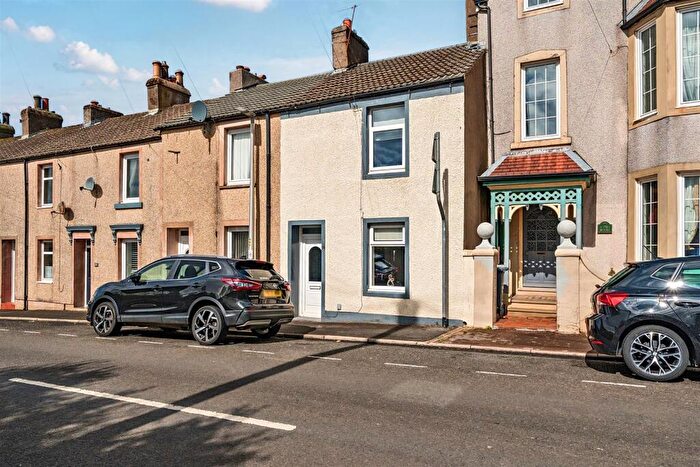
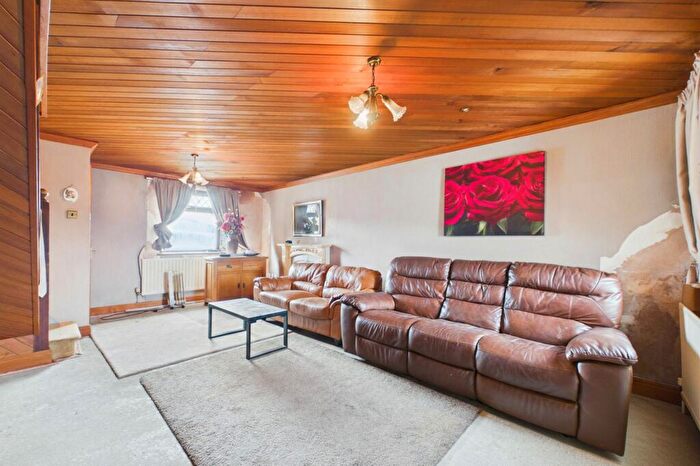
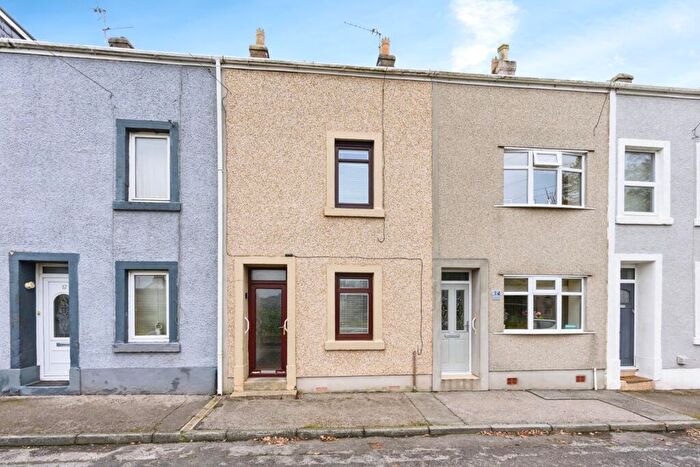
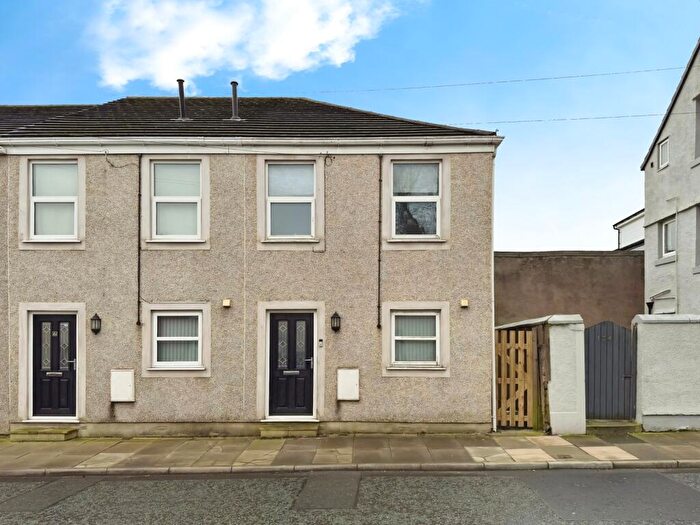
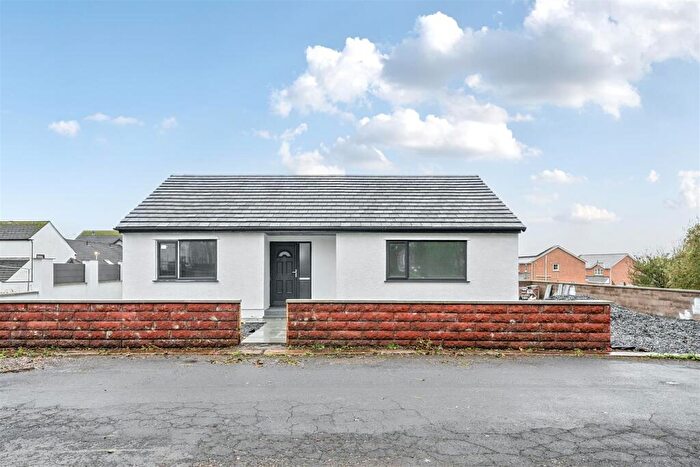
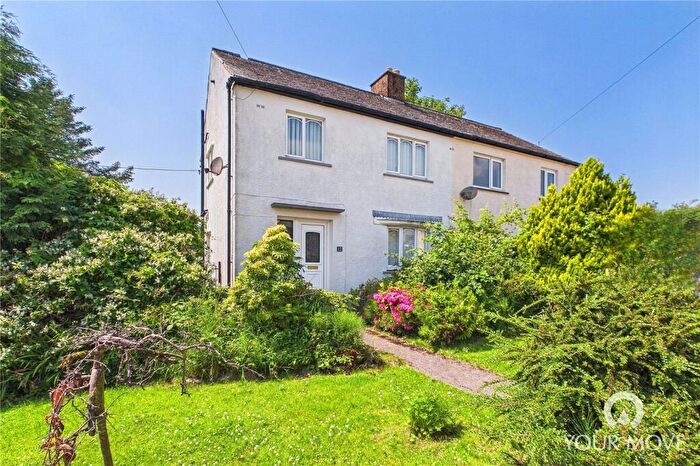
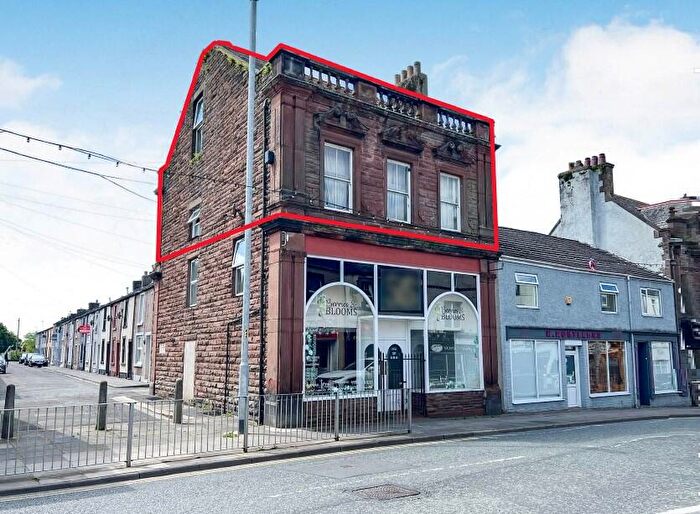
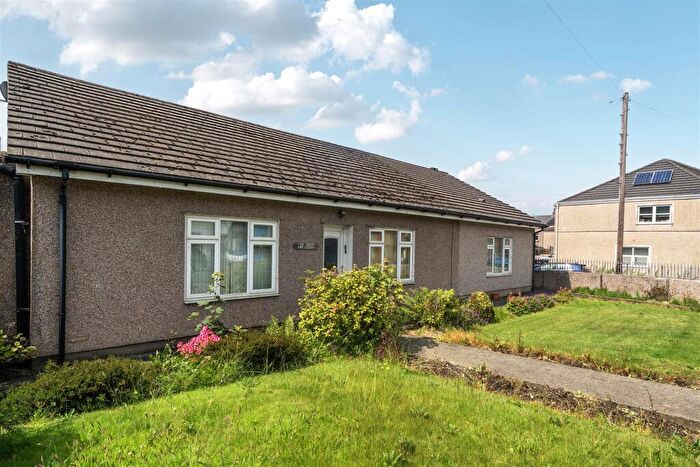
Properties for sale in Cleator Moor
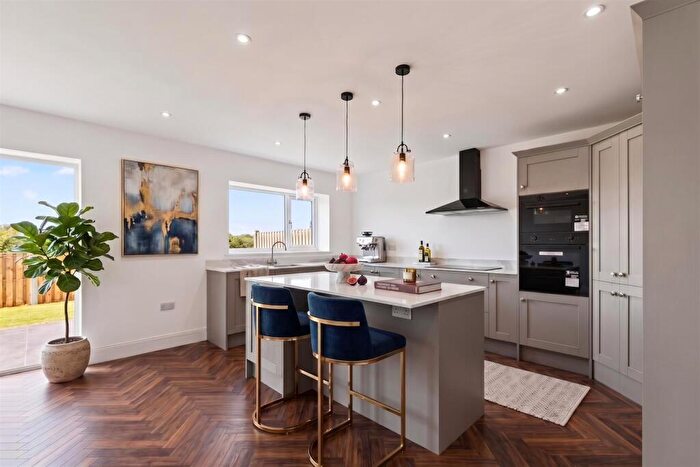
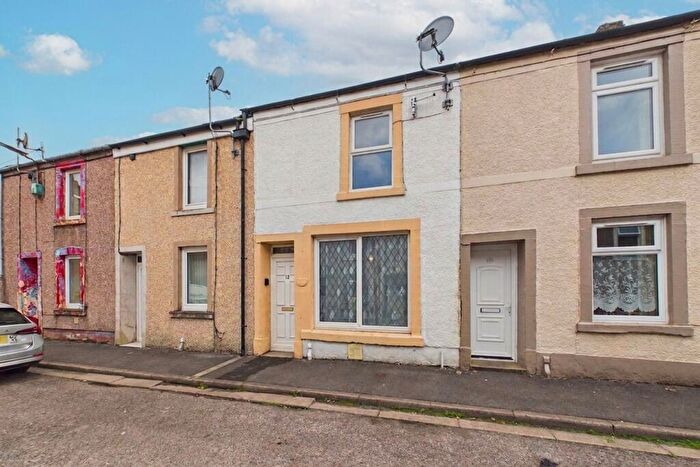
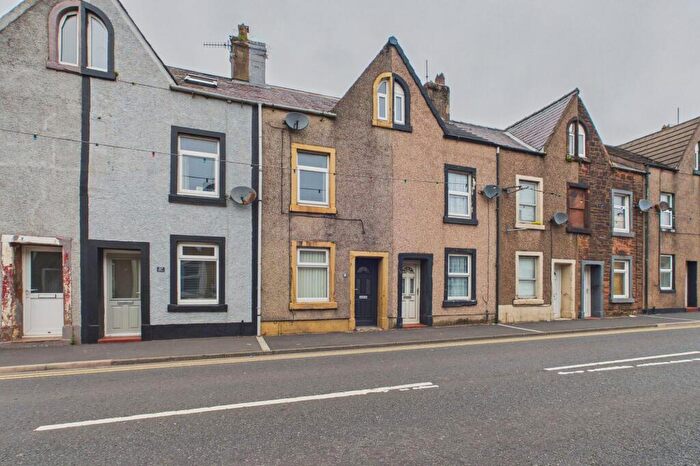
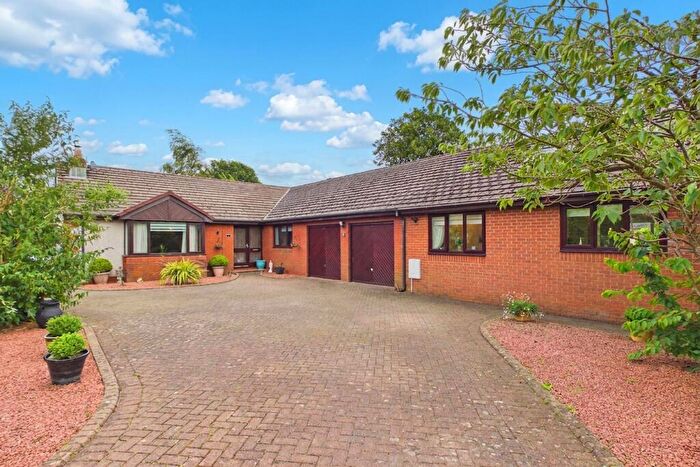
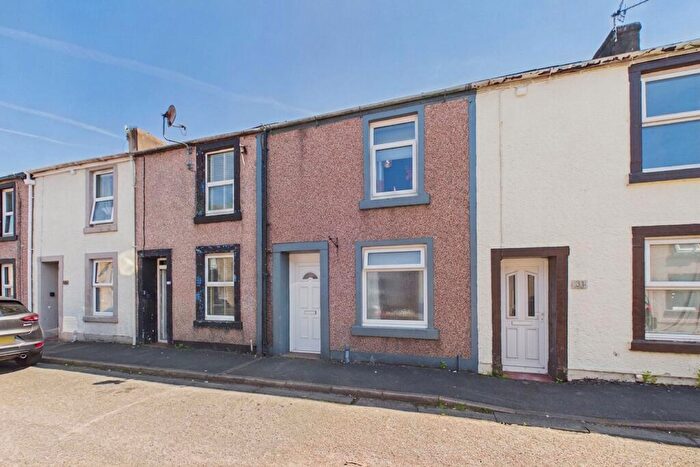
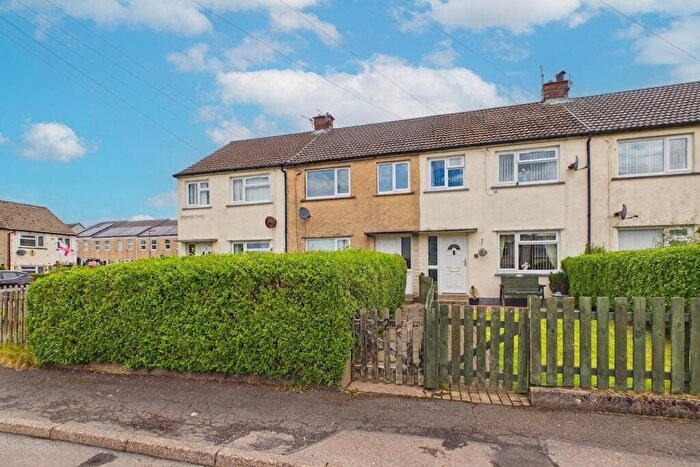
![]()
If you are looking to sell your house, let it out, or receive a property valuation, an expert can help you.
Click the button below to get started.

Roads and Postcodes in Cleator Moor
Navigate through our locations to find the location of your next house in Cleator Moor, Cleator for sale or to rent.
| Streets | Postcodes |
|---|---|
| Church Street | CA23 3AA CA23 3DD |
| East Dent Cottages | CA23 3EU |
| Ehenside Court | CA23 3BF |
| Jacktrees Meadows | CA23 3BG |
| Jacktrees Road | CA23 3DW |
| The Old Reading Rooms | CA23 3BQ |
| Trumpet Road | CA23 3EB |
| CA23 3EW CA23 3AB CA23 3BZ |
Property price trends in Cleator Moor
According to the latest Land Registry data, the average home in Cleator Moor sold for £415,000 in 2023. That figure comes from 8 sales logged over the past 9 years.
Prices have continued to climb over the last three years. Compared with 2020, when the typical sale came in around £121,250, that's a rise of roughly 242.3%.
Looking back five years, average prices are down about 7% since 2018, a drop of around £31,000 in cash terms.
Zoom out to the past decade for the fuller picture. Back in 2014, homes here averaged £80,000, so the typical sold price has climbed about 418.8% since then, roughly 20.1% a year.
Frequently asked questions about Cleator Moor
What is the average price for a property for sale in Cleator Moor?
The average price for a property for sale in Cleator Moor is £415,000. This amount is 188% higher than the average price in Cleator. There are 357 property listings for sale in Cleator Moor.
Which train stations are available in or near Cleator Moor?
Some of the train stations available in or near Cleator Moor are St.Bees, Corkickle and Whitehaven.
Property Price Paid in Cleator Moor by Year
The average sold property price by year was:
| Year | Average Sold Price | Price Change |
Sold Properties
|
|---|---|---|---|
| 2023 | £415,000 | 70% |
1 Property |
| 2022 | £125,000 | 3% |
1 Property |
| 2020 | £121,250 | -15% |
2 Properties |
| 2019 | £139,950 | -219% |
1 Property |
| 2018 | £446,000 | 66% |
1 Property |
| 2015 | £150,000 | 47% |
1 Property |
| 2014 | £80,000 | - |
1 Property |
Property Price per Property Type in Cleator Moor
Here you can find historic sold price data in order to help with your property search.
The average Property Paid Price for specific property types in the last three years are:
| Property Type | Average Sold Price | Sold Properties |
|---|---|---|
| Detached House | £415,000.00 | 1 Detached House |
