
Houses for sale in Cockermouth, Cumbria
House Prices in Cockermouth
Properties in Cockermouth have an average house price of £260k and had 778 Property Transactions within the last 3 years.¹
Cockermouth is an area in Cumbria with 7,083 households², where the most expensive property was sold for £1.5M.
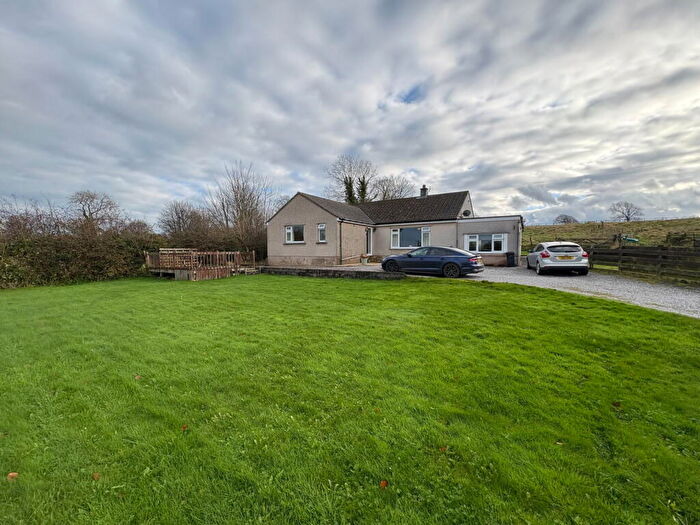
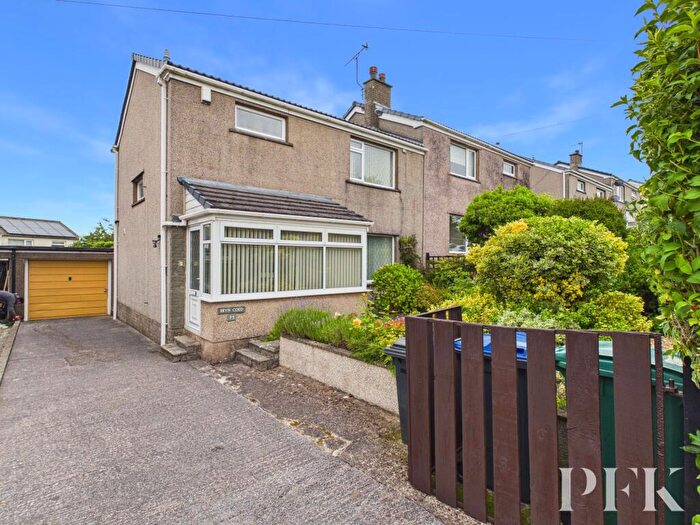
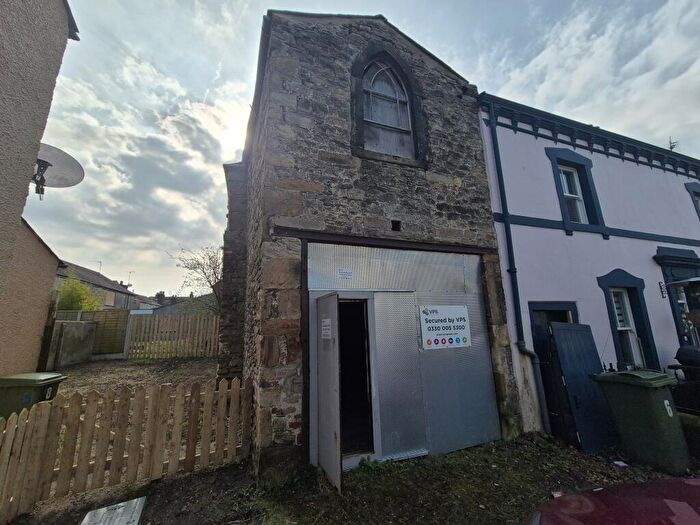
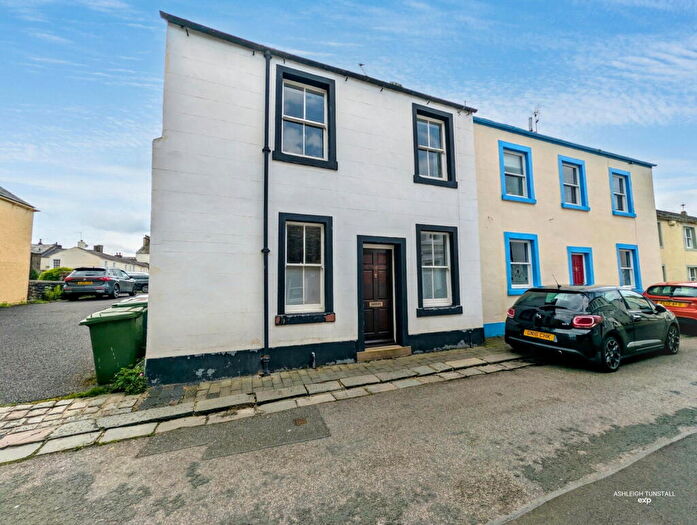
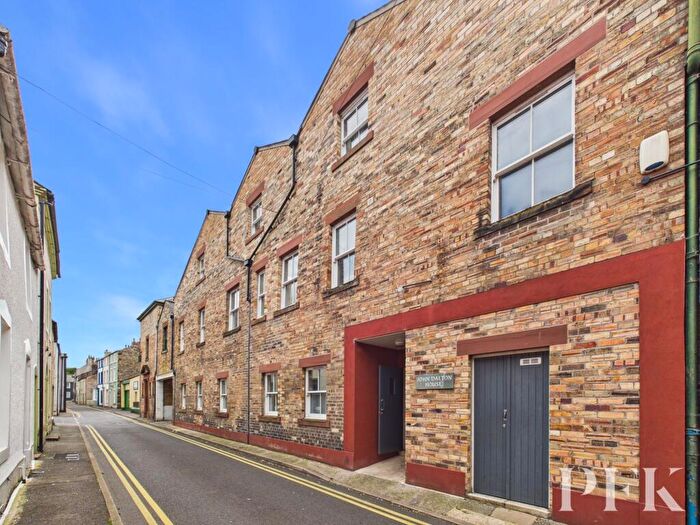
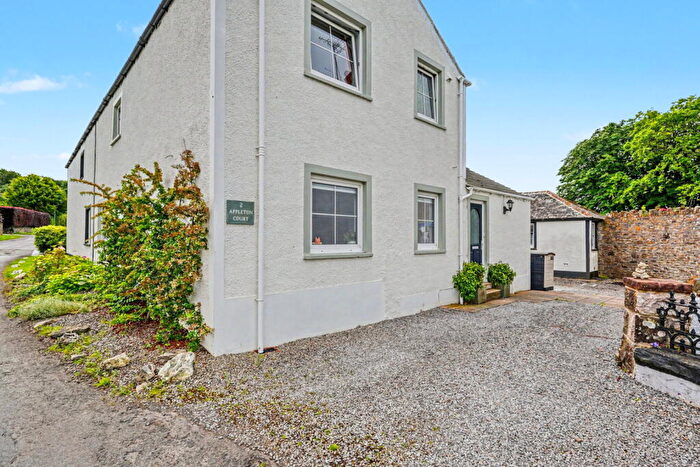
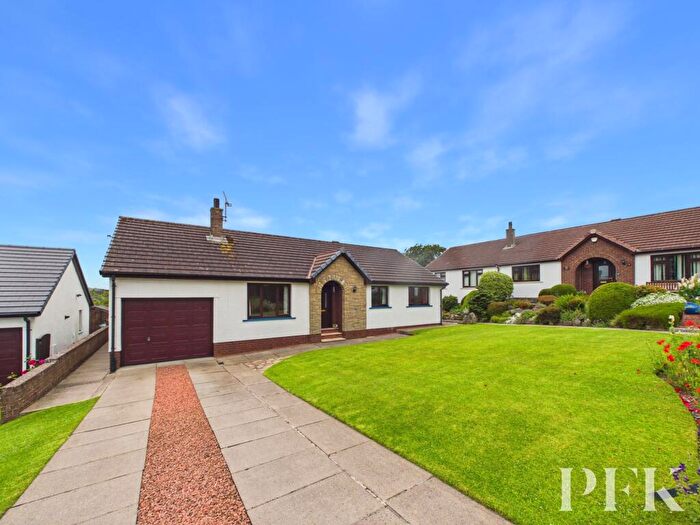
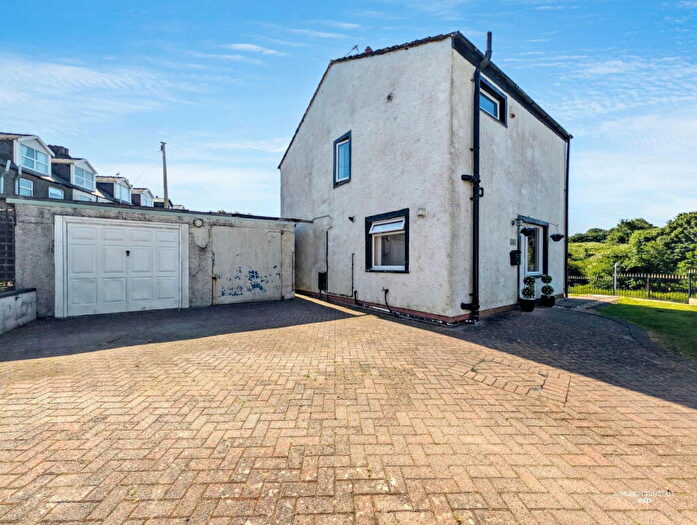
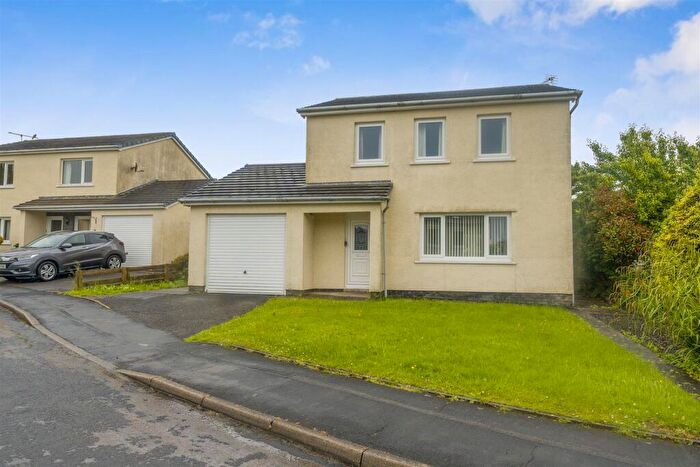
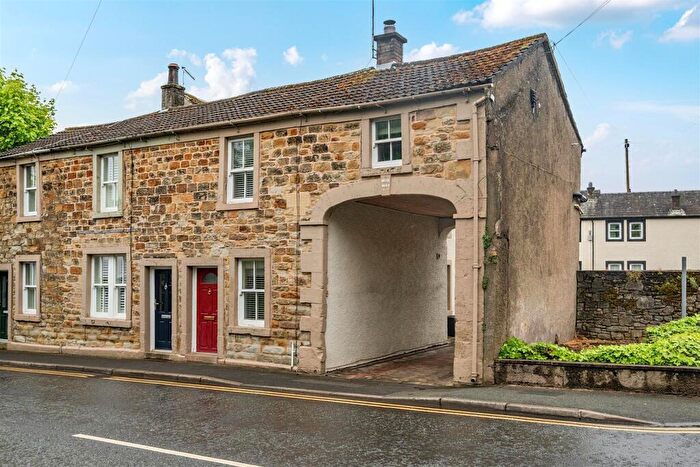
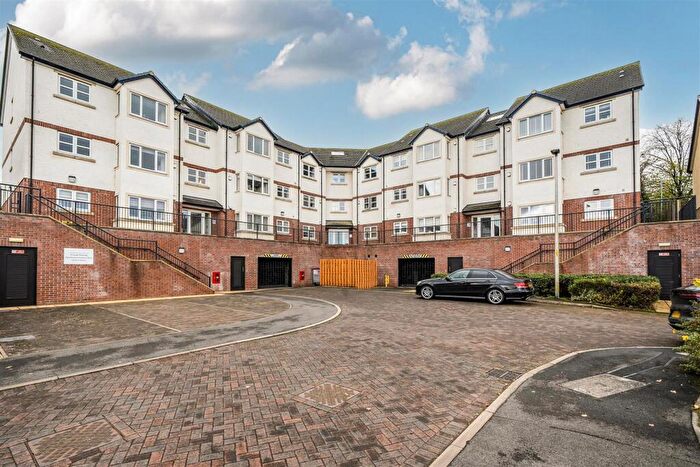
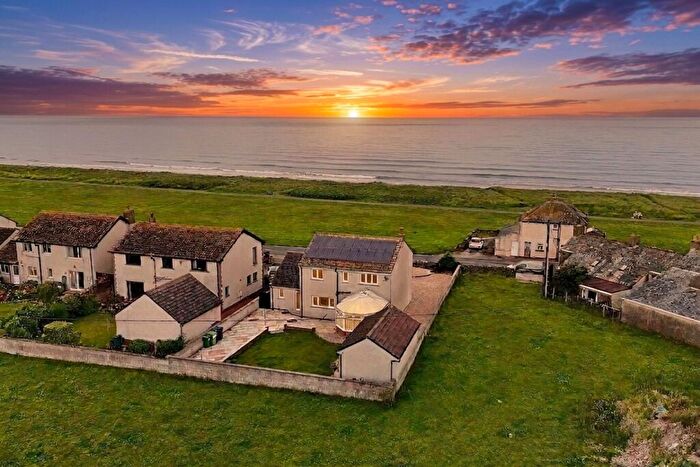
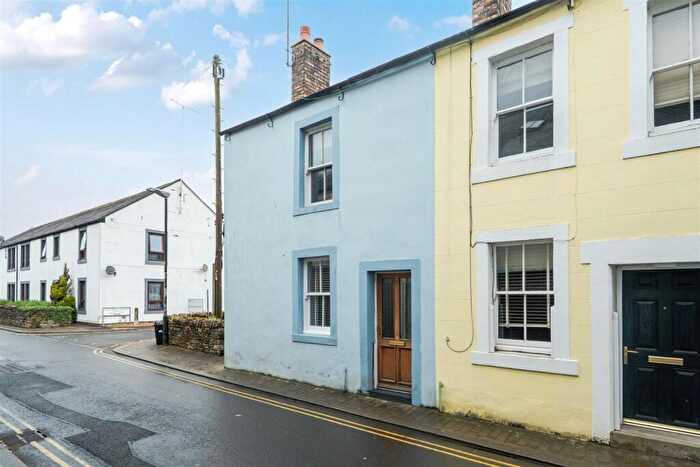
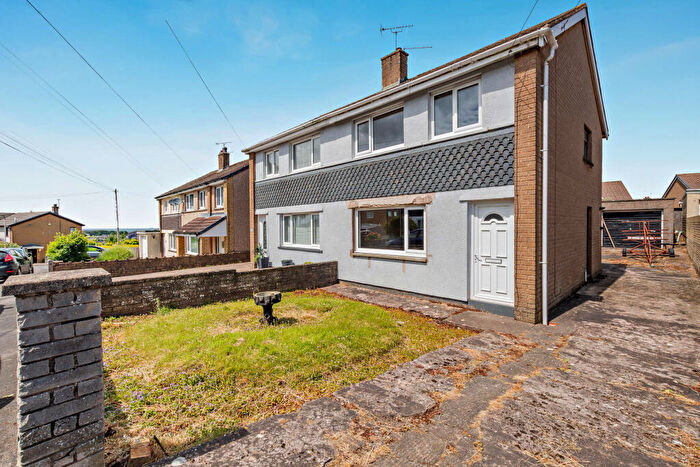
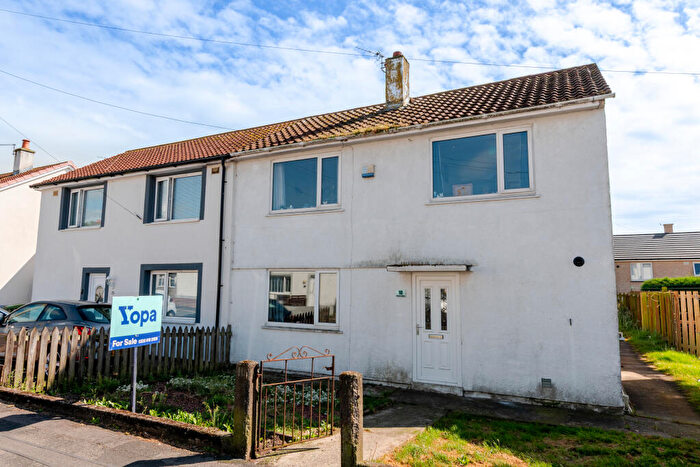
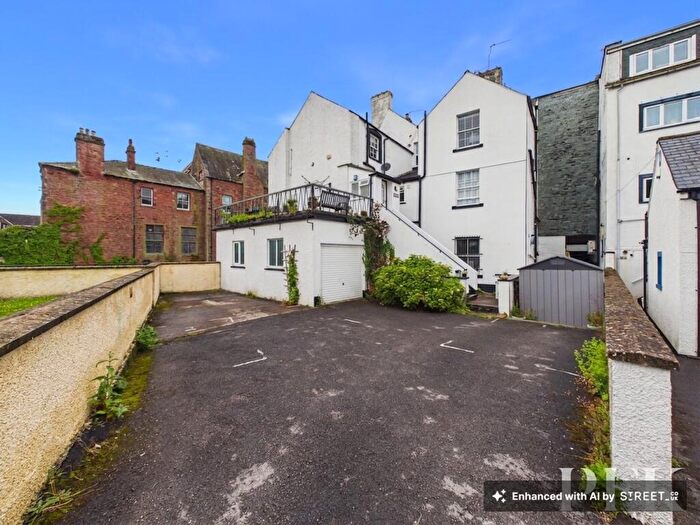
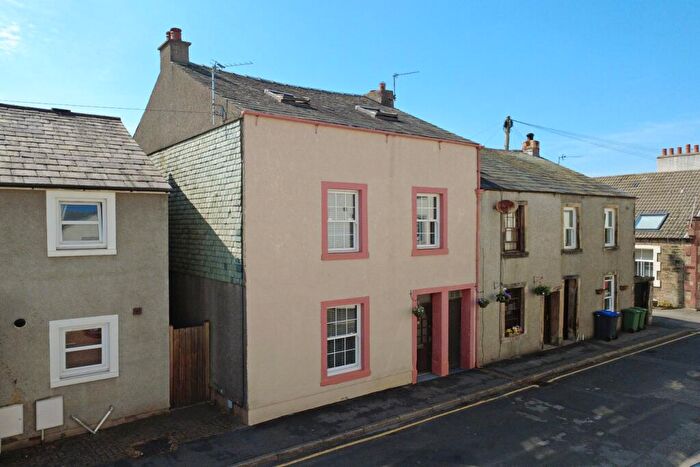
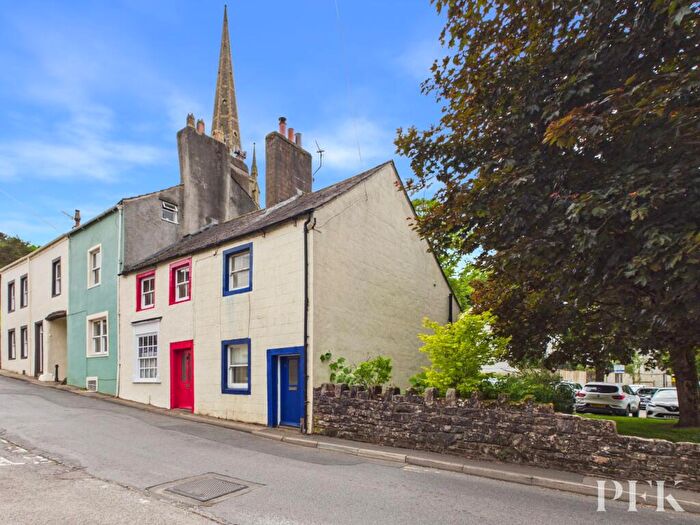
Properties for sale in Cockermouth
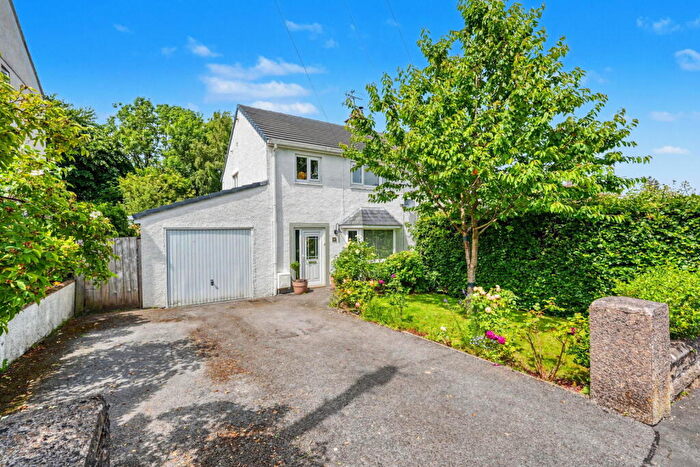
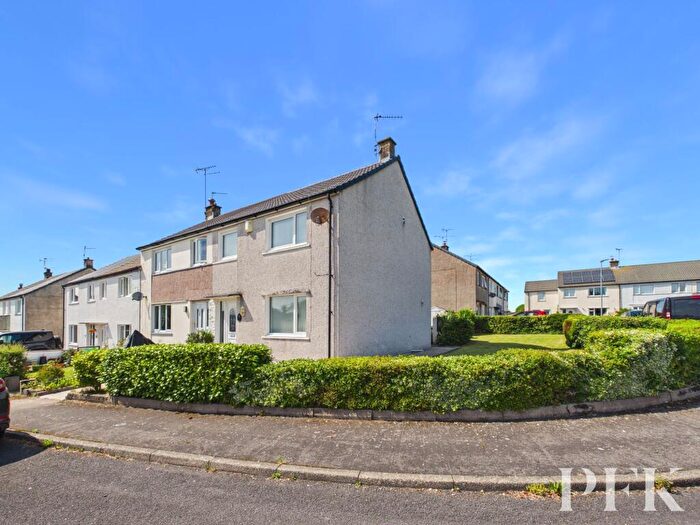
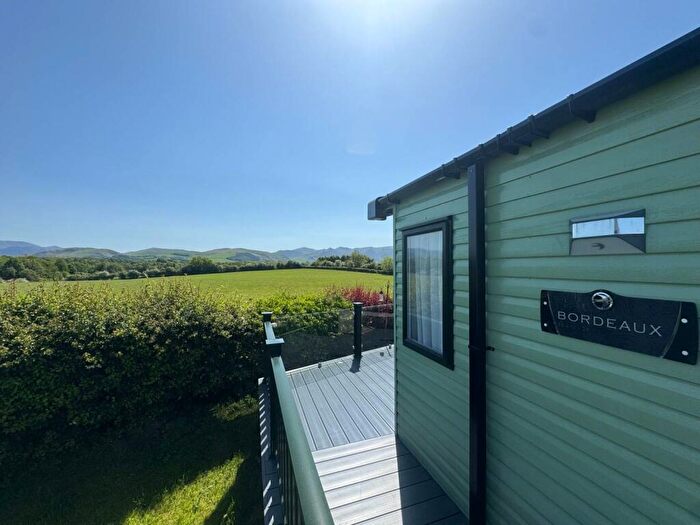
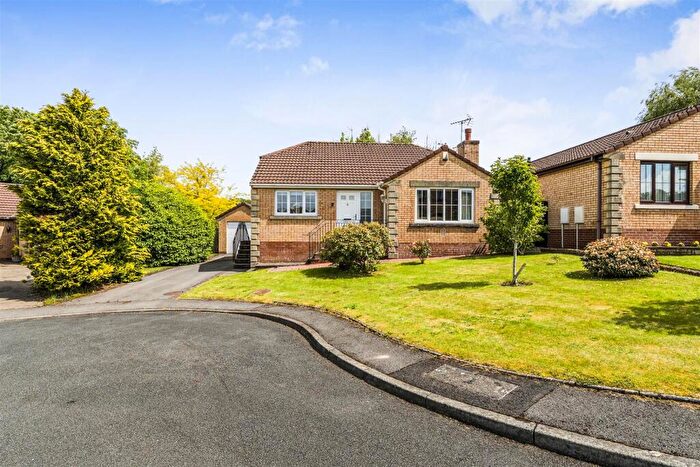
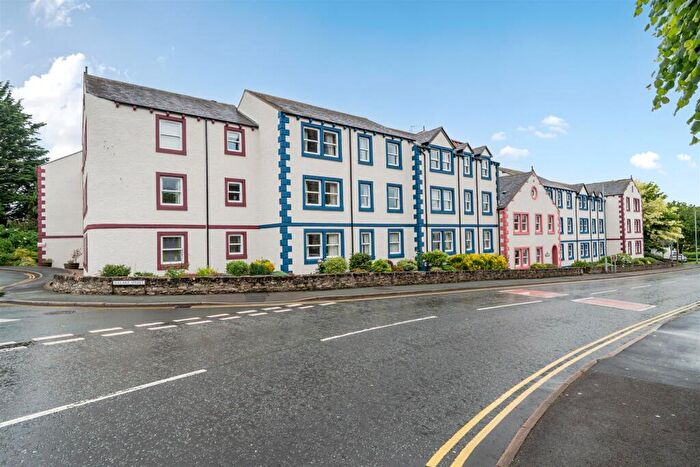
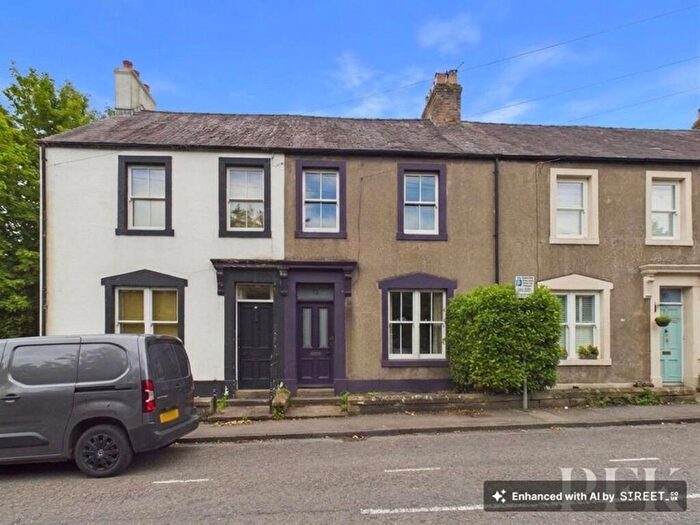
![]()
If you are looking to sell your house, let it out, or receive a property valuation, an expert can help you.
Click the button below to get started.
Neighbourhoods in Cockermouth
Navigate through our locations to find the location of your next house in Cockermouth, Cumbria for sale or to rent.
Property price trends in Cockermouth
According to the latest Land Registry data, the average home in Cockermouth sold for £252,350 in 2026. That figure comes from a substantial record of 9,181 sales logged over the past 31 years.
Prices have held fairly steady over the last three years. Compared with 2023, when the typical sale came in around £250,661, values are broadly unchanged.
Looking back five years, average prices are down about 0.5% since 2021, a drop of around £1,320 in cash terms.
Zoom out to the past decade for the fuller picture. Back in 2016, homes here averaged £223,225, so the typical sold price has climbed about 13% since then, roughly 1.2% a year. Stretch the view to fifteen years and that annual pace holds at about 1.1%.
Frequently asked questions about Cockermouth
What is the average price for a property for sale in Cockermouth?
The average price for a property for sale in Cockermouth is £259,532. This amount is 16% higher than the average price in Cumbria. There are 3,417 property listings for sale in Cockermouth.
What locations have the most expensive properties for sale in Cockermouth?
The locations with the most expensive properties for sale in Cockermouth are Crummock & Derwent Valley at an average of £487,500, Crummock at an average of £437,993 and Dalton at an average of £281,224.
What locations have the most affordable properties for sale in Cockermouth?
The locations with the most affordable properties for sale in Cockermouth are Christchurch at an average of £232,522, Broughton St Bridgets at an average of £249,268 and All Saints at an average of £264,253.
Which train stations are available in or near Cockermouth?
Some of the train stations available in or near Cockermouth are Maryport, Flimby and Aspatria.
Property Price Paid in Cockermouth by Year
The average sold property price by year was:
| Year | Average Sold Price | Price Change |
Sold Properties
|
|---|---|---|---|
| 2026 | £252,350 | -4% |
15 Properties |
| 2025 | £262,282 | -1% |
252 Properties |
| 2024 | £266,143 | 6% |
255 Properties |
| 2023 | £250,661 | -2% |
256 Properties |
| 2022 | £256,331 | 1% |
301 Properties |
| 2021 | £253,670 | 7% |
329 Properties |
| 2020 | £236,366 | 1% |
254 Properties |
| 2019 | £234,891 | 2% |
319 Properties |
| 2018 | £229,901 | 4% |
335 Properties |
| 2017 | £221,287 | -1% |
301 Properties |
Property Price per Property Type in Cockermouth
Here you can find historic sold price data in order to help with your property search.
The average Property Paid Price for specific property types in the last three years are:
| Property Type | Average Sold Price | Sold Properties |
|---|---|---|
| Semi Detached House | £231,691.00 | 214 Semi Detached Houses |
| Detached House | £377,849.00 | 266 Detached Houses |
| Terraced House | £191,566.00 | 222 Terraced Houses |
| Flat | £122,351.00 | 76 Flats |
Transport in Cockermouth
Please see below transportation links in this area:
