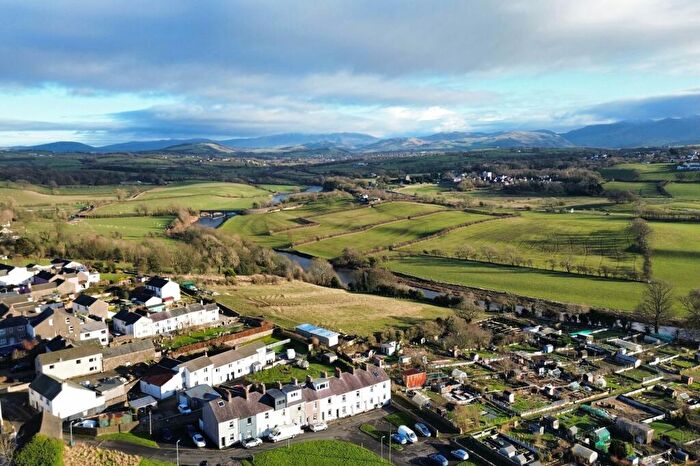
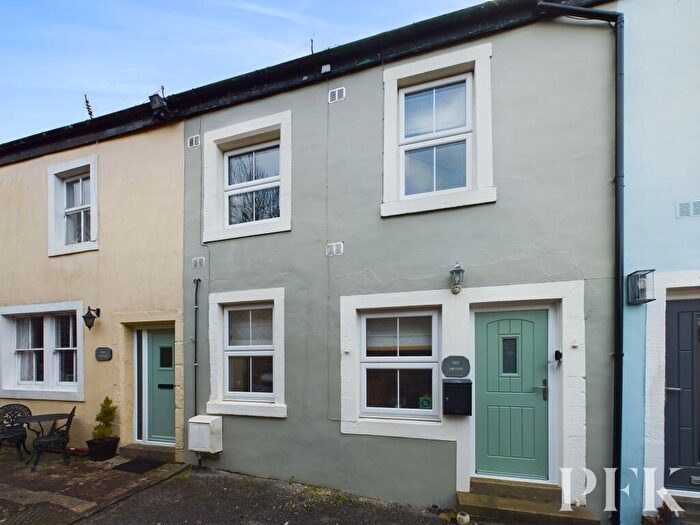
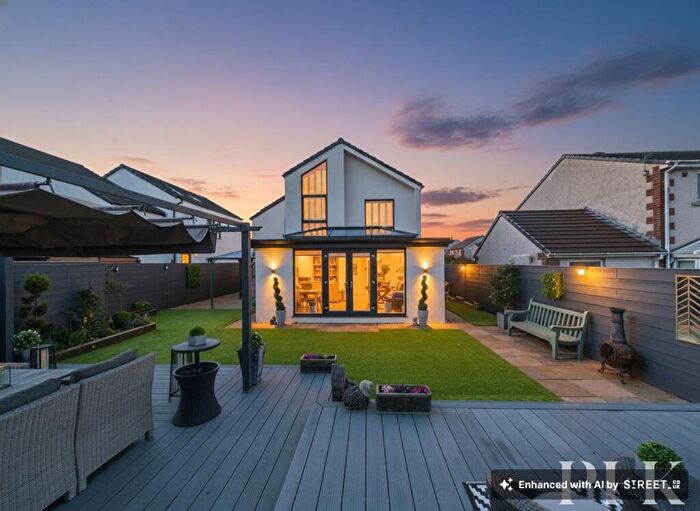
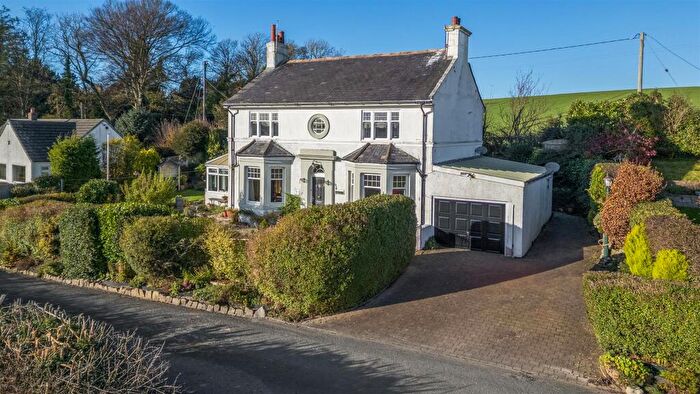
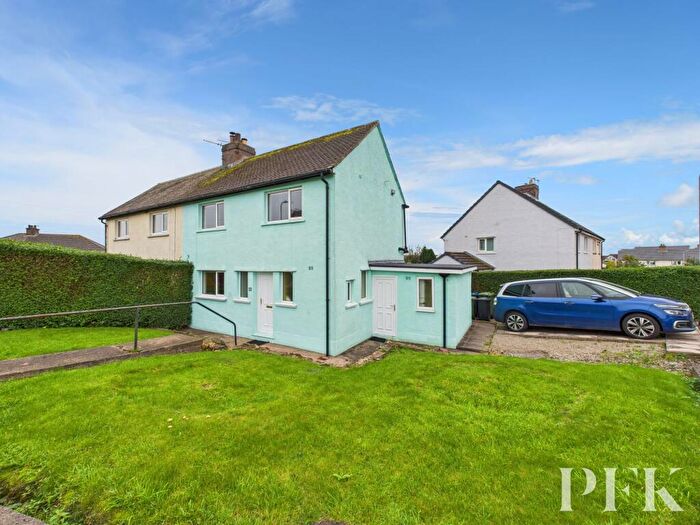
Houses for sale & to rent in Broughton St Bridgets, Cockermouth
House Prices in Broughton St Bridgets
Properties in Broughton St Bridgets have an average house price of £251,532.00 and had 245 Property Transactions within the last 3 years¹.
Broughton St Bridgets is an area in Cockermouth, Cumbria with 1,740 households², where the most expensive property was sold for £825,000.00.
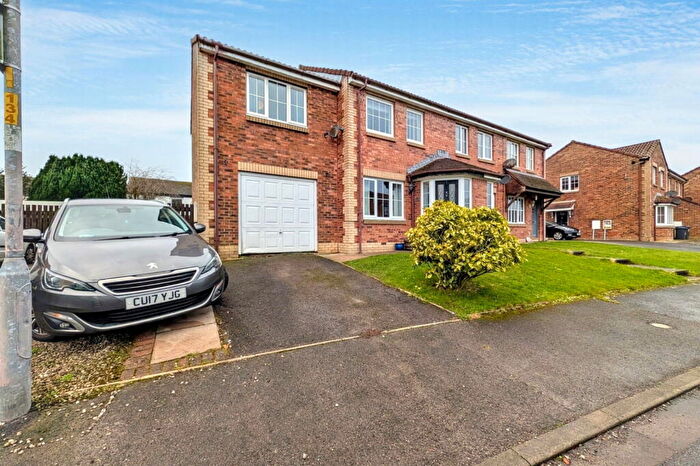
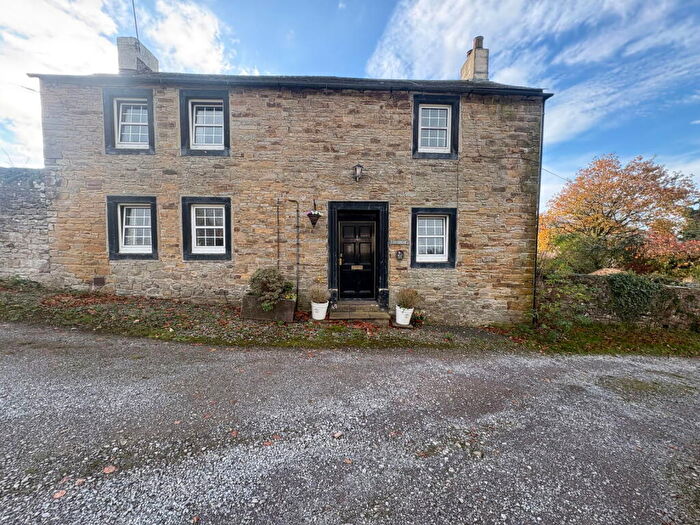
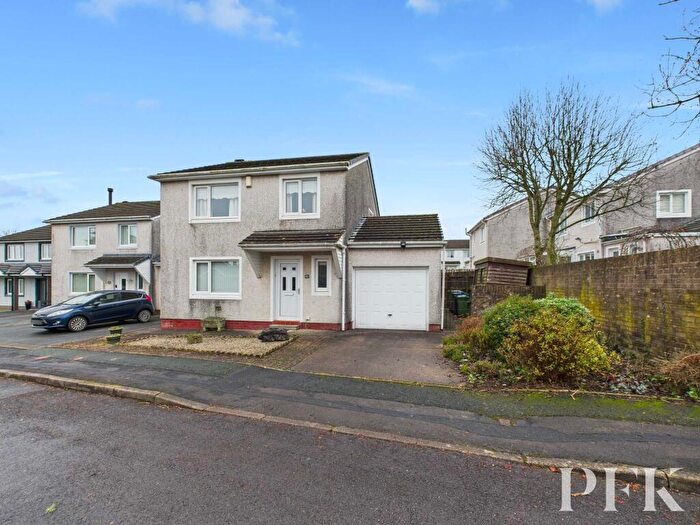
Properties for sale in Broughton St Bridgets
Roads and Postcodes in Broughton St Bridgets
Navigate through our locations to find the location of your next house in Broughton St Bridgets, Cockermouth for sale or to rent.
| Streets | Postcodes |
|---|---|
| Alice Lane | CA13 0YB |
| Archway Cottages | CA13 0YF |
| Ashtree Farm Cottages | CA13 0WZ |
| Belle Vue | CA13 0NT CA13 0NW |
| Brigham Hill Mansion | CA13 0TL |
| Broughton Cross | CA13 0TY |
| Broughton Park | CA13 0XW |
| Butterfield Close | CA13 0ZR |
| Camerton Road | CA13 0YR |
| Carlisle Road | CA13 0PA |
| Castle Gardens | CA13 0JX |
| Chapel Terrace | CA13 0YU |
| Church Meadows | CA13 0JL CA13 0LE CA13 0LF |
| Clowes Villas | CA13 0YE |
| Cockermouth Lonning | CA13 0TF |
| Coldgill Avenue | CA13 0YW |
| Colin Grove | CA13 0UX |
| Craggs Road | CA13 0XP |
| Cross Howe | CA13 0UU |
| Derwent Park | CA13 0YS |
| Derwent Row | CA13 0TZ |
| Dovers Lane | CA13 0JP |
| Fernleigh Close | CA13 0NS |
| Fitz Road | CA13 0XE |
| Fletcher Close | CA13 0NF |
| Ghyll Bank | CA13 0LH CA13 0LJ CA13 0LL CA13 0LN CA13 0LP CA13 0LR CA13 0LW |
| Grange Avenue | CA13 0NE |
| Hall Court | CA13 0PU |
| Harris Brow | CA13 0XR |
| High Brigham | CA13 0SZ CA13 0TB CA13 0TE CA13 0TG CA13 0TJ CA13 0TD CA13 0TW |
| High Rigg | CA13 0TA |
| High Station Houses | CA15 7LB |
| Highcroft Close | CA13 0NR |
| Hill Crescent | CA13 0TR |
| Hill Crest | CA13 0PP |
| Holly Close | CA13 0JS |
| Hotchberry Road | CA13 0TQ |
| Kirklea | CA13 0LU CA13 0LZ CA13 0NA CA13 0NB CA13 0ND CA13 0LS CA13 0LT CA13 0LX CA13 0LY |
| Ladywath | CA13 0TT |
| Lamplugh Road | CA13 0QU |
| Lanty Close | CA13 0UZ |
| Lawson Garth | CA13 0SX |
| Listers Cottages | CA13 0XY |
| Low Road | CA13 0XQ |
| Main Street | CA13 0YJ CA13 0YL |
| Mancroft Cottages | CA13 0XH |
| Meeting House Lane | CA13 0YQ CA13 0YH |
| Middleton Grove | CA13 0PX |
| Moor Road | CA13 0YT CA13 0YX |
| Moorfield Bank | CA13 0XA |
| Orchard Lane | CA13 0NQ |
| Peartree Gardens | CA13 0YG |
| Potts Terrace | CA13 0WY |
| Pump Square | CA13 0YD |
| Rook Farm Close | CA13 0PH |
| School Brow | CA13 0TS |
| Solway View | CA13 0PS |
| South Terrace | CA13 0YY |
| Spring Bank Court | CA13 0GZ |
| Spring Croft Close | CA13 0TH |
| St Bridgets Close | CA13 0DJ |
| Stoney Beck Cottages | CA13 0TX |
| The Cottages | CA13 0PB CA13 0PN |
| The Entrance | CA13 0XX |
| The Hill | CA13 0TP |
| The Mount | CA13 0JY CA13 0JZ |
| The Nook | CA13 0XD |
| The Paddocks | CA13 0ZA |
| The Parklands | CA13 0WW CA13 0XJ |
| West End | CA13 0YN |
| Woodland Grange | CA13 0PJ |
| CA13 0JN CA13 0JR CA13 0JT CA13 0LA CA13 0LB CA13 0NU CA13 0NX CA13 0PE CA13 0PF CA13 0PG CA13 0PR CA13 0PT CA13 0SY CA13 0TN CA13 0XG CA13 0XS CA13 0XT CA13 0XU CA13 0XZ CA13 0YA CA13 0JU CA13 0JW CA13 0LD CA13 0LG CA13 0NL CA13 0NY CA13 0NZ CA13 0PQ CA13 0PW CA13 0PY CA13 0TU CA13 0XB CA13 0XF CA13 0XN CA13 0YP CA15 7LA CA15 7LD |
Transport near Broughton St Bridgets
-
Maryport Station
-
Flimby Station
-
Workington Station
-
Aspatria Station
-
Harrington Station
-
Parton Station
- FAQ
- Price Paid By Year
- Property Type Price
Frequently asked questions about Broughton St Bridgets
What is the average price for a property for sale in Broughton St Bridgets?
The average price for a property for sale in Broughton St Bridgets is £251,532. This amount is 3% lower than the average price in Cockermouth. There are 921 property listings for sale in Broughton St Bridgets.
What streets have the most expensive properties for sale in Broughton St Bridgets?
The streets with the most expensive properties for sale in Broughton St Bridgets are Harris Brow at an average of £473,333, Stoney Beck Cottages at an average of £400,000 and Craggs Road at an average of £400,000.
What streets have the most affordable properties for sale in Broughton St Bridgets?
The streets with the most affordable properties for sale in Broughton St Bridgets are Meeting House Lane at an average of £72,000, High Station Houses at an average of £82,000 and The Nook at an average of £98,000.
Which train stations are available in or near Broughton St Bridgets?
Some of the train stations available in or near Broughton St Bridgets are Maryport, Flimby and Workington.
Property Price Paid in Broughton St Bridgets by Year
The average sold property price by year was:
| Year | Average Sold Price | Price Change |
Sold Properties
|
|---|---|---|---|
| 2025 | £275,346 | 3% |
47 Properties |
| 2024 | £265,718 | 17% |
57 Properties |
| 2023 | £221,834 | -14% |
66 Properties |
| 2022 | £251,961 | -0,2% |
75 Properties |
| 2021 | £252,470 | 5% |
89 Properties |
| 2020 | £239,396 | 3% |
90 Properties |
| 2019 | £232,396 | -5% |
91 Properties |
| 2018 | £244,894 | 11% |
69 Properties |
| 2017 | £217,806 | 2% |
80 Properties |
| 2016 | £213,407 | 0,1% |
66 Properties |
| 2015 | £213,149 | -2% |
69 Properties |
| 2014 | £218,051 | 18% |
83 Properties |
| 2013 | £179,822 | -18% |
92 Properties |
| 2012 | £213,076 | -0,3% |
55 Properties |
| 2011 | £213,659 | -5% |
46 Properties |
| 2010 | £225,180 | 15% |
49 Properties |
| 2009 | £191,594 | 7% |
46 Properties |
| 2008 | £178,717 | -27% |
43 Properties |
| 2007 | £226,101 | 10% |
76 Properties |
| 2006 | £203,908 | 10% |
105 Properties |
| 2005 | £184,413 | 15% |
90 Properties |
| 2004 | £156,590 | 8% |
82 Properties |
| 2003 | £143,978 | 21% |
128 Properties |
| 2002 | £113,413 | 17% |
138 Properties |
| 2001 | £94,112 | -1% |
146 Properties |
| 2000 | £95,519 | 19% |
115 Properties |
| 1999 | £77,062 | 23% |
89 Properties |
| 1998 | £59,051 | -3% |
87 Properties |
| 1997 | £60,709 | -8% |
95 Properties |
| 1996 | £65,310 | 7% |
76 Properties |
| 1995 | £60,715 | - |
55 Properties |
Property Price per Property Type in Broughton St Bridgets
Here you can find historic sold price data in order to help with your property search.
The average Property Paid Price for specific property types in the last three years are:
| Property Type | Average Sold Price | Sold Properties |
|---|---|---|
| Semi Detached House | £193,866.00 | 61 Semi Detached Houses |
| Detached House | £349,010.00 | 106 Detached Houses |
| Terraced House | £167,540.00 | 74 Terraced Houses |
| Flat | £101,625.00 | 4 Flats |

