Houses for sale & to rent in All Saints, Cockermouth
House Prices in All Saints
Properties in All Saints have an average house price of £266,687.00 and had 217 Property Transactions within the last 3 years¹.
All Saints is an area in Cockermouth, Cumbria with 2,181 households², where the most expensive property was sold for £635,000.00.
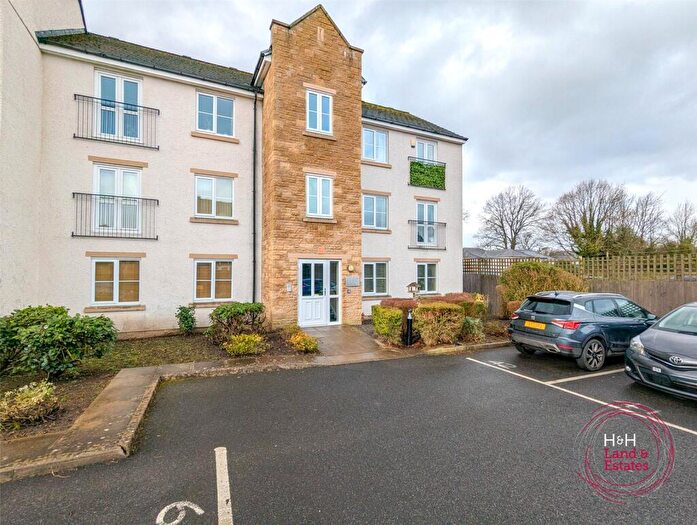
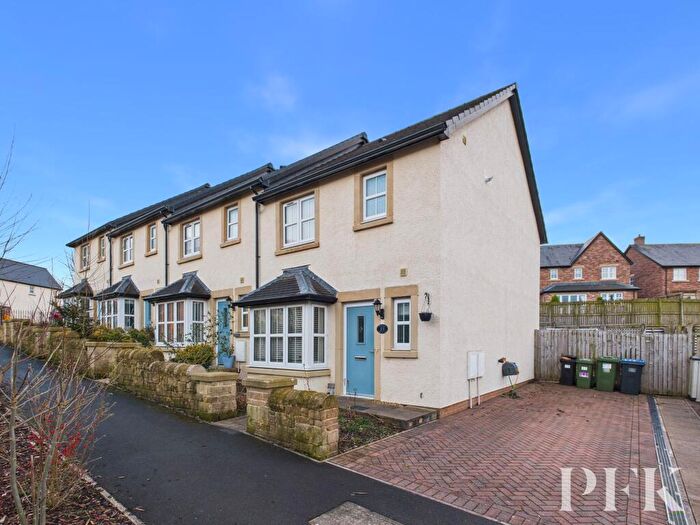
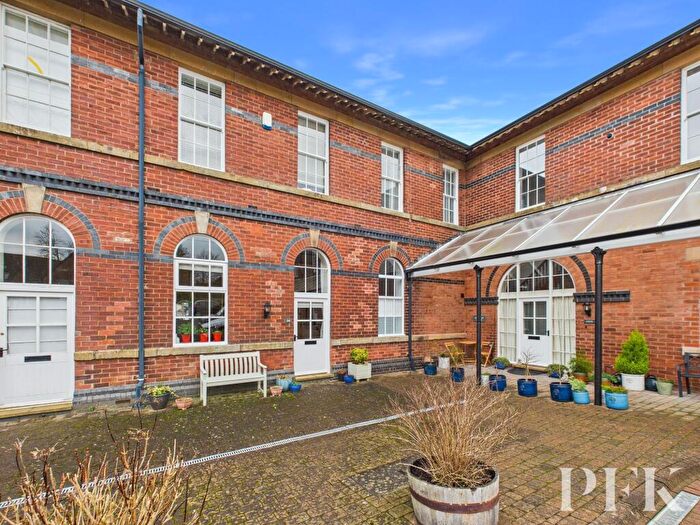
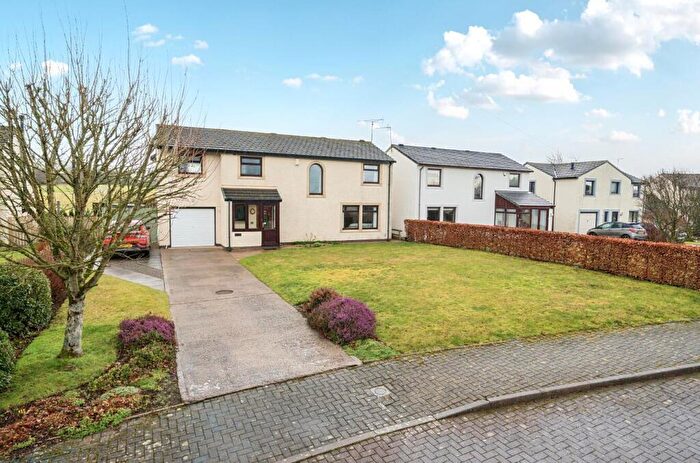
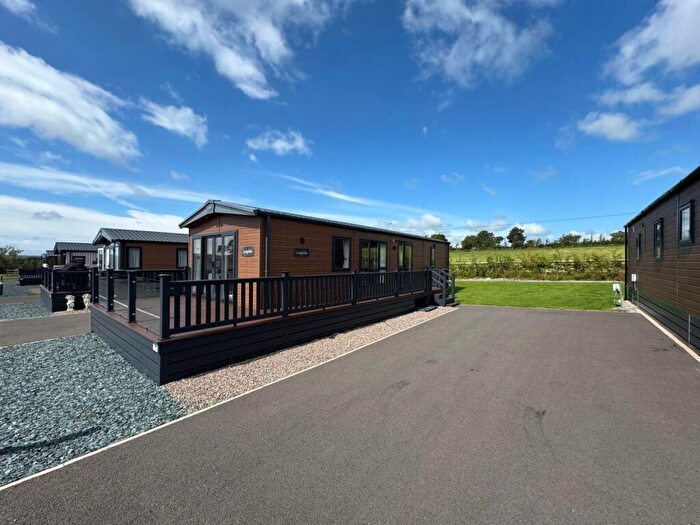
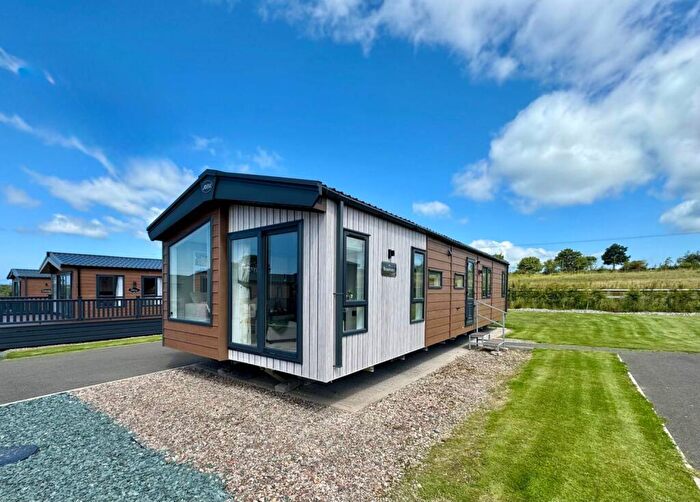
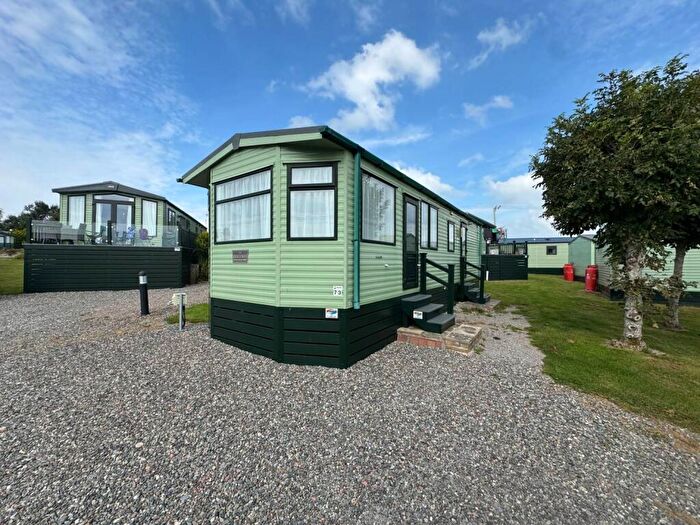
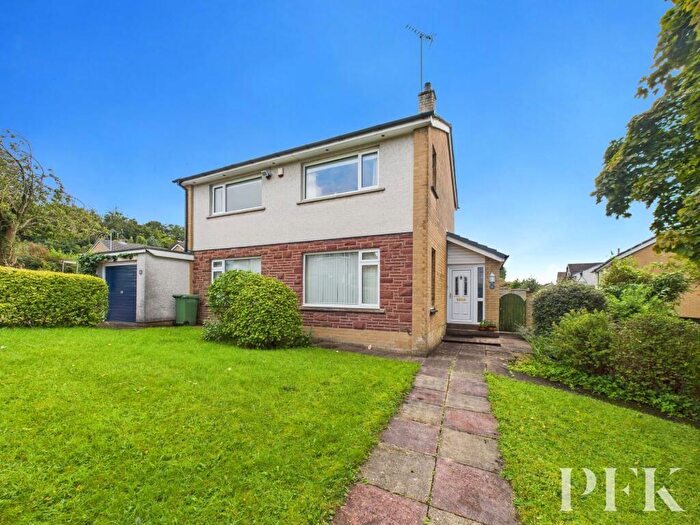
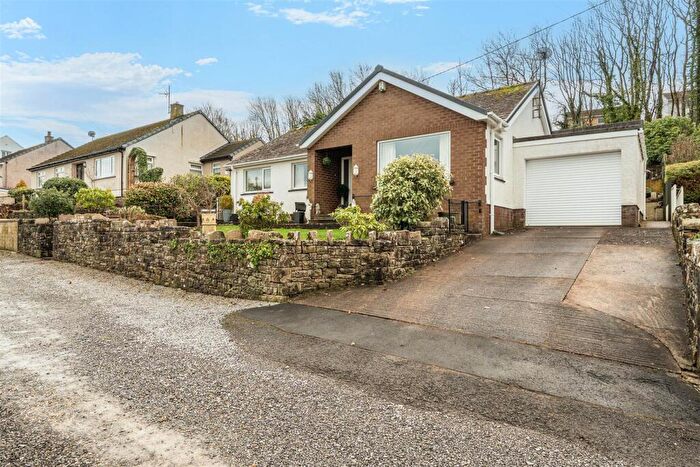
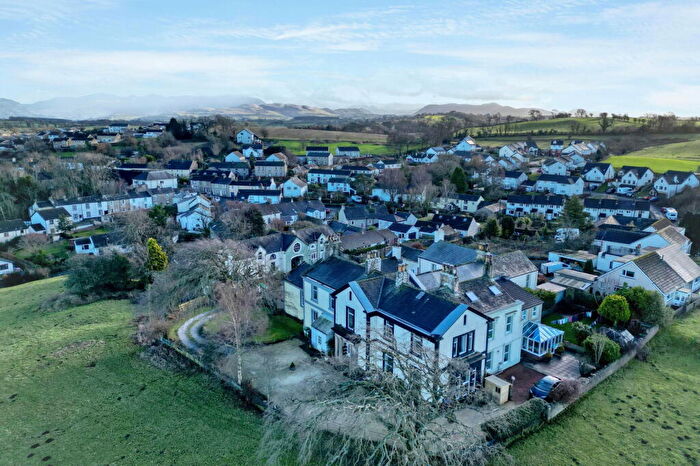
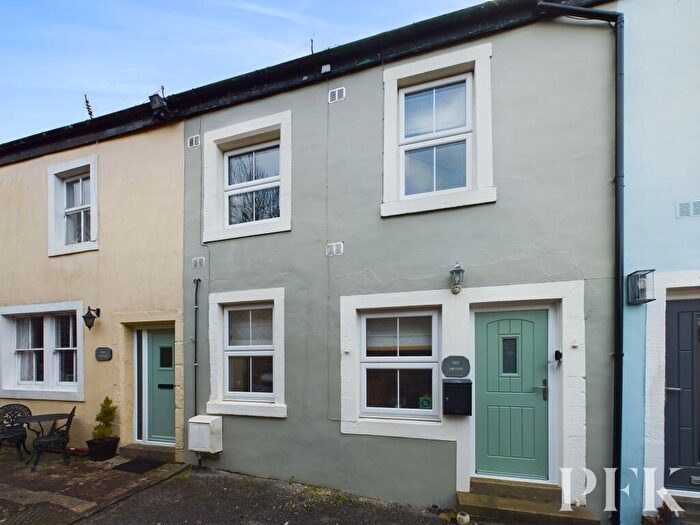
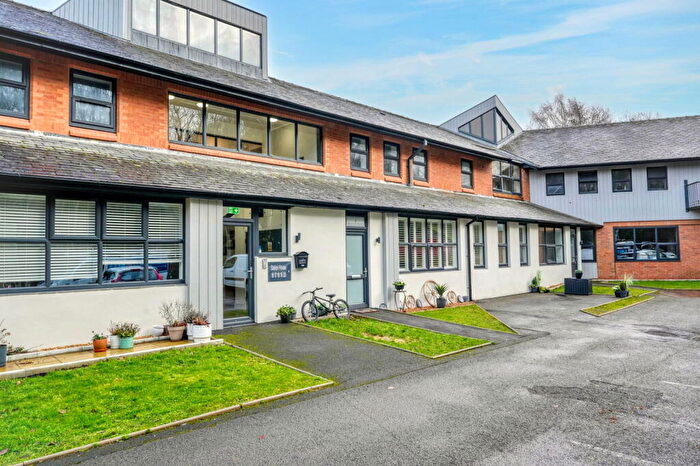
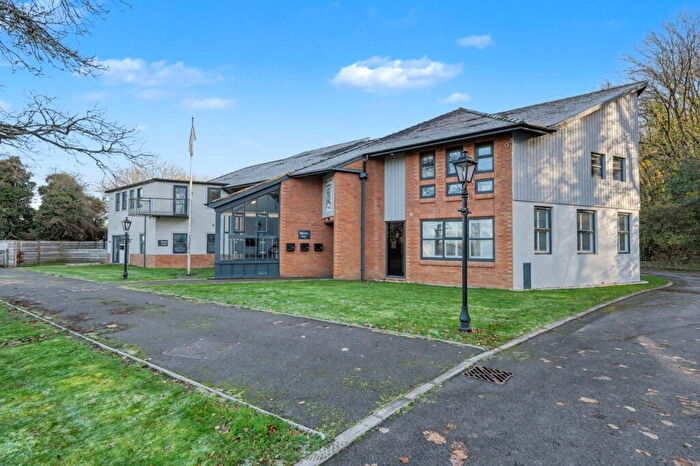
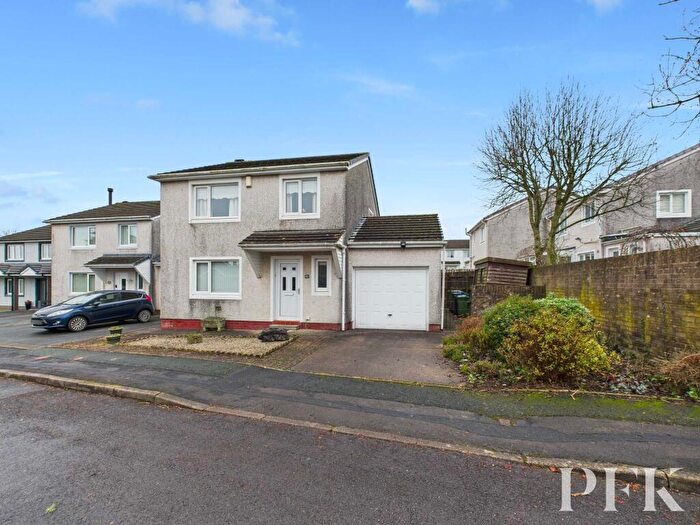
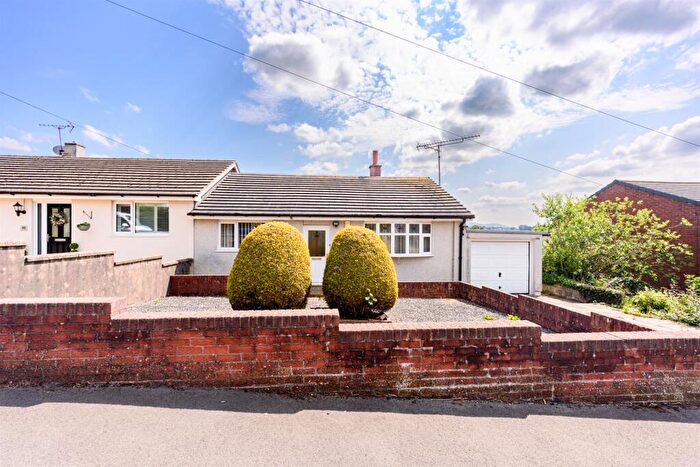
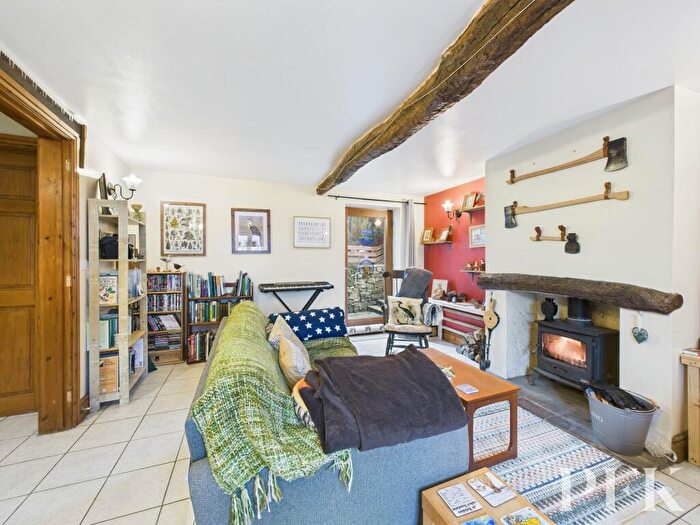
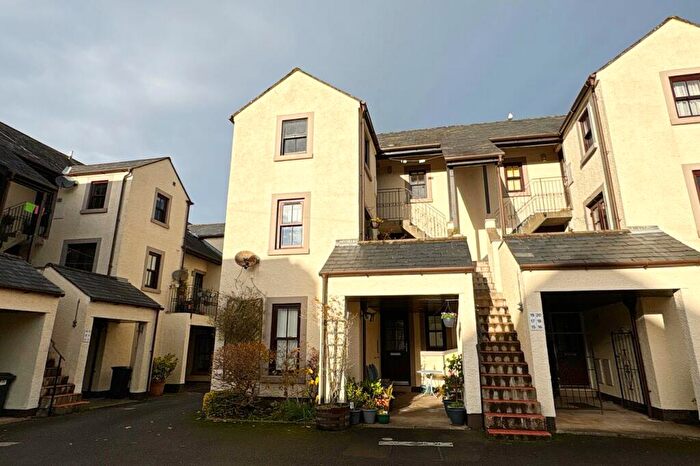
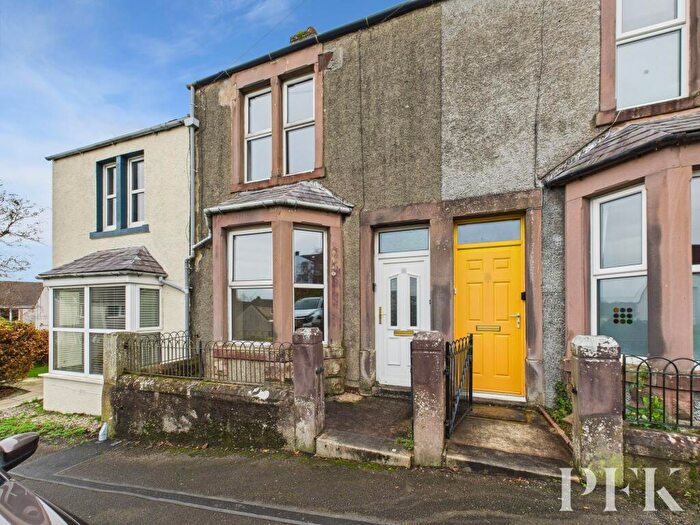
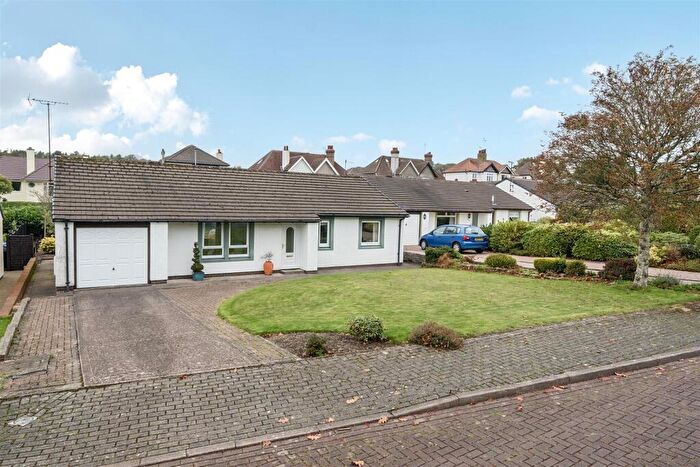
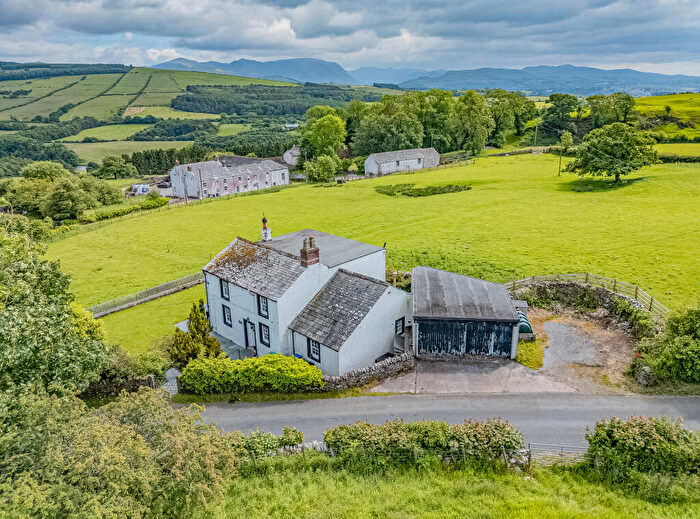
Properties for sale in All Saints
Roads and Postcodes in All Saints
Navigate through our locations to find the location of your next house in All Saints, Cockermouth for sale or to rent.
| Streets | Postcodes |
|---|---|
| Bassenthwaite Lake | CA13 9SH CA13 9YE CA13 9YL |
| Beckside Close | CA13 9PW |
| Beech Lane | CA13 9HG CA13 9HH CA13 9HQ |
| Bellbrigg Lonning | CA13 9BX CA13 9BZ CA13 9DA |
| Bitterbeck Close | CA13 9NN |
| Blencathra Court | CA13 9BW |
| Brewery Lane | CA13 9ND |
| Briar Bank | CA13 9DL CA13 9DN |
| Buttermere Close | CA13 9JJ |
| Butts Fold | CA13 9HY |
| Caldecote Avenue | CA13 9EQ |
| Castlegate | CA13 9EU CA13 9EX CA13 9HA |
| Castlegate Drive | CA13 9HD CA13 9HB CA13 9HF CA13 9JR |
| Cedar Lane | CA13 9HN |
| Cherry Lane | CA13 9HS |
| Cocker Lane | CA13 9NR |
| Coniston Drive | CA13 9JA |
| Crummock Avenue | CA13 9BQ |
| Culgarth Avenue | CA13 9PL |
| Culgarth Close | CA13 9PP |
| Dale Close | CA13 9ES |
| Dale View | CA13 9EN CA13 9EW |
| Deer Orchard Close | CA13 9JH |
| Ellermire Drive | CA13 9XD |
| Ennerdale Close | CA13 9BN |
| Etterby Close | CA13 9ER |
| Fell View | CA13 9PQ |
| Fold Brow | CA13 9AD |
| Gable Avenue | CA13 9BU |
| Grassmoor Avenue | CA13 9AF |
| Graysons Close | CA13 9FD |
| Green Bank Lane | CA13 9EF |
| Greenlands Court | CA13 9XF |
| Greyrigg Avenue | CA13 9EJ |
| Grisedale Place | CA13 9JE |
| Helvellyn Close | CA13 9BJ |
| Highfield Road | CA13 9JF |
| Howfoot Close | CA13 9ZB |
| Isel Road | CA13 9HJ CA13 9HT |
| John Street | CA13 9NX |
| Kirkbank | CA13 9NZ |
| Kirkfell Avenue | CA13 9AY CA13 9BD CA13 9BG |
| Kirkgate | CA13 9NS CA13 9NT CA13 9PH CA13 9PJ |
| Langdale Drive | CA13 9JB |
| Limetree Crescent | CA13 9HW |
| Lingfell Avenue | CA13 9BE |
| Linstock Avenue | CA13 9EG |
| Little Mill Close | CA13 9DB |
| Lodge Close | CA13 9ET |
| Longcroft | CA13 9AW |
| Lorton Road | CA13 9DF CA13 9DU CA13 9DX CA13 9DZ CA13 9EB CA13 9PG CA13 9XQ |
| Loweswater Close | CA13 9LL |
| Lowscales Drive | CA13 9DR CA13 9DS |
| Mackreth Row | CA13 9NU |
| Market Place | CA13 9LT CA13 9NF CA13 9NG CA13 9NH CA13 9NQ |
| Market Street | CA13 9NJ CA13 9NP |
| Meadow Bank Close | CA13 9AA |
| Meadow Grove | CA13 9PB |
| Melbreak Avenue | CA13 9AE CA13 9AN CA13 9AT |
| Millbrow Lane | CA13 9XT |
| Mosser Avenue | CA13 9BA |
| Norwood Drive | CA13 9EP |
| Oaktree Crescent | CA13 9HP CA13 9HR CA13 9HL |
| Old Hall Went | CA13 9NW |
| Parkhouse Lane | CA13 9XE |
| Peil Wyke | CA13 9YG |
| Pinfold Close | CA13 9JW |
| Rectory Gardens | CA13 9FE |
| Riverdale Drive | CA13 9EL |
| Rose Garth | CA13 9DD |
| Rose Lane | CA13 9DT CA13 9DW |
| Rydal Drive | CA13 9BL |
| Sandybeck Way | CA13 9XB |
| Scafell Close | CA13 9BP |
| Simonscales Lane | CA13 9DH CA13 9DJ CA13 9EH CA13 9TG CA13 9FB |
| Simpson Close | CA13 0QB |
| Skinner Street | CA13 9PE CA13 9PF |
| Slatefell Drive | CA13 9BH CA13 9BS CA13 9BT CA13 9BY |
| St Helens Close | CA13 9PN |
| St Helens Street | CA13 9HX CA13 9HZ CA13 9JG CA13 9JN |
| Strawberry How | CA13 9XZ |
| Strawberry How Road | CA13 9ZD |
| Strawberry Howe Road | CA13 9XR |
| Sunnyside | CA13 9NY |
| Sunscales Avenue | CA13 9DY |
| Swinside Close | CA13 9AB |
| Tanyard Garth | CA13 9JP |
| Tarn Close | CA13 9TQ |
| The Green | CA13 9AS |
| Thirlmere Avenue | CA13 9AG |
| Towers Lane | CA13 9EA CA13 9ED CA13 9EE |
| Tweed Mill Lane | CA13 9DE |
| Ullswater Drive | CA13 9LW |
| Vicarage Lane | CA13 9DG CA13 9DQ |
| Victoria Road | CA13 9PA CA13 9QN |
| Wasdale Close | CA13 9JD |
| Waste Fold Close | CA13 9JL |
| Waste Lane | CA13 9JQ |
| Whinfell Avenue | CA13 9AL |
| Whiteside Avenue | CA13 9AR |
| Willow Lane | CA13 9DP |
| Windmill Close | CA13 9BF |
| Windmill Lane | CA13 9AJ CA13 9AP CA13 9AQ CA13 9AU CA13 9AX |
| Woodside Avenue | CA13 9AZ CA13 9BB |
| Wordsworth Terrace | CA13 9AH |
| Wyndham Row | CA13 9EY |
| CA13 9SF CA13 0NG CA13 0QJ CA13 9HU CA13 9NE CA13 9SA CA13 9SG CA13 9SP CA13 9SQ CA13 9SR CA13 9TA CA13 9XJ CA13 9XN CA13 9XU CA13 9YR CA13 9YS CA13 9YW |
Transport near All Saints
- FAQ
- Price Paid By Year
- Property Type Price
Frequently asked questions about All Saints
What is the average price for a property for sale in All Saints?
The average price for a property for sale in All Saints is £266,687. This amount is 2% higher than the average price in Cockermouth. There are 965 property listings for sale in All Saints.
What streets have the most expensive properties for sale in All Saints?
The streets with the most expensive properties for sale in All Saints are Rose Garth at an average of £490,000, Strawberry How Road at an average of £485,250 and Millbrow Lane at an average of £485,000.
What streets have the most affordable properties for sale in All Saints?
The streets with the most affordable properties for sale in All Saints are Waste Lane at an average of £37,000, Market Place at an average of £93,166 and The Green at an average of £137,500.
Which train stations are available in or near All Saints?
Some of the train stations available in or near All Saints are Aspatria, Maryport and Flimby.
Property Price Paid in All Saints by Year
The average sold property price by year was:
| Year | Average Sold Price | Price Change |
Sold Properties
|
|---|---|---|---|
| 2025 | £261,890 | -6% |
69 Properties |
| 2024 | £277,897 | 7% |
77 Properties |
| 2023 | £259,189 | -6% |
71 Properties |
| 2022 | £274,396 | 7% |
85 Properties |
| 2021 | £255,799 | 11% |
77 Properties |
| 2020 | £226,701 | 1% |
64 Properties |
| 2019 | £225,553 | 1% |
112 Properties |
| 2018 | £222,532 | -1% |
137 Properties |
| 2017 | £224,644 | 3% |
94 Properties |
| 2016 | £217,293 | 8% |
64 Properties |
| 2015 | £199,977 | -3% |
72 Properties |
| 2014 | £206,242 | 8% |
77 Properties |
| 2013 | £189,046 | 0,4% |
73 Properties |
| 2012 | £188,277 | -14% |
61 Properties |
| 2011 | £214,068 | 14% |
49 Properties |
| 2010 | £183,542 | 3% |
69 Properties |
| 2009 | £177,990 | -18% |
47 Properties |
| 2008 | £209,980 | 7% |
61 Properties |
| 2007 | £194,398 | 5% |
104 Properties |
| 2006 | £184,337 | 3% |
117 Properties |
| 2005 | £177,903 | 19% |
81 Properties |
| 2004 | £143,996 | 10% |
77 Properties |
| 2003 | £129,240 | 24% |
105 Properties |
| 2002 | £98,741 | 19% |
99 Properties |
| 2001 | £79,678 | 1% |
101 Properties |
| 2000 | £78,921 | 5% |
91 Properties |
| 1999 | £74,658 | 7% |
103 Properties |
| 1998 | £69,087 | 2% |
104 Properties |
| 1997 | £67,474 | 3% |
93 Properties |
| 1996 | £65,667 | 14% |
110 Properties |
| 1995 | £56,359 | - |
82 Properties |
Property Price per Property Type in All Saints
Here you can find historic sold price data in order to help with your property search.
The average Property Paid Price for specific property types in the last three years are:
| Property Type | Average Sold Price | Sold Properties |
|---|---|---|
| Flat | £135,666.00 | 15 Flats |
| Semi Detached House | £240,378.00 | 88 Semi Detached Houses |
| Detached House | £357,792.00 | 73 Detached Houses |
| Terraced House | £208,876.00 | 41 Terraced Houses |

