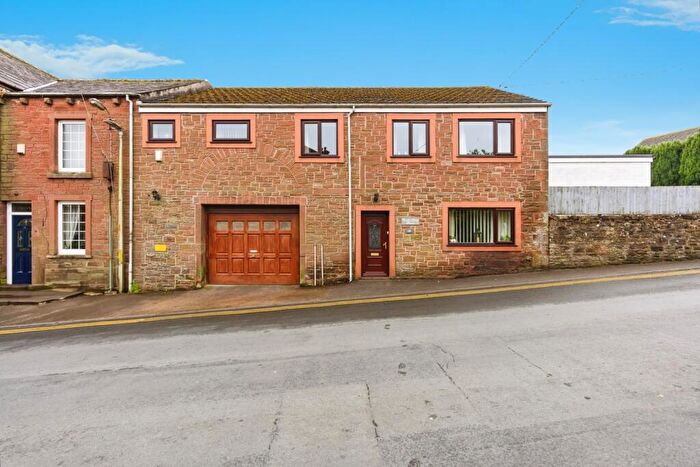
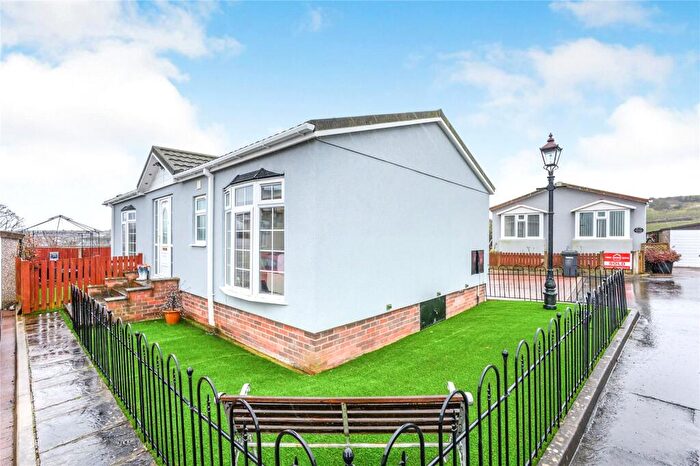
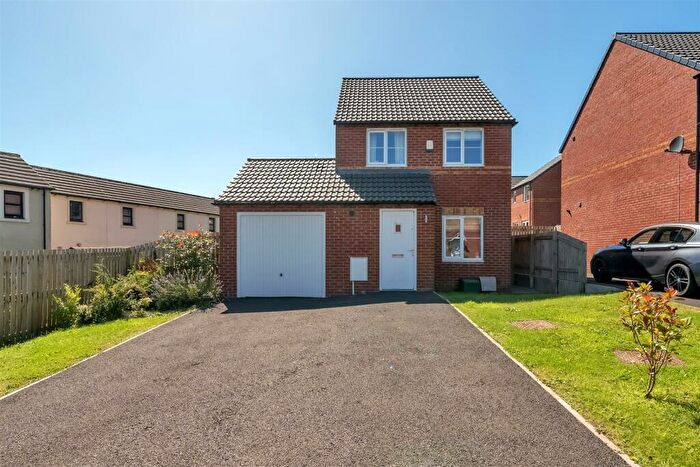
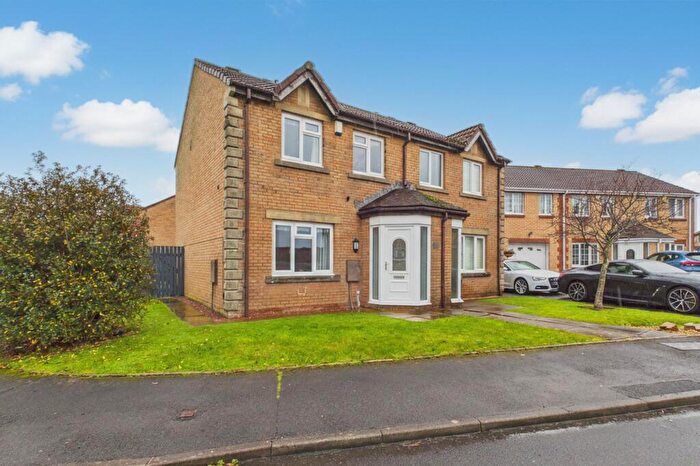
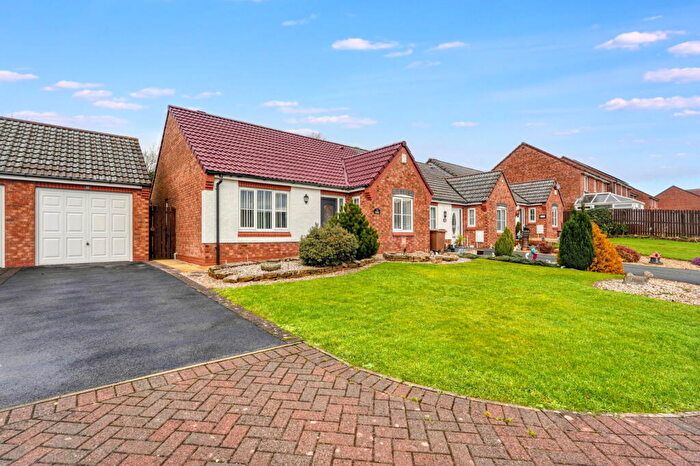
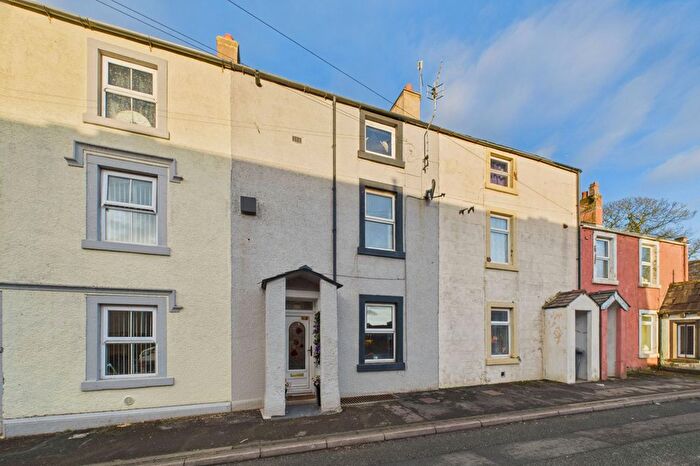
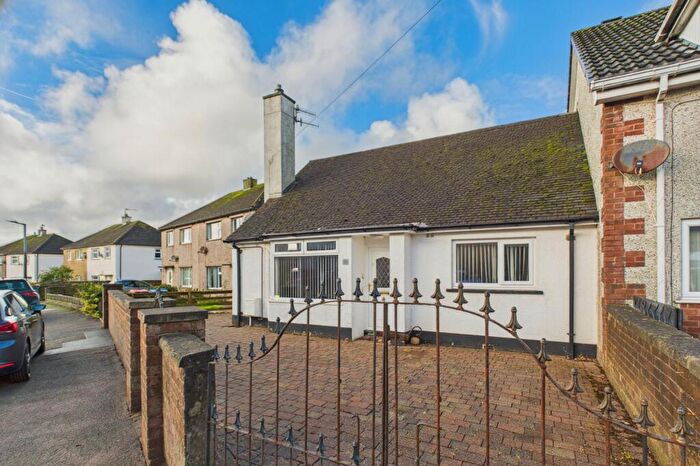
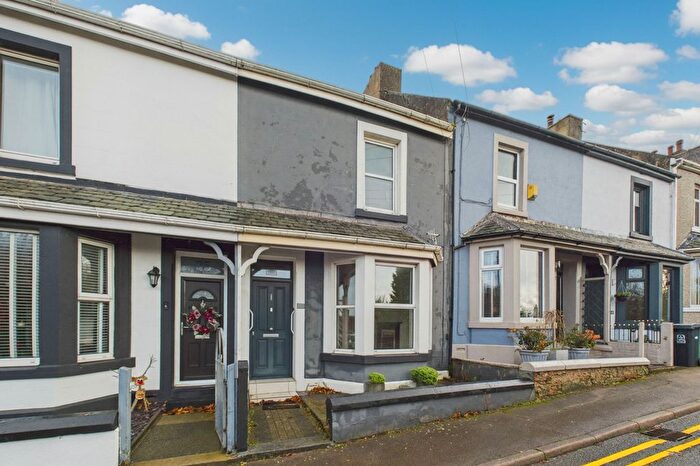
Houses for sale & to rent in Egremont, Egremont
House Prices in Egremont
Properties in Egremont have an average house price of £115,500.00 and had 2 Property Transactions within the last 3 years¹.
Egremont is an area in Egremont, Cumbria with 173 households², where the most expensive property was sold for £141,000.00.
Properties for sale in Egremont
Previously listed properties in Egremont
Roads and Postcodes in Egremont
Navigate through our locations to find the location of your next house in Egremont, Egremont for sale or to rent.
| Streets | Postcodes |
|---|---|
| Bank Lane | CA22 2BX |
| Bridge End | CA22 2RF CA22 2RQ |
| Bridge End Industrial Estate | CA22 2RB CA22 2RD |
| Castle Walk | CA22 2BY |
| Chapel Street | CA22 2DU |
| Chaucer Avenue | CA22 2FE |
| Church View | CA22 2DT CA22 2FF |
| Copeland Avenue | CA22 2QT |
| East Road | CA22 2EB |
| Florence Drive | CA22 2FJ |
| Garth Bank | CA22 2BP |
| Lamb Lane | CA22 2BZ |
| Main Street | CA22 2AA CA22 2DQ CA22 2FD |
| Market Street | CA22 2DF |
| Queens Drive | CA22 2JZ |
| Royal Drive | CA22 2LF |
| Salford Terrace | CA22 2DL |
| Spenser Close | CA22 2HE |
| St Bridgets Lane | CA22 2BD |
| Uldale View | CA22 2AL |
| Whitegate Court | CA22 2ES |
| CA22 2DZ CA22 2JN CA22 2LT CA22 2NF CA22 2QN CA22 2QQ CA22 2SY CA22 9AG CA22 9AH CA22 9AJ CA22 9AN CA22 9AP |
Transport near Egremont
- FAQ
- Price Paid By Year
- Property Type Price
Frequently asked questions about Egremont
What is the average price for a property for sale in Egremont?
The average price for a property for sale in Egremont is £115,500. This amount is 23% lower than the average price in Egremont. There are 407 property listings for sale in Egremont.
Which train stations are available in or near Egremont?
Some of the train stations available in or near Egremont are Nethertown, St.Bees and Braystones.
Property Price Paid in Egremont by Year
The average sold property price by year was:
| Year | Average Sold Price | Price Change |
Sold Properties
|
|---|---|---|---|
| 2024 | £141,000 | 36% |
1 Property |
| 2023 | £90,000 | 39% |
1 Property |
| 2022 | £54,950 | -27% |
1 Property |
| 2017 | £70,000 | 14% |
1 Property |
| 1998 | £60,000 | - |
1 Property |
Property Price per Property Type in Egremont
Here you can find historic sold price data in order to help with your property search.
The average Property Paid Price for specific property types in the last three years are:
| Property Type | Average Sold Price | Sold Properties |
|---|---|---|
| Semi Detached House | £141,000.00 | 1 Semi Detached House |
| Terraced House | £90,000.00 | 1 Terraced House |

