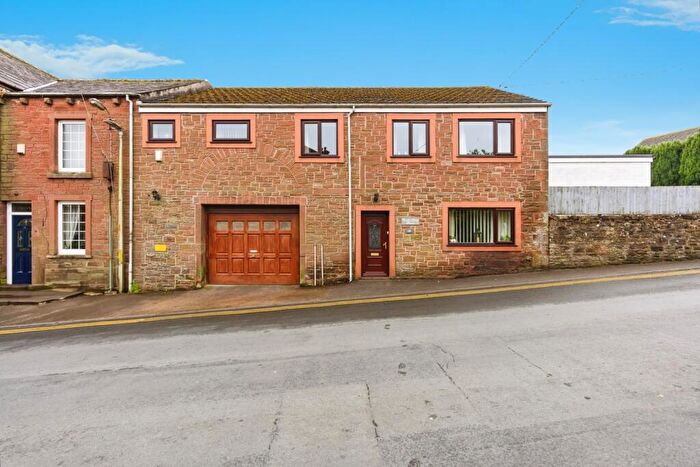
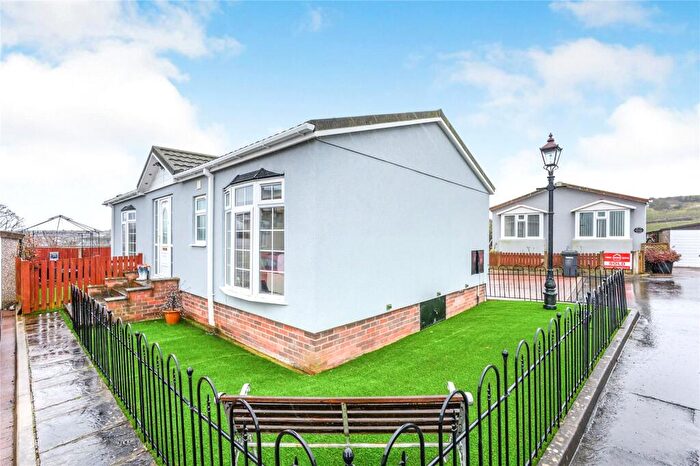
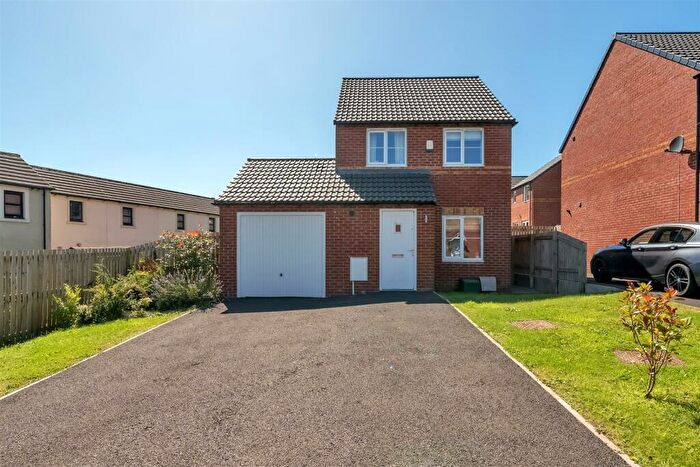
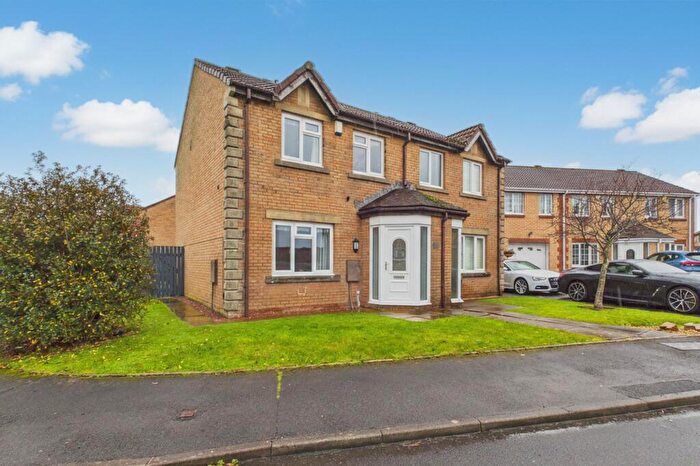
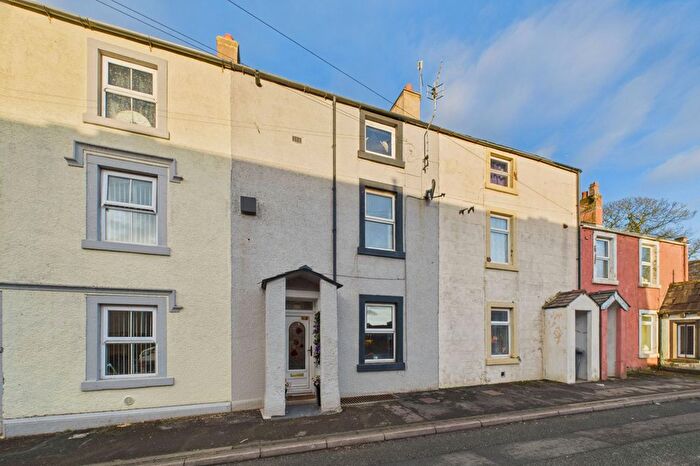
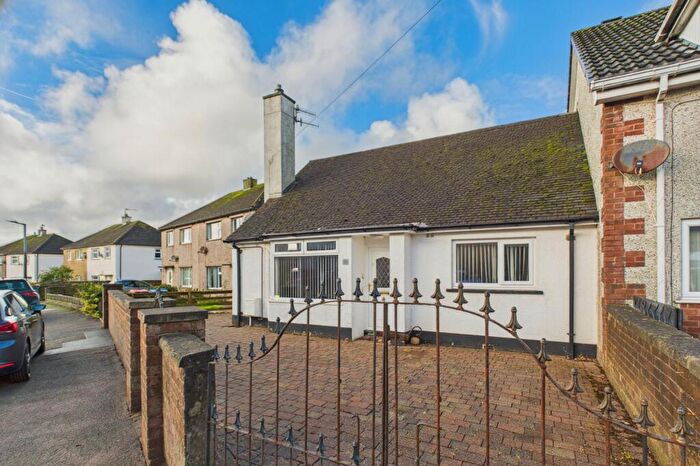
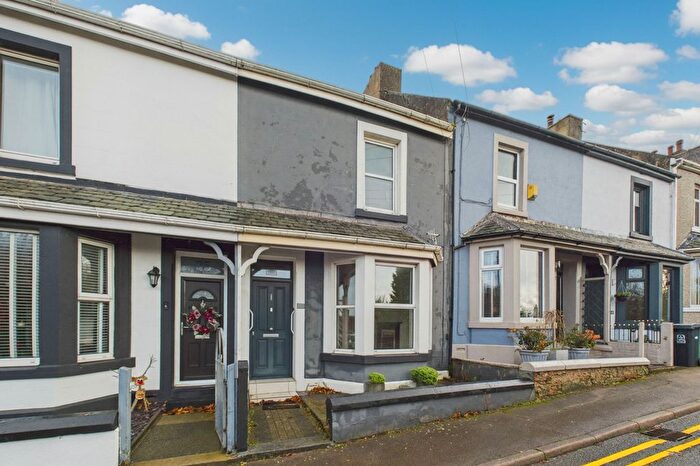
Houses for sale & to rent in Egremont South, Egremont
House Prices in Egremont South
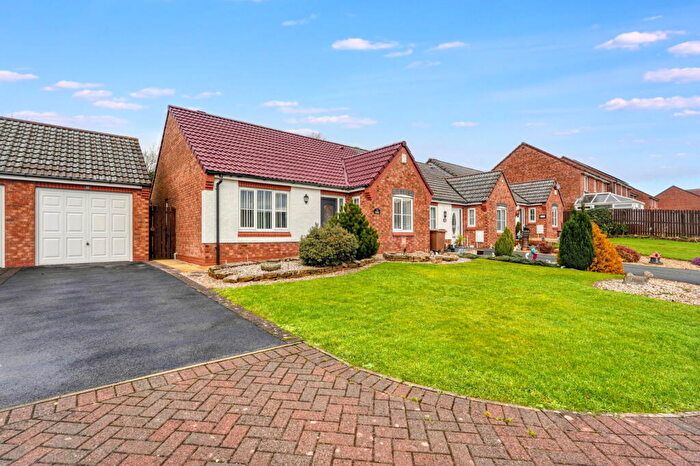
Properties in Egremont South have an average house price of £140,437.00 and had 149 Property Transactions within the last 3 years¹.
Egremont South is an area in Egremont, Cumbria with 1,628 households², where the most expensive property was sold for £630,000.00.
Properties for sale in Egremont South
Previously listed properties in Egremont South
Roads and Postcodes in Egremont South
Navigate through our locations to find the location of your next house in Egremont South, Egremont for sale or to rent.
| Streets | Postcodes |
|---|---|
| Ashley Way | CA22 2JT |
| Baybarrow Road | CA22 2NG |
| Beckgreen | CA22 2AS |
| Black Ling | CA22 2UB |
| Bookwell | CA22 2JP CA22 2JW CA22 2LS |
| Braithwaite Court | CA22 2DN |
| Bridge End | CA22 2RE |
| Bridge End Park | CA22 2RH |
| Brisco Mount | CA22 2EG |
| Brisco Road | CA22 2EJ CA22 2EQ |
| Castle Close | CA22 2JR |
| Castle View | CA22 2NA |
| Central Avenue | CA22 2BL |
| Chapel Street | CA22 2DS |
| Christy Place | CA22 2EW |
| Church Street | CA22 2AW |
| Cringlethwaite Terrace | CA22 2RN |
| Croft Terrace | CA22 2AT |
| Cross Side | CA22 2AP |
| Daleview Close | CA22 2LW |
| Daleview Gardens | CA22 2LN |
| Dent View | CA22 2ET |
| East Road | CA22 2ED CA22 2EF |
| Ehen Court Road | CA22 2DX |
| Fair View | CA22 2NQ |
| Fellview Drive | CA22 2JL |
| Gill Grove | CA22 2PL |
| Greendykes | CA22 2JS |
| Grove Road | CA22 2LU CA22 2LY |
| Hagget End | CA22 2LX |
| Hagget End Close | CA22 2LR |
| High Lea | CA22 2BT CA22 2BU |
| Kings Drive | CA22 2LA CA22 2LB CA22 2LD CA22 2LE |
| Kirksyde | CA22 2BW |
| Lamb Lane | CA22 2AH |
| Ling Road | CA22 2JU |
| Little Mill | CA22 2NN |
| Longcroft | CA22 2PT |
| Mackintosh Drive | CA22 2EN |
| Main Street | CA22 2AB CA22 2AD CA22 2DB CA22 2DJ CA22 2DR CA22 2DW |
| Market Place | CA22 2AE CA22 2AF CA22 2AG |
| Meadow View | CA22 2BG |
| Nelson Square | CA22 2BE |
| North Road | CA22 2PP CA22 2PR |
| Oddfellows Terrace | CA22 2PU |
| Old Bridge | CA22 2AZ |
| Park View | CA22 2BH CA22 2BJ |
| Parklands Drive | CA22 2JH |
| Queens Drive | CA22 2JX CA22 2JY |
| Riverside Drive | CA22 2EH |
| Rowntree Gardens | CA22 2ER |
| Royal Drive | CA22 2LG CA22 2LQ |
| Sandy Grove | CA22 2LZ |
| South Street | CA22 2AX CA22 2AY |
| Spedding Close | CA22 2DA |
| St Bridgets Lane | CA22 2BB |
| Station Close | CA22 2FB |
| Sunnyside | CA22 2BS |
| The Villas | CA22 2AU |
| Tower View | CA22 2BN |
| Tysons Lane | CA22 2BA |
| Uldale View | CA22 2LJ |
| Vale View | CA22 2RG |
| Westfield Drive | CA22 2JJ |
| Windrigg Close | CA22 2EE |
| Woodbank | CA22 2RL |
| Wyndham Place | CA22 2DY |
| Wyndham Terrace | CA22 2EA |
| Wyndham Way | CA22 2EP |
| CA22 2NE CA22 2NJ CA22 2NL CA22 2UD |
Transport near Egremont South
- FAQ
- Price Paid By Year
- Property Type Price
Frequently asked questions about Egremont South
What is the average price for a property for sale in Egremont South?
The average price for a property for sale in Egremont South is £140,437. This amount is 6% lower than the average price in Egremont. There are 407 property listings for sale in Egremont South.
What streets have the most expensive properties for sale in Egremont South?
The streets with the most expensive properties for sale in Egremont South are Parklands Drive at an average of £270,000, Riverside Drive at an average of £250,000 and Westfield Drive at an average of £250,000.
What streets have the most affordable properties for sale in Egremont South?
The streets with the most affordable properties for sale in Egremont South are Brisco Road at an average of £70,100, St Bridgets Lane at an average of £77,500 and Brisco Mount at an average of £78,987.
Which train stations are available in or near Egremont South?
Some of the train stations available in or near Egremont South are Nethertown, St.Bees and Braystones.
Property Price Paid in Egremont South by Year
The average sold property price by year was:
| Year | Average Sold Price | Price Change |
Sold Properties
|
|---|---|---|---|
| 2025 | £153,022 | 8% |
45 Properties |
| 2024 | £141,397 | 10% |
55 Properties |
| 2023 | £127,803 | -5% |
49 Properties |
| 2022 | £134,012 | 2% |
55 Properties |
| 2021 | £131,858 | 7% |
63 Properties |
| 2020 | £122,504 | 12% |
69 Properties |
| 2019 | £107,936 | -23% |
65 Properties |
| 2018 | £132,535 | 13% |
55 Properties |
| 2017 | £115,297 | 5% |
58 Properties |
| 2016 | £109,260 | 3% |
60 Properties |
| 2015 | £105,657 | -7% |
57 Properties |
| 2014 | £112,863 | 14% |
50 Properties |
| 2013 | £97,092 | -7% |
46 Properties |
| 2012 | £104,237 | -0,4% |
46 Properties |
| 2011 | £104,636 | -3% |
49 Properties |
| 2010 | £107,927 | 2% |
48 Properties |
| 2009 | £105,980 | -1% |
43 Properties |
| 2008 | £106,897 | 1% |
40 Properties |
| 2007 | £105,314 | -5% |
85 Properties |
| 2006 | £110,793 | 9% |
108 Properties |
| 2005 | £100,424 | 15% |
95 Properties |
| 2004 | £84,859 | 27% |
74 Properties |
| 2003 | £61,801 | 15% |
90 Properties |
| 2002 | £52,421 | 13% |
79 Properties |
| 2001 | £45,366 | -12% |
68 Properties |
| 2000 | £50,743 | 21% |
47 Properties |
| 1999 | £39,936 | -8% |
62 Properties |
| 1998 | £43,221 | 11% |
54 Properties |
| 1997 | £38,483 | -26% |
55 Properties |
| 1996 | £48,426 | 2% |
62 Properties |
| 1995 | £47,232 | - |
62 Properties |
Property Price per Property Type in Egremont South
Here you can find historic sold price data in order to help with your property search.
The average Property Paid Price for specific property types in the last three years are:
| Property Type | Average Sold Price | Sold Properties |
|---|---|---|
| Semi Detached House | £142,191.00 | 47 Semi Detached Houses |
| Detached House | £244,122.00 | 24 Detached Houses |
| Terraced House | £111,871.00 | 71 Terraced Houses |
| Flat | £62,914.00 | 7 Flats |

