
Houses for sale in Grange-over-sands, Cumbria
House Prices in Grange-over-sands
Properties in Grange-over-sands have an average house price of £315k and had 591 Property Transactions within the last 3 years.¹
Grange-over-sands is an area in Cumbria with 4,778 households², where the most expensive property was sold for £1.8M.
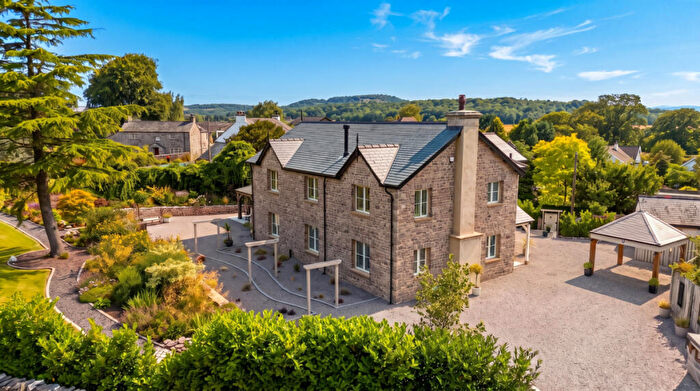
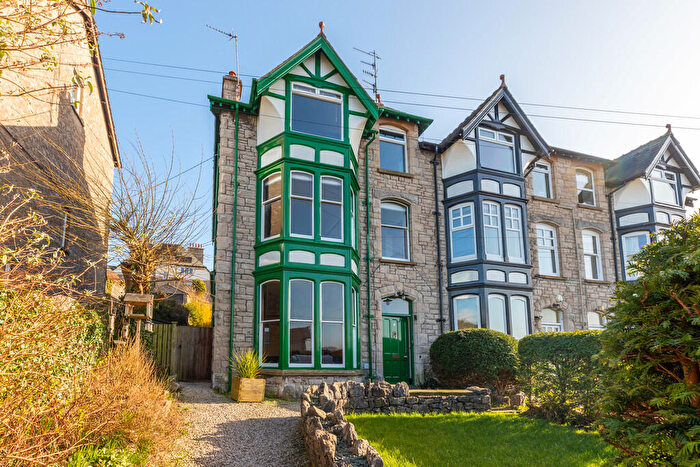
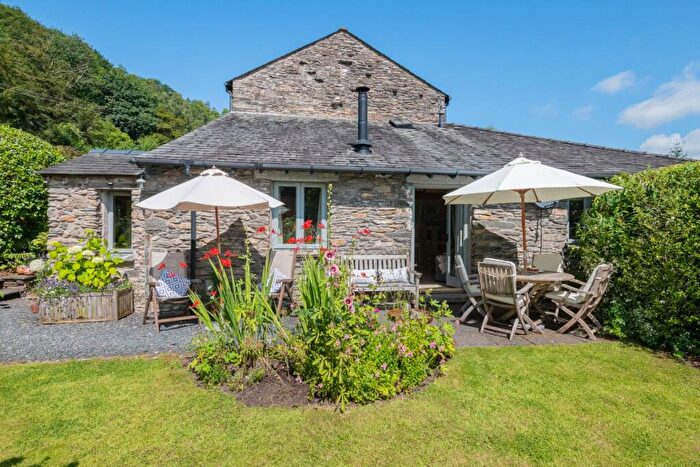
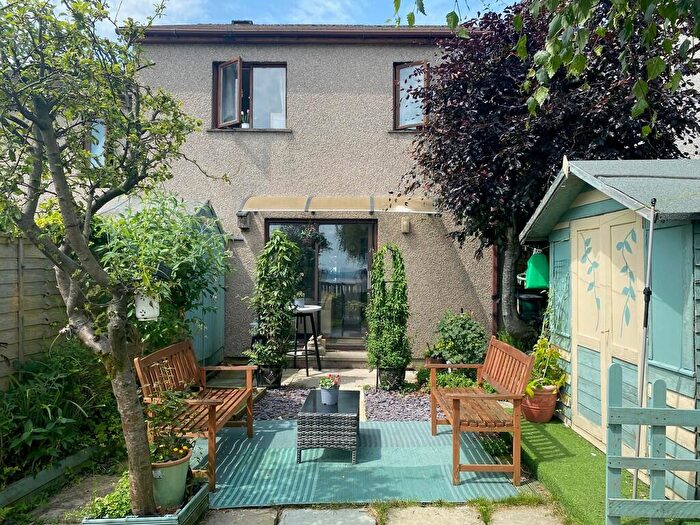
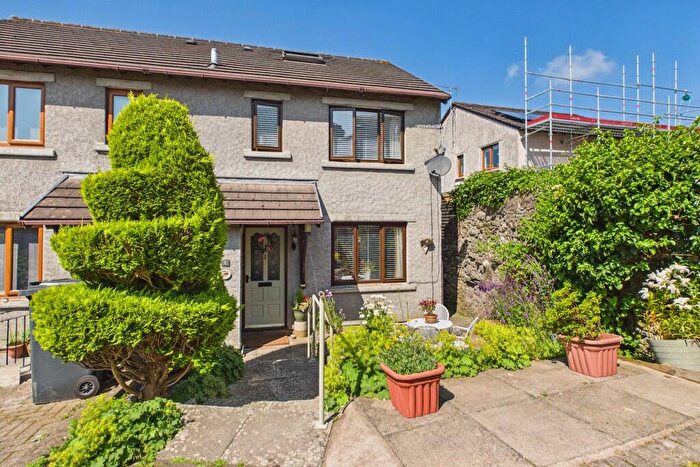
Properties for sale in Grange-over-sands

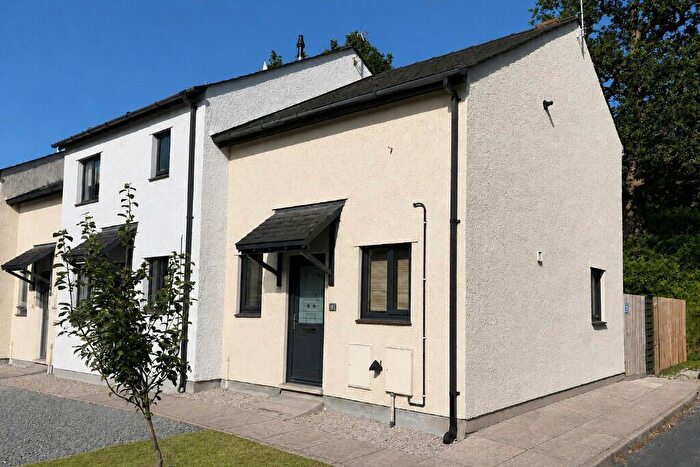
![]()
If you are looking to sell your house, let it out, or receive a property valuation, an expert can help you.
Click the button below to get started.

Neighbourhoods in Grange-over-sands
Navigate through our locations to find the location of your next house in Grange-over-sands, Cumbria for sale or to rent.
Property price trends in Grange-over-sands
According to the latest Land Registry data, the average home in Grange-over-sands sold for £391,714 in 2026. That figure comes from a substantial record of 7,279 sales logged over the past 31 years.
Prices have continued to climb over the last three years. Compared with 2023, when the typical sale came in around £317,633, that's a rise of roughly 23.3%.
Looking back five years, average prices are up about 29.1% since 2021, a gain of around £88,301 in cash terms.
Zoom out to the past decade for the fuller picture. Back in 2016, homes here averaged £230,533, so the typical sold price has climbed about 69.9% since then, roughly 5.4% a year. Stretch the view to fifteen years and that annual pace eases back to about 4.1%.
Frequently asked questions about Grange-over-sands
What is the average price for a property for sale in Grange-over-sands?
The average price for a property for sale in Grange-over-sands is £315,019. This amount is 41% higher than the average price in Cumbria. There are 882 property listings for sale in Grange-over-sands.
What locations have the most expensive properties for sale in Grange-over-sands?
The locations with the most expensive properties for sale in Grange-over-sands are Staveley-in-cartmel at an average of £446,215, Lyth Valley at an average of £368,194 and Grange South at an average of £365,478.
What locations have the most affordable properties for sale in Grange-over-sands?
The locations with the most affordable properties for sale in Grange-over-sands are Holker at an average of £249,211, Grange North at an average of £255,092 and Cartmel at an average of £338,520.
Which train stations are available in or near Grange-over-sands?
Some of the train stations available in or near Grange-over-sands are Grange-Over-Sands, Kents Bank and Cark and Cartmel.
Property Price Paid in Grange-over-sands by Year
The average sold property price by year was:
| Year | Average Sold Price | Price Change |
Sold Properties
|
|---|---|---|---|
| 2026 | £391,714 | 23% |
7 Properties |
| 2025 | £302,193 | -6% |
169 Properties |
| 2024 | £320,461 | 1% |
193 Properties |
| 2023 | £317,633 | 5% |
222 Properties |
| 2022 | £302,357 | -0,3% |
206 Properties |
| 2021 | £303,413 | 6% |
269 Properties |
| 2020 | £284,315 | 10% |
219 Properties |
| 2019 | £256,812 | 2% |
232 Properties |
| 2018 | £251,898 | 1% |
282 Properties |
| 2017 | £249,768 | 8% |
263 Properties |
Property Price per Property Type in Grange-over-sands
Here you can find historic sold price data in order to help with your property search.
The average Property Paid Price for specific property types in the last three years are:
| Property Type | Average Sold Price | Sold Properties |
|---|---|---|
| Semi Detached House | £306,732.00 | 123 Semi Detached Houses |
| Detached House | £422,855.00 | 240 Detached Houses |
| Terraced House | £227,778.00 | 96 Terraced Houses |
| Flat | £190,123.00 | 132 Flats |
Transport in Grange-over-sands
Please see below transportation links in this area:
