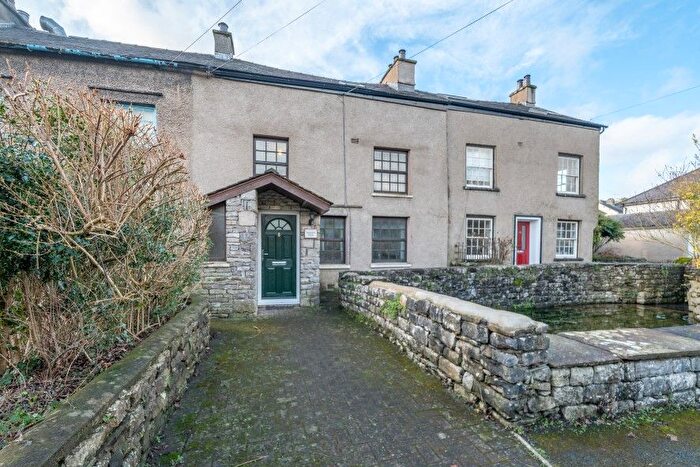
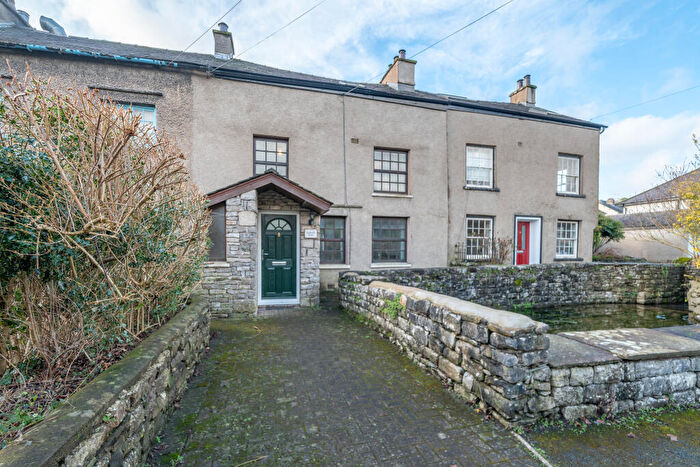
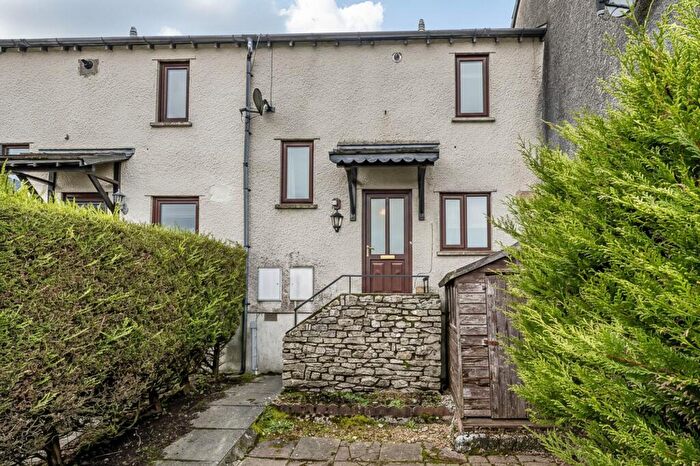
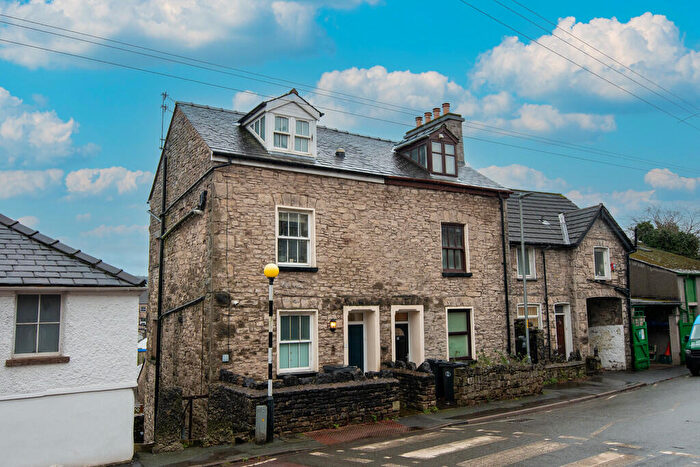
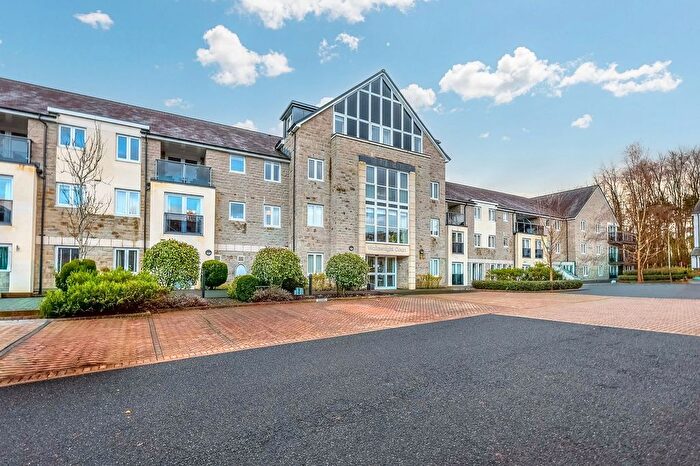
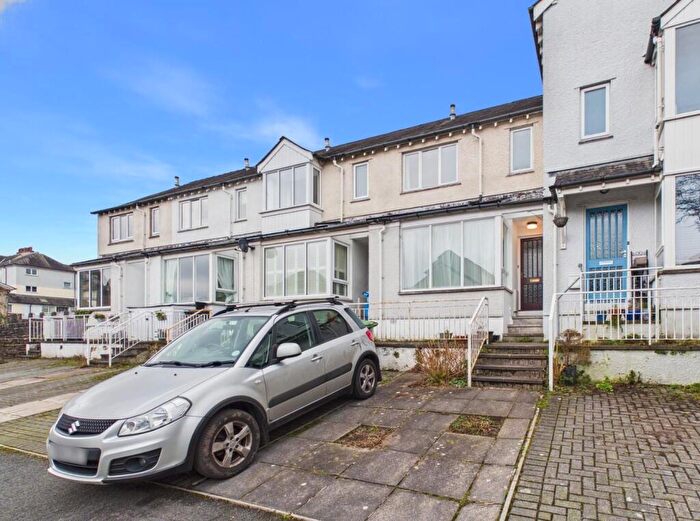
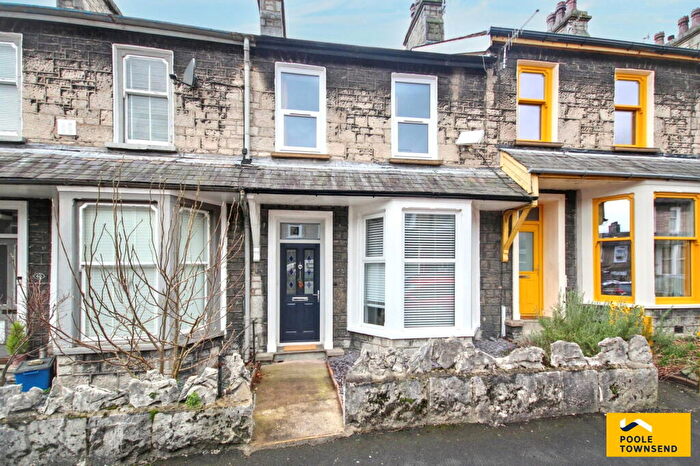
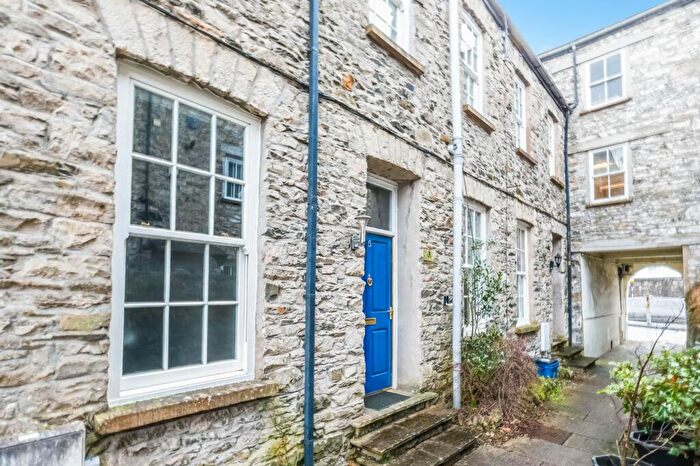
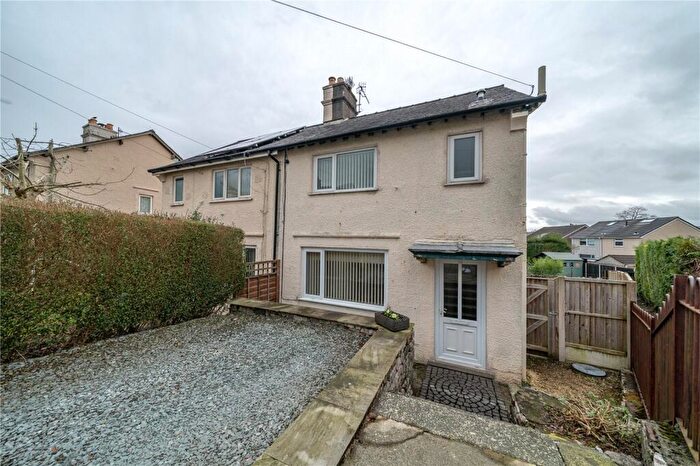
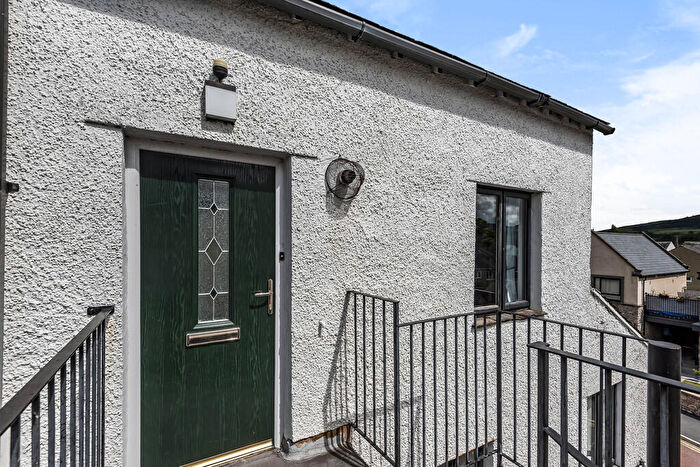
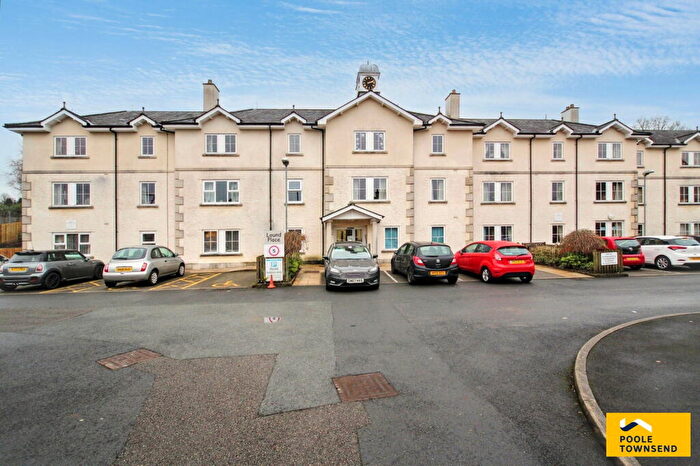
Houses for sale & to rent in Kendal Kirkland, Kendal
House Prices in Kendal Kirkland
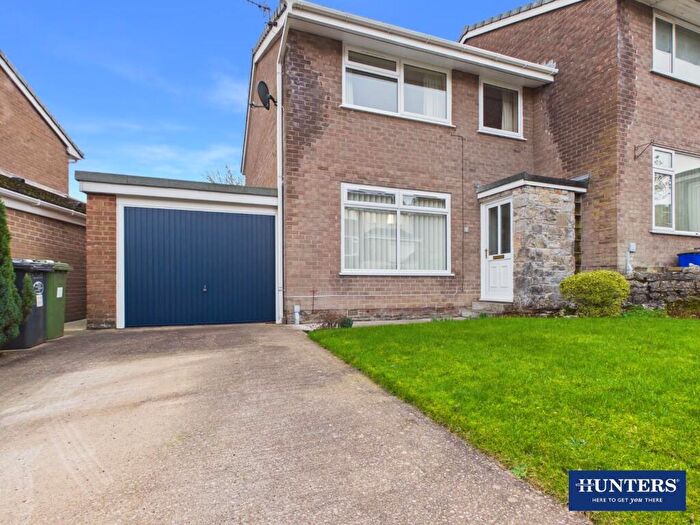
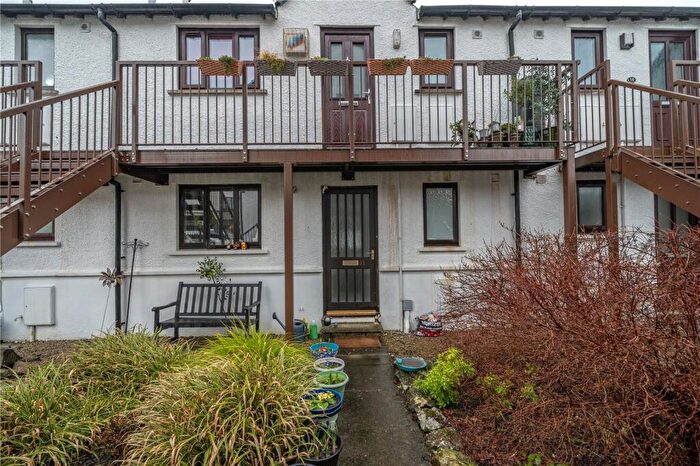
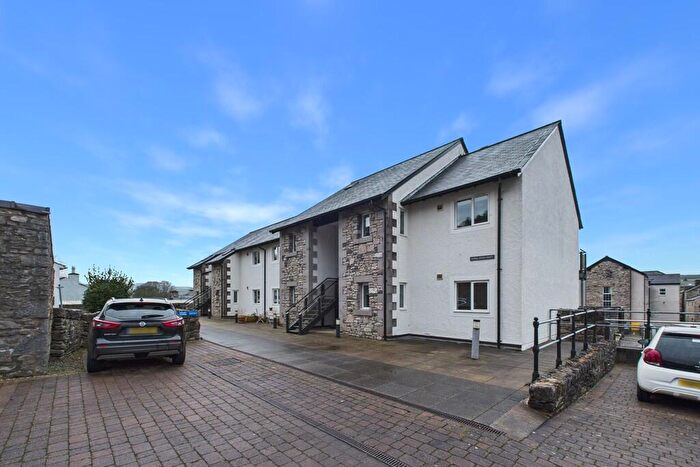
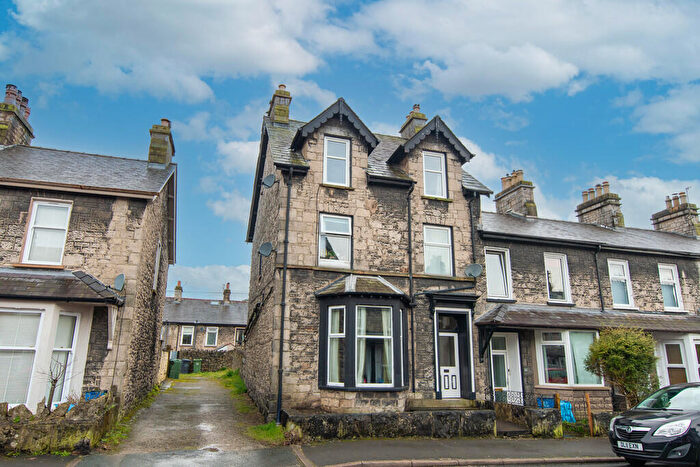
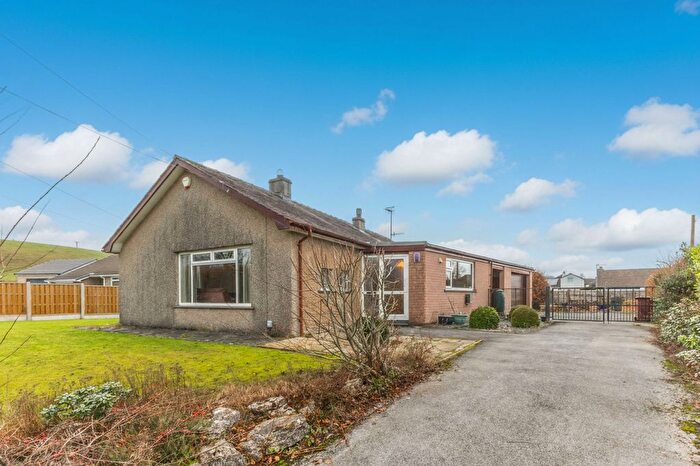
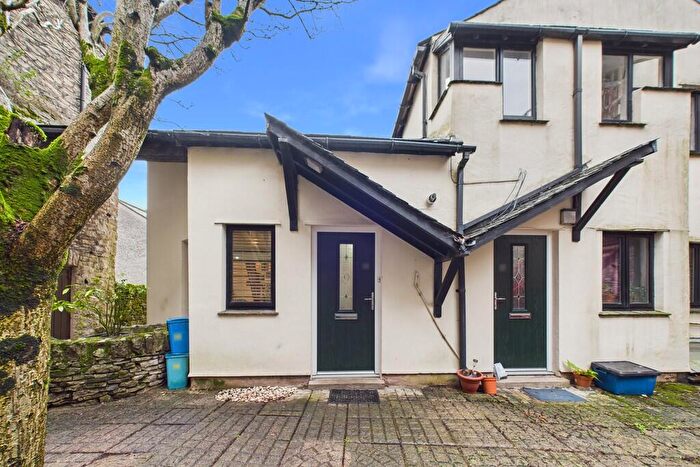
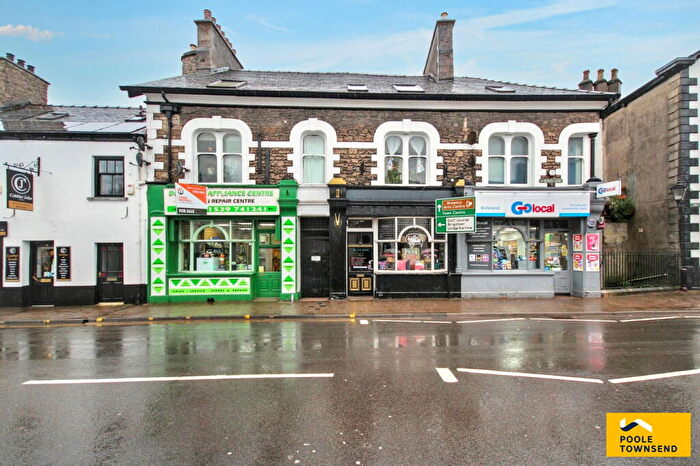
Properties in Kendal Kirkland have an average house price of £224,700.00 and had 80 Property Transactions within the last 3 years¹.
Kendal Kirkland is an area in Kendal, Cumbria with 890 households², where the most expensive property was sold for £421,000.00.
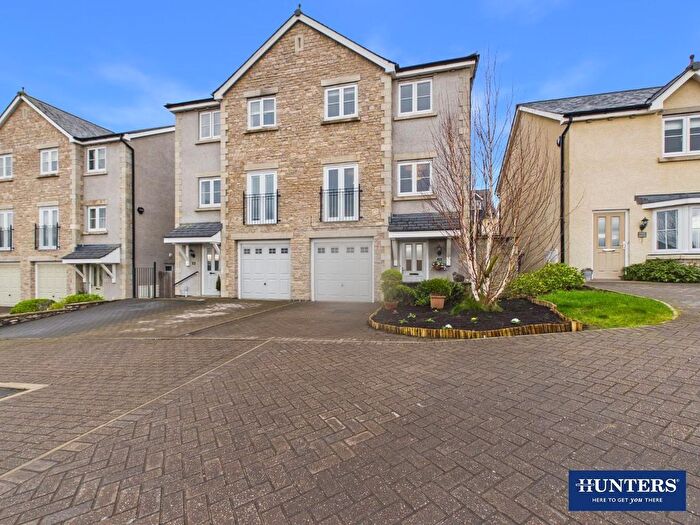
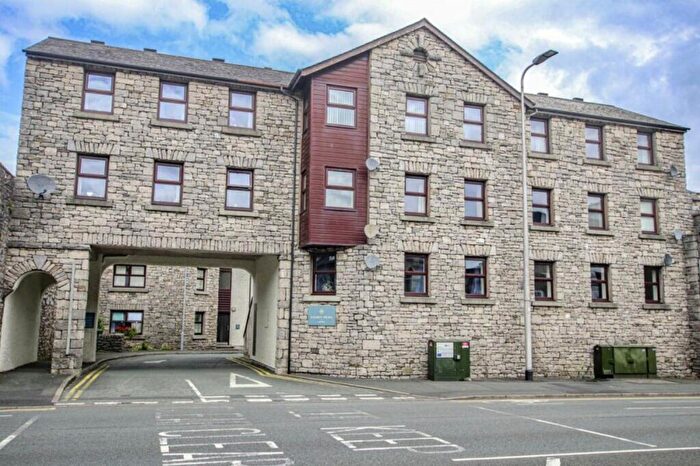
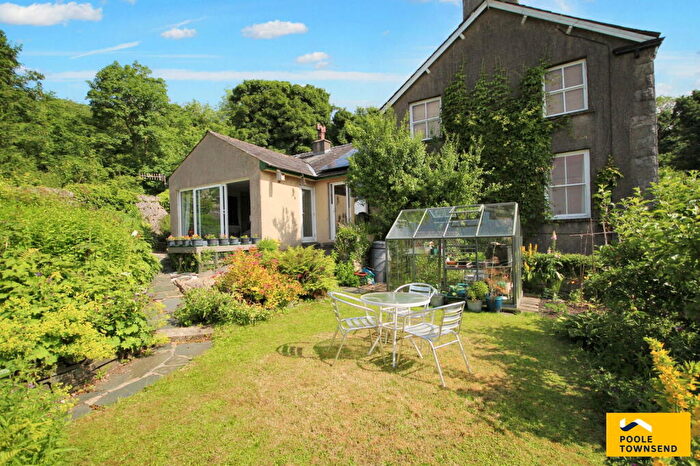
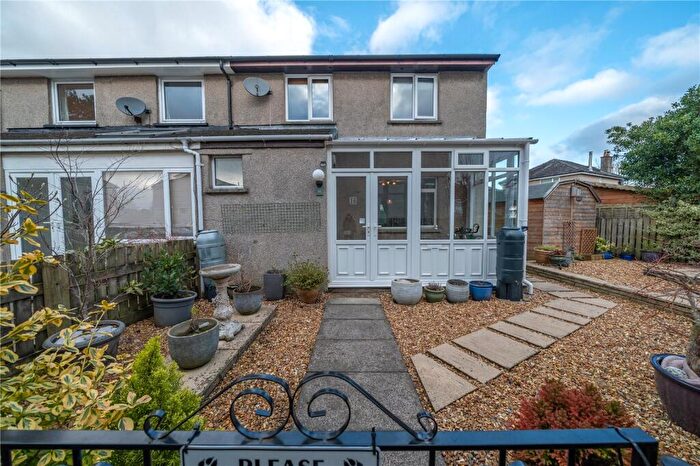
Properties for sale in Kendal Kirkland
Roads and Postcodes in Kendal Kirkland
Navigate through our locations to find the location of your next house in Kendal Kirkland, Kendal for sale or to rent.
| Streets | Postcodes |
|---|---|
| Anchorite Fields | LA9 5NG |
| Anchorite Place | LA9 5AT |
| Anchorite Road | LA9 5ND LA9 5NF LA9 5NQ |
| Brockbeck | LA9 5LG |
| Buttery Well Road | LA9 5LE |
| Chapel Lane | LA9 5LA |
| Cock & Dolphin Yard | LA9 5FE |
| Echo Bank | LA9 5LY |
| Echo Barn Hill | LA9 5NA |
| Gilling Grove | LA9 5LF |
| Glebe Rise | LA9 5BH |
| Glebe Road | LA9 5BY LA9 5DB |
| Greengate | LA9 5LJ |
| Greengate Lane | LA9 5LL LA9 5LQ LA9 5LX |
| Hill Close | LA9 5LW |
| Kent Court | LA9 5AN |
| Kirkbarrow | LA9 5DD LA9 5DE |
| Kirkbarrow Lane | LA9 5DF |
| Kirkland | LA9 5AB LA9 5AD LA9 5AP |
| Long Close | LA9 5LZ |
| Low Kirkbarrow Lane | LA9 5DG |
| Milnthorpe Road | LA9 5AU LA9 5AX |
| The Old Apple Yard | LA9 5LB |
| Vicarage Drive | LA9 5AZ LA9 5BA LA9 5BX |
| Vicars Fields | LA9 5NB |
| Vicars Garth | LA9 5NE |
| Vicars Hill | LA9 5DA |
| Vicars Walk | LA9 5BZ |
| Well Ings | LA9 5LN |
| Westwood Avenue | LA9 5BB |
Transport near Kendal Kirkland
- FAQ
- Price Paid By Year
- Property Type Price
Frequently asked questions about Kendal Kirkland
What is the average price for a property for sale in Kendal Kirkland?
The average price for a property for sale in Kendal Kirkland is £224,700. This amount is 26% lower than the average price in Kendal. There are 1,158 property listings for sale in Kendal Kirkland.
What streets have the most expensive properties for sale in Kendal Kirkland?
The streets with the most expensive properties for sale in Kendal Kirkland are Westwood Avenue at an average of £313,375, Vicarage Drive at an average of £306,237 and Glebe Road at an average of £241,820.
What streets have the most affordable properties for sale in Kendal Kirkland?
The streets with the most affordable properties for sale in Kendal Kirkland are Kent Court at an average of £56,500, Kirkland at an average of £115,875 and Cock & Dolphin Yard at an average of £167,546.
Which train stations are available in or near Kendal Kirkland?
Some of the train stations available in or near Kendal Kirkland are Kendal, Oxenholme Lake District and Burneside.
Property Price Paid in Kendal Kirkland by Year
The average sold property price by year was:
| Year | Average Sold Price | Price Change |
Sold Properties
|
|---|---|---|---|
| 2025 | £215,427 | -3% |
25 Properties |
| 2024 | £221,044 | -7% |
25 Properties |
| 2023 | £235,475 | 20% |
30 Properties |
| 2022 | £188,438 | 6% |
25 Properties |
| 2021 | £177,902 | -8% |
40 Properties |
| 2020 | £192,122 | 31% |
24 Properties |
| 2019 | £132,565 | -12% |
23 Properties |
| 2018 | £148,681 | -12% |
29 Properties |
| 2017 | £166,808 | 2% |
28 Properties |
| 2016 | £162,957 | 12% |
43 Properties |
| 2015 | £143,105 | 17% |
29 Properties |
| 2014 | £119,230 | -20% |
28 Properties |
| 2013 | £142,886 | 6% |
22 Properties |
| 2012 | £133,935 | -4% |
32 Properties |
| 2011 | £139,080 | -1% |
23 Properties |
| 2010 | £141,121 | 4% |
16 Properties |
| 2009 | £135,129 | -4% |
22 Properties |
| 2008 | £139,972 | -5% |
18 Properties |
| 2007 | £146,345 | 5% |
44 Properties |
| 2006 | £138,986 | 6% |
53 Properties |
| 2005 | £130,200 | 5% |
31 Properties |
| 2004 | £123,591 | 25% |
30 Properties |
| 2003 | £92,204 | 17% |
42 Properties |
| 2002 | £76,915 | 21% |
45 Properties |
| 2001 | £60,782 | 13% |
39 Properties |
| 2000 | £53,108 | 4% |
43 Properties |
| 1999 | £50,740 | -1% |
46 Properties |
| 1998 | £51,044 | 14% |
30 Properties |
| 1997 | £43,740 | 6% |
33 Properties |
| 1996 | £41,073 | 7% |
29 Properties |
| 1995 | £38,142 | - |
14 Properties |
Property Price per Property Type in Kendal Kirkland
Here you can find historic sold price data in order to help with your property search.
The average Property Paid Price for specific property types in the last three years are:
| Property Type | Average Sold Price | Sold Properties |
|---|---|---|
| Semi Detached House | £237,529.00 | 45 Semi Detached Houses |
| Detached House | £330,400.00 | 9 Detached Houses |
| Terraced House | £205,777.00 | 18 Terraced Houses |
| Flat | £76,199.00 | 8 Flats |

