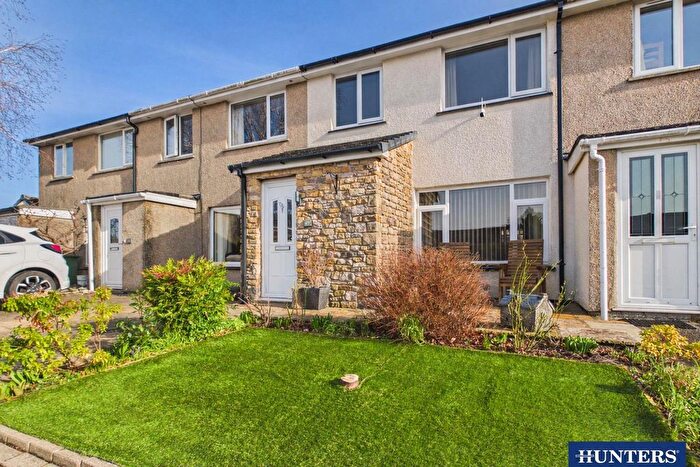
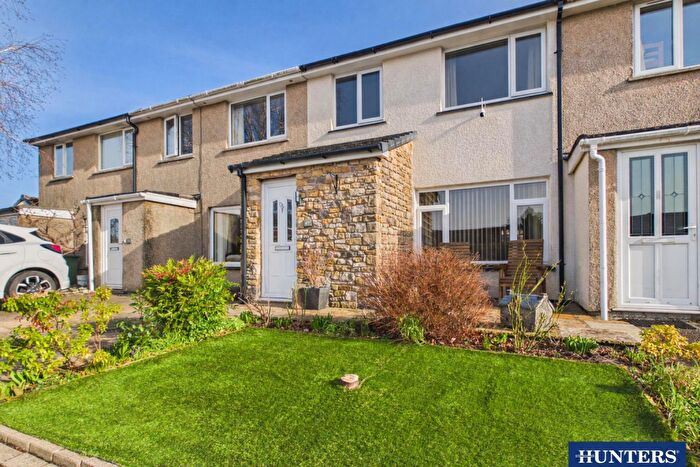
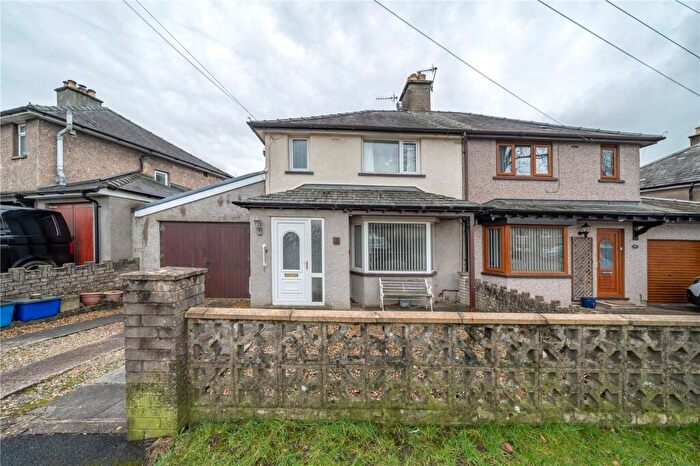
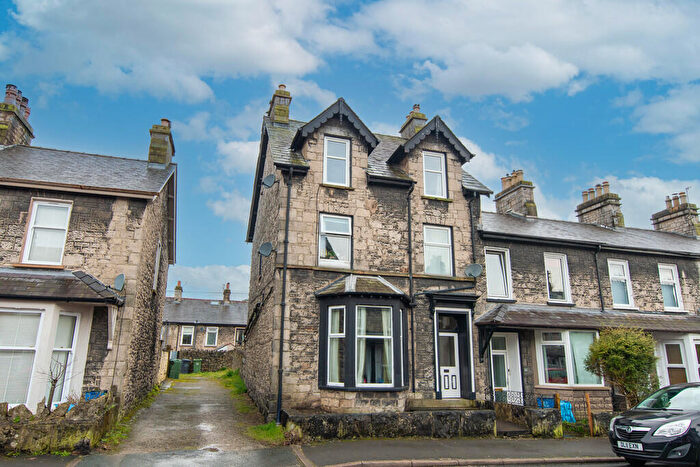
Houses for sale & to rent in Kendal Nether, Kendal
House Prices in Kendal Nether
Properties in Kendal Nether have an average house price of £295,094.00 and had 74 Property Transactions within the last 3 years¹.
Kendal Nether is an area in Kendal, Cumbria with 873 households², where the most expensive property was sold for £477,003.00.
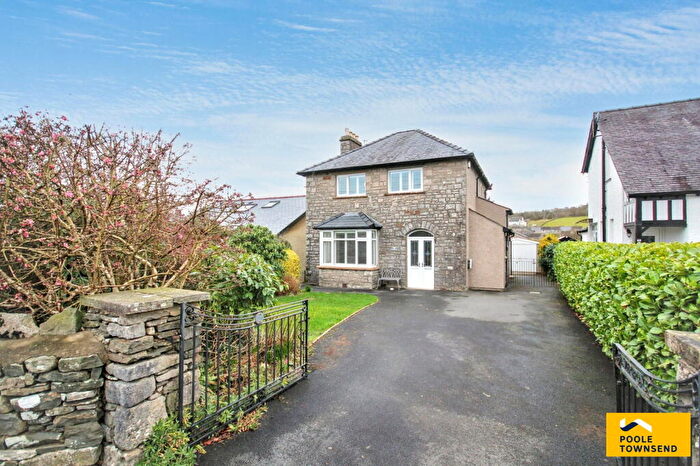
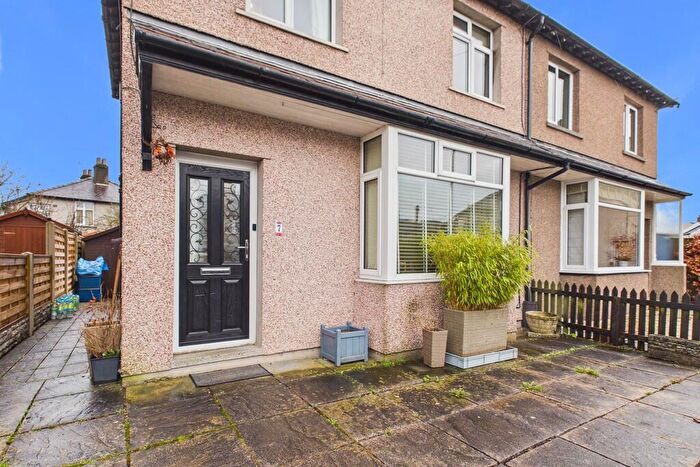
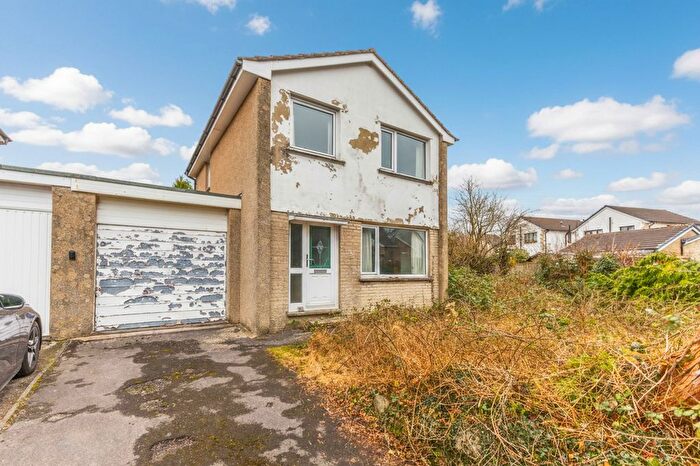
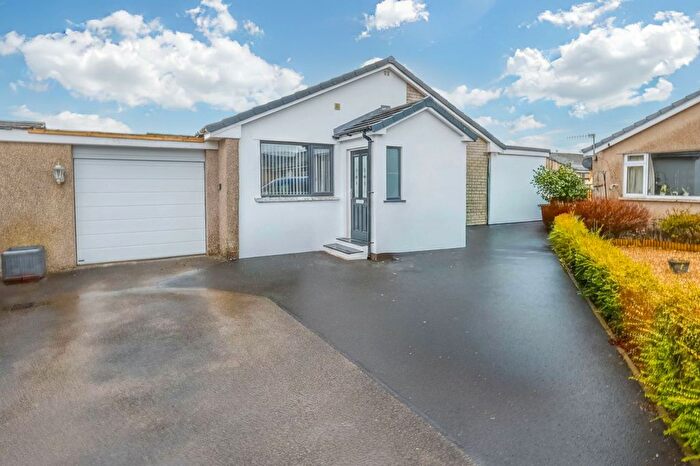
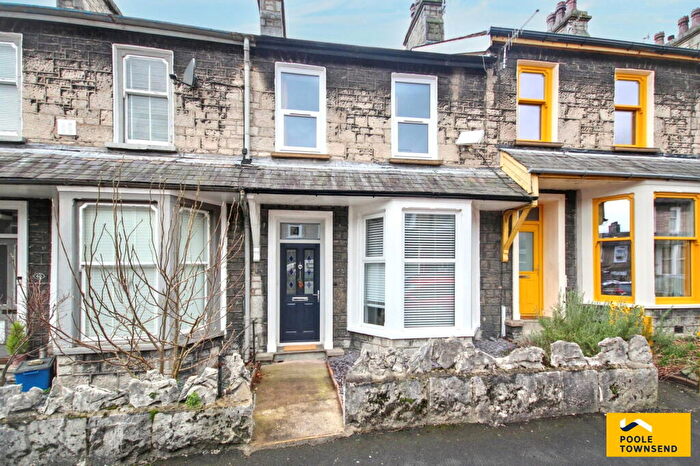
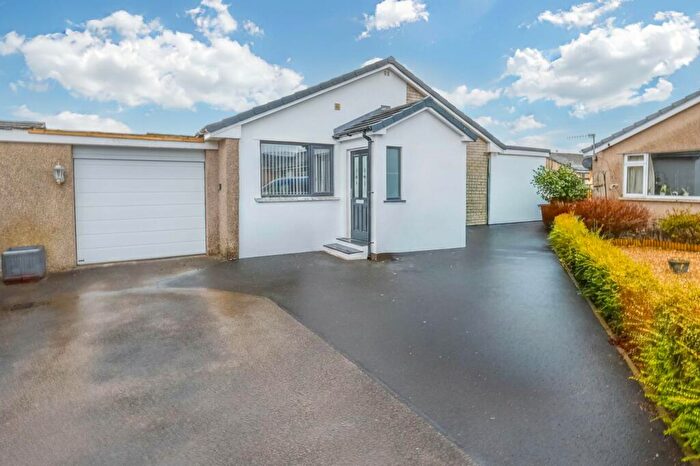
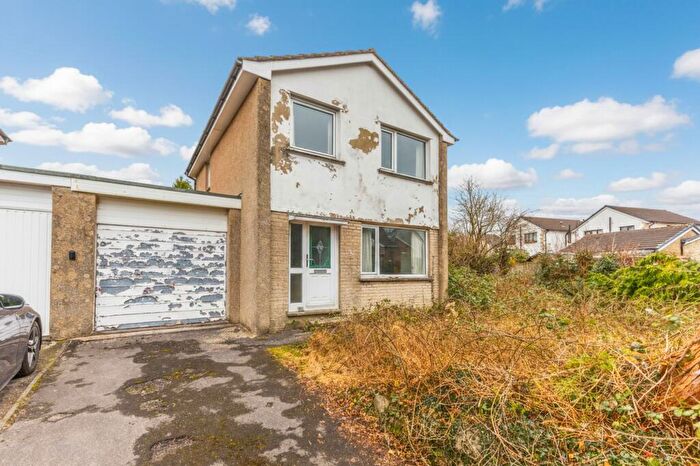
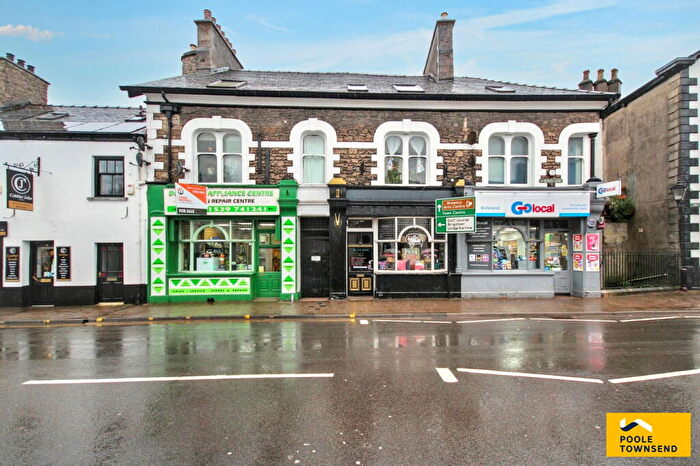
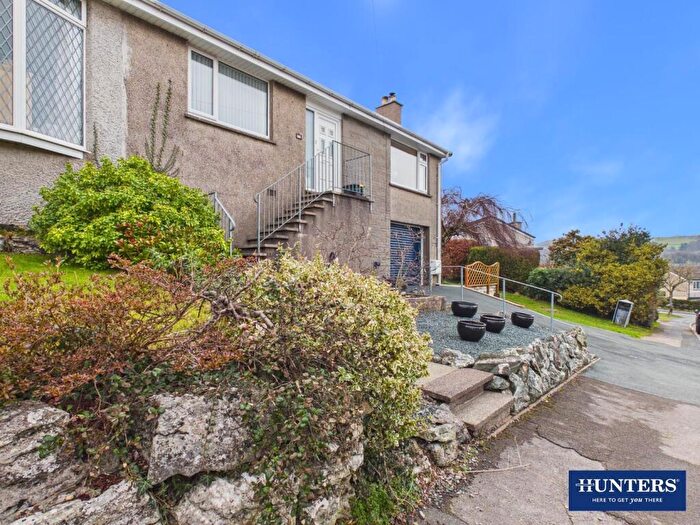
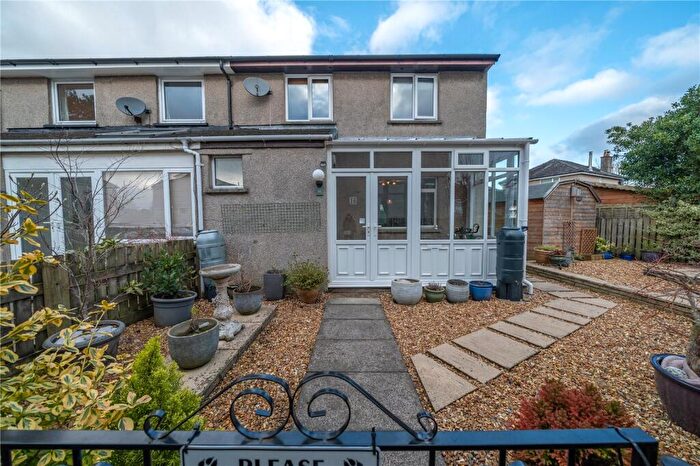
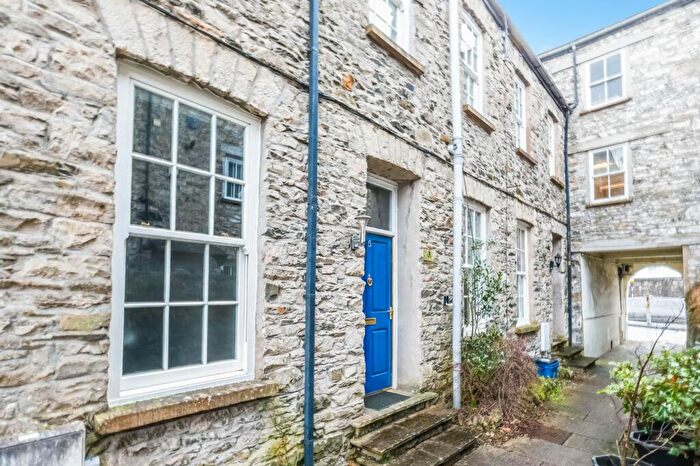
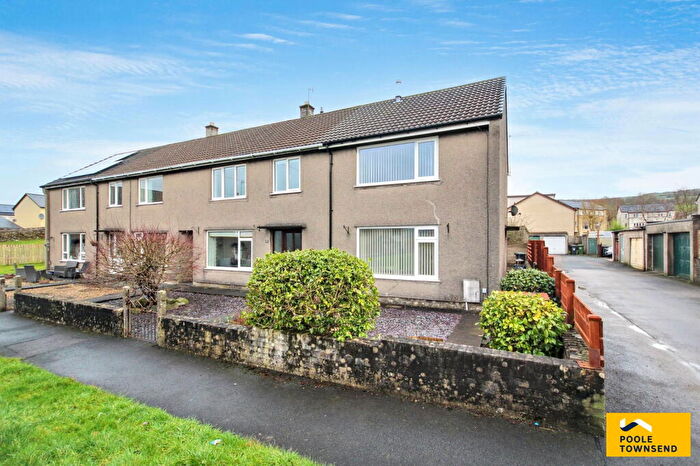
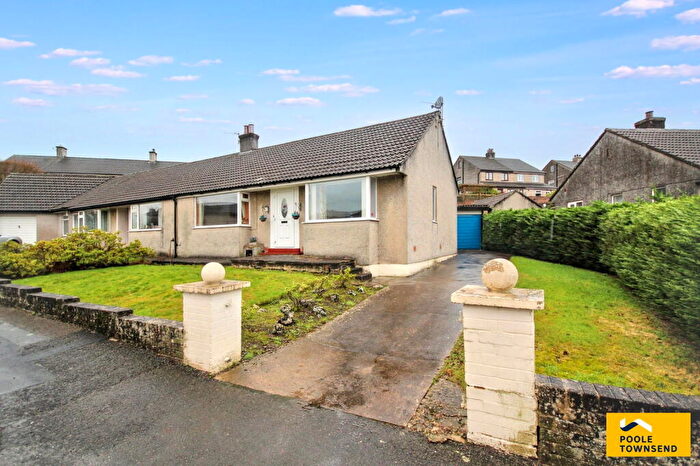
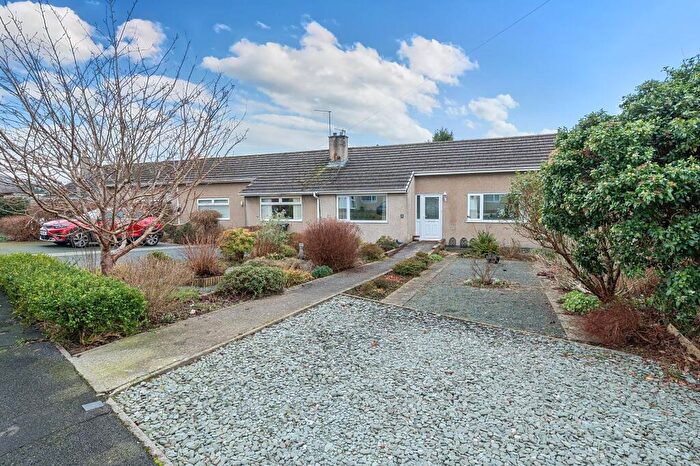
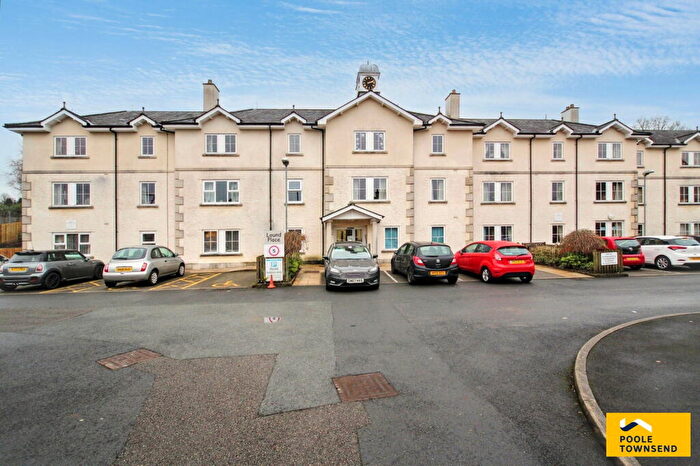
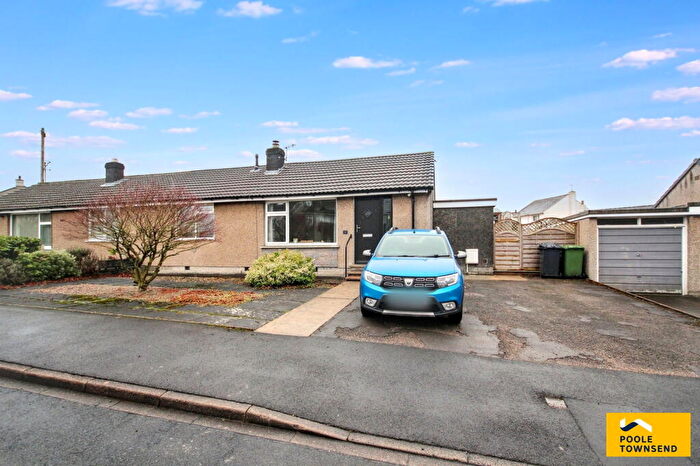
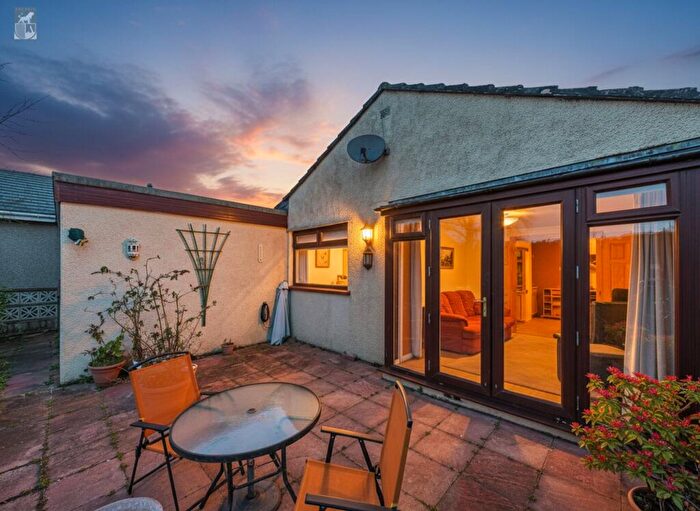
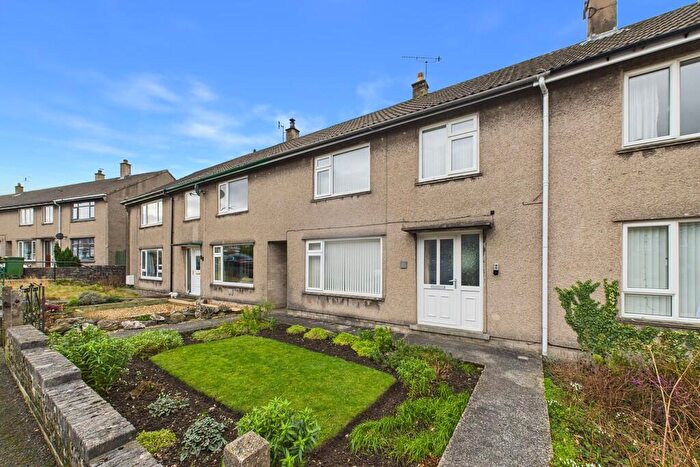
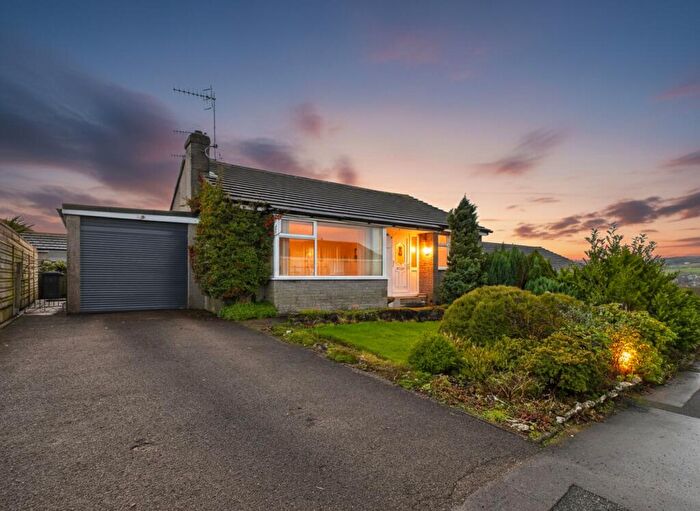
Properties for sale in Kendal Nether
Roads and Postcodes in Kendal Nether
Navigate through our locations to find the location of your next house in Kendal Nether, Kendal for sale or to rent.
| Streets | Postcodes |
|---|---|
| Archers Meadow | LA9 7DY |
| Aynam Place | LA9 7DP |
| Aynam Road | LA9 7DW LA9 7EL |
| Birkbeck Close | LA9 7PW |
| Castle Circle | LA9 7BB |
| Castle Close | LA9 7BH |
| Castle Dale | LA9 7BG |
| Castle Drive | LA9 7BJ LA9 7BN |
| Castle Grove | LA9 7AY LA9 7AZ LA9 7BE |
| Castle Oval | LA9 7BD |
| Castle Riggs | LA9 7BA |
| Castle Rise | LA9 7BQ |
| Castle Road | LA9 7AU |
| Cornflower Road | LA9 6EH |
| Cranesbill Street | LA9 6FP |
| Curson Rise | LA9 7PN |
| Fletcher Drive | LA9 7DL |
| Gorse Close | LA9 6EJ |
| Landsdown Close | LA9 7SB |
| Lingmoor Rise | LA9 7PL |
| Littledale | LA9 7SG |
| Lound Road | LA9 7DT |
| Nether Street | LA9 7DS |
| Parkside Meadow | LA9 7SR |
| Parkside Road | LA9 7BL LA9 7DU |
| Pine Close | LA9 7SQ |
| Shap Road | LA9 6FU |
| Valley Drive | LA9 7AG LA9 7AQ LA9 7SD LA9 7SE |
| Wasdale Close | LA9 7JQ |
| Whitton Terrace | LA9 7DN |
| Wilson Street | LA9 7DR |
| Yealand Drive | LA9 7SA |
Transport near Kendal Nether
- FAQ
- Price Paid By Year
- Property Type Price
Frequently asked questions about Kendal Nether
What is the average price for a property for sale in Kendal Nether?
The average price for a property for sale in Kendal Nether is £295,094. This amount is 2% lower than the average price in Kendal. There are 915 property listings for sale in Kendal Nether.
What streets have the most expensive properties for sale in Kendal Nether?
The streets with the most expensive properties for sale in Kendal Nether are Parkside Meadow at an average of £477,003, Pine Close at an average of £377,500 and Archers Meadow at an average of £357,428.
What streets have the most affordable properties for sale in Kendal Nether?
The streets with the most affordable properties for sale in Kendal Nether are Wilson Street at an average of £220,000, Curson Rise at an average of £240,000 and Aynam Road at an average of £246,055.
Which train stations are available in or near Kendal Nether?
Some of the train stations available in or near Kendal Nether are Kendal, Oxenholme Lake District and Burneside.
Property Price Paid in Kendal Nether by Year
The average sold property price by year was:
| Year | Average Sold Price | Price Change |
Sold Properties
|
|---|---|---|---|
| 2025 | £309,812 | 6% |
24 Properties |
| 2024 | £292,704 | 3% |
22 Properties |
| 2023 | £284,355 | 2% |
28 Properties |
| 2022 | £278,131 | 8% |
19 Properties |
| 2021 | £255,886 | 6% |
57 Properties |
| 2020 | £240,740 | 2% |
25 Properties |
| 2019 | £235,006 | 14% |
29 Properties |
| 2018 | £201,664 | -7% |
36 Properties |
| 2017 | £215,770 | 4% |
32 Properties |
| 2016 | £206,498 | 4% |
32 Properties |
| 2015 | £198,750 | -0,4% |
26 Properties |
| 2014 | £199,579 | 1% |
40 Properties |
| 2013 | £198,021 | -10% |
26 Properties |
| 2012 | £218,466 | 7% |
31 Properties |
| 2011 | £202,277 | -3% |
27 Properties |
| 2010 | £209,196 | 11% |
29 Properties |
| 2009 | £186,813 | 3% |
30 Properties |
| 2008 | £181,488 | -13% |
26 Properties |
| 2007 | £204,191 | 7% |
45 Properties |
| 2006 | £189,420 | -10% |
47 Properties |
| 2005 | £209,105 | 13% |
28 Properties |
| 2004 | £181,980 | 18% |
48 Properties |
| 2003 | £148,421 | 24% |
52 Properties |
| 2002 | £112,454 | 6% |
48 Properties |
| 2001 | £105,306 | 16% |
61 Properties |
| 2000 | £88,948 | 10% |
76 Properties |
| 1999 | £79,996 | 5% |
95 Properties |
| 1998 | £75,937 | 8% |
68 Properties |
| 1997 | £69,519 | 9% |
75 Properties |
| 1996 | £63,197 | -6% |
23 Properties |
| 1995 | £67,184 | - |
26 Properties |
Property Price per Property Type in Kendal Nether
Here you can find historic sold price data in order to help with your property search.
The average Property Paid Price for specific property types in the last three years are:
| Property Type | Average Sold Price | Sold Properties |
|---|---|---|
| Semi Detached House | £300,852.00 | 34 Semi Detached Houses |
| Terraced House | £260,122.00 | 20 Terraced Houses |
| Detached House | £361,000.00 | 16 Detached Houses |
| Flat | £157,375.00 | 4 Flats |

