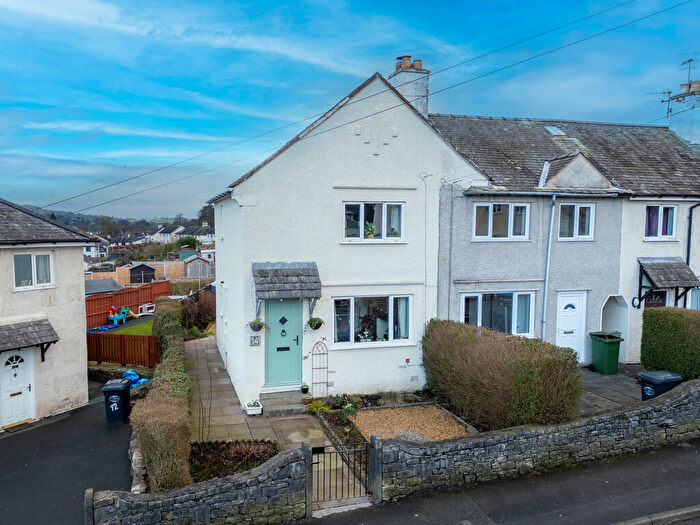
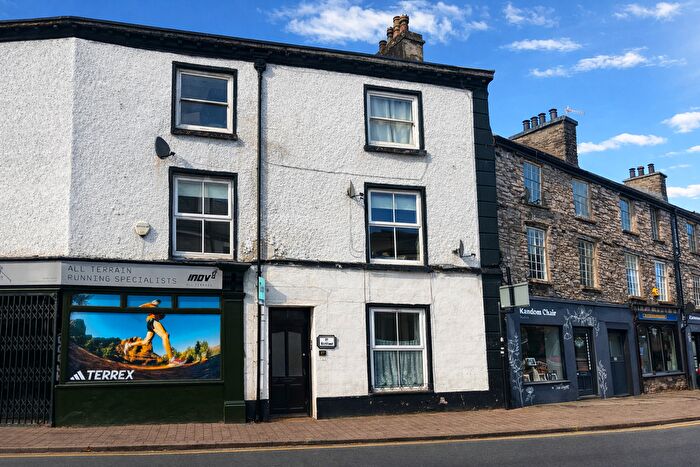
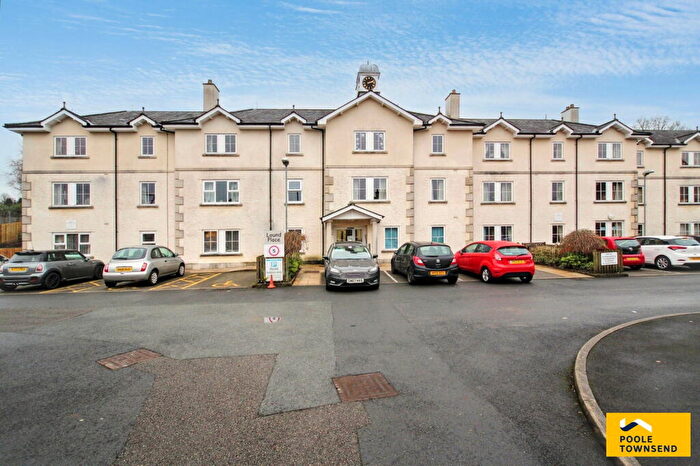
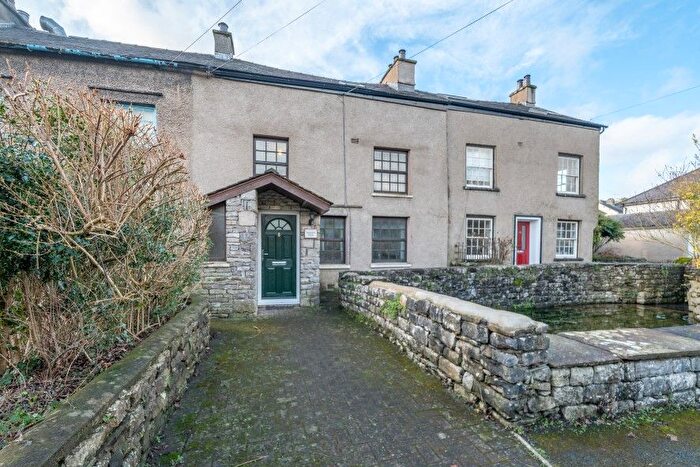
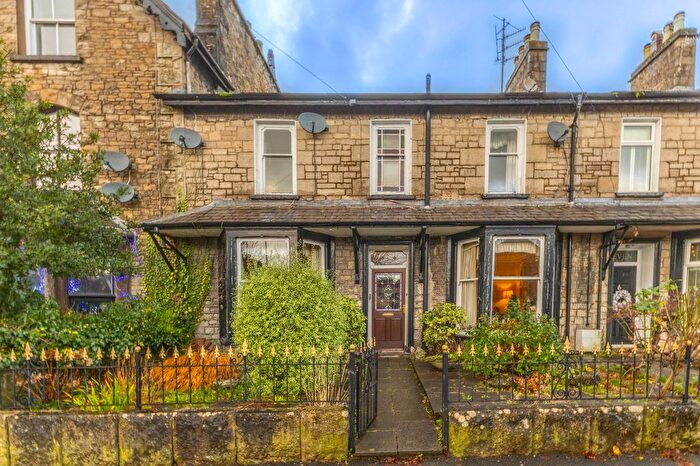
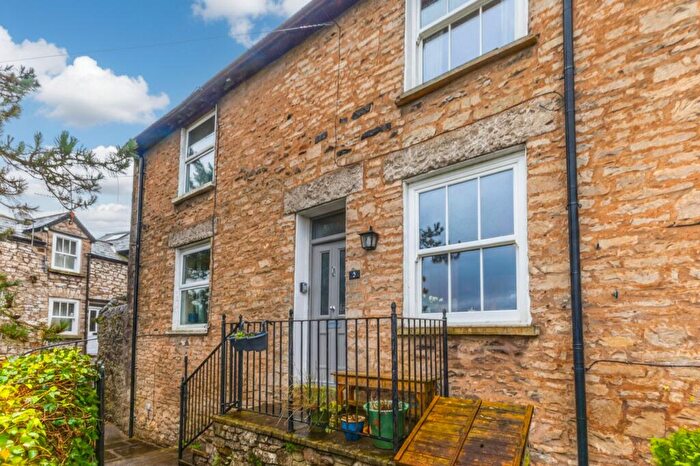
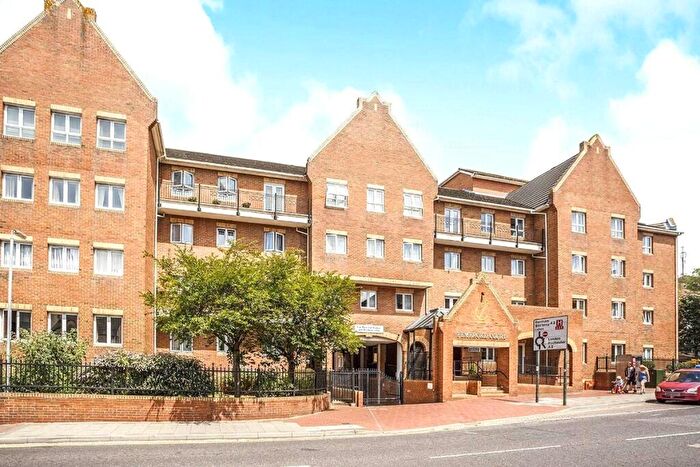
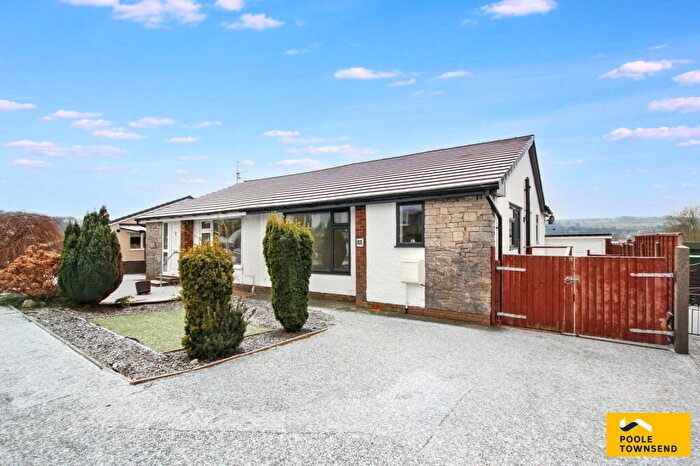
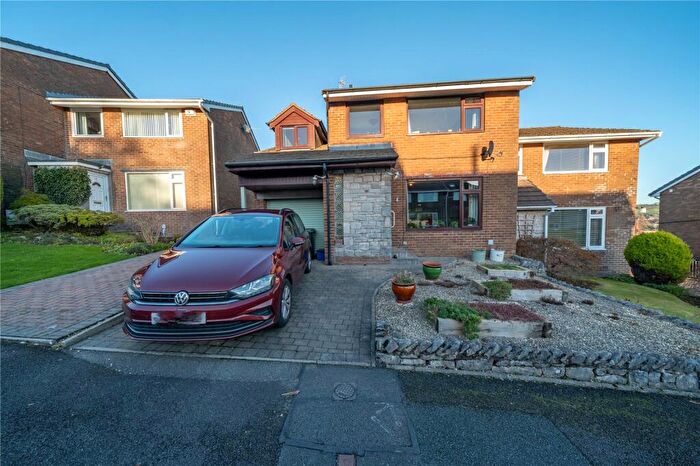
Houses for sale & to rent in Kendal Romney, Kendal
House Prices in Kendal Romney
Properties in Kendal Romney have an average house price of £243,329.00 and had 94 Property Transactions within the last 3 years¹.
Kendal Romney is an area in Kendal, Cumbria with 877 households², where the most expensive property was sold for £450,000.00.
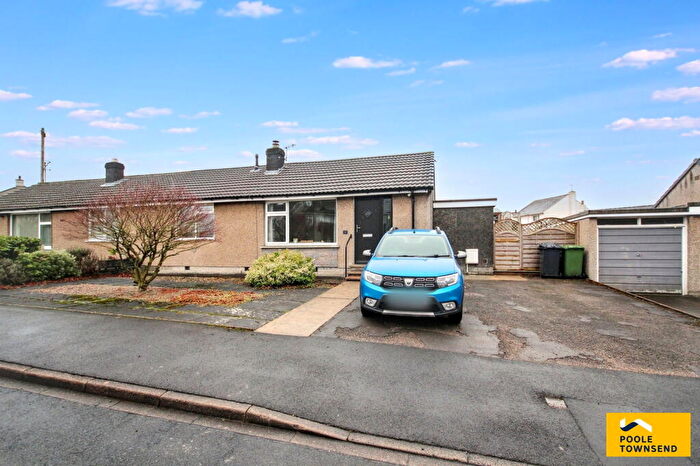
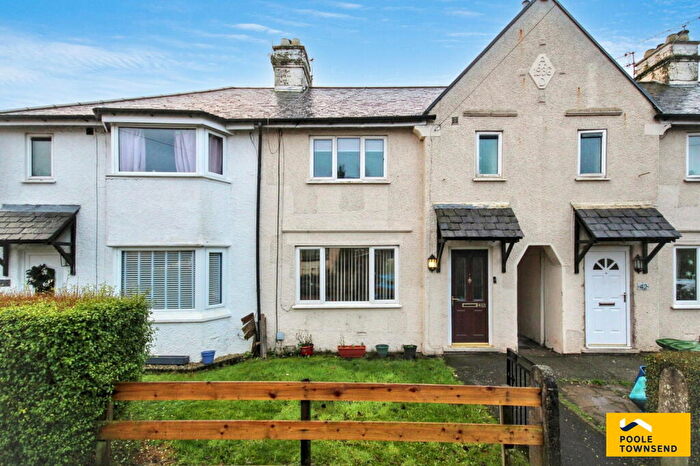
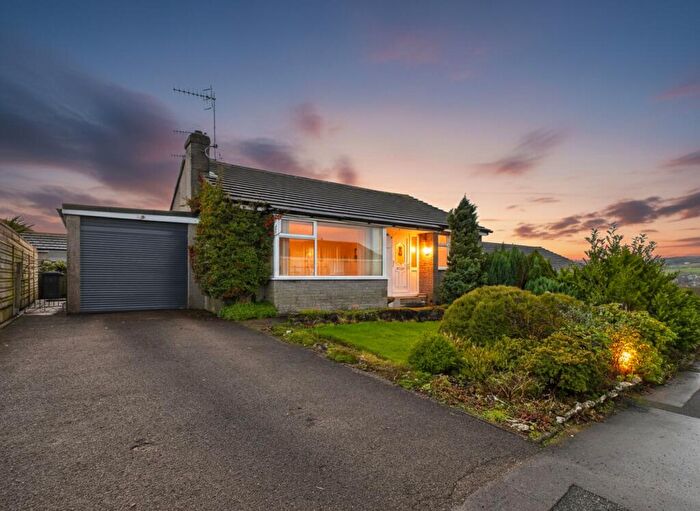
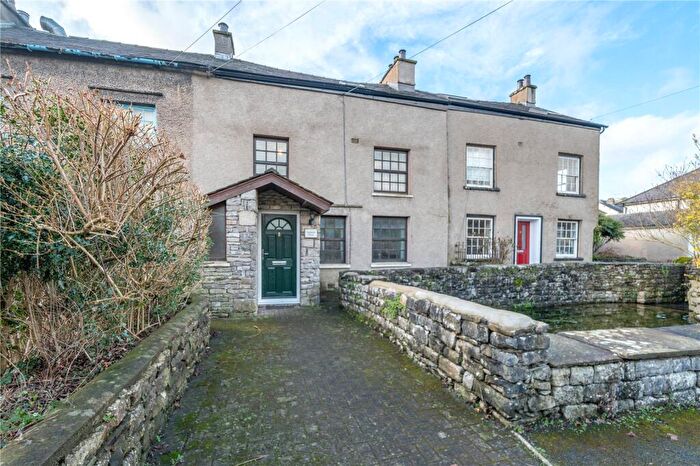
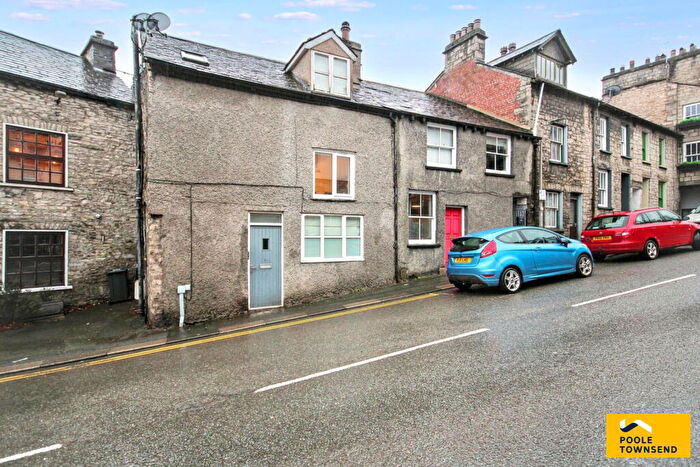
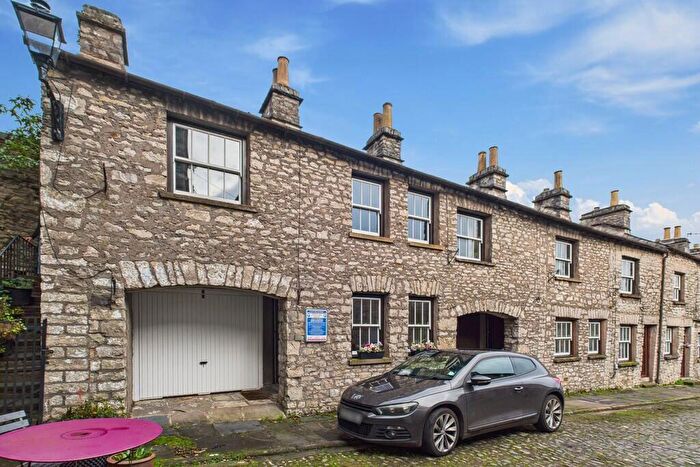
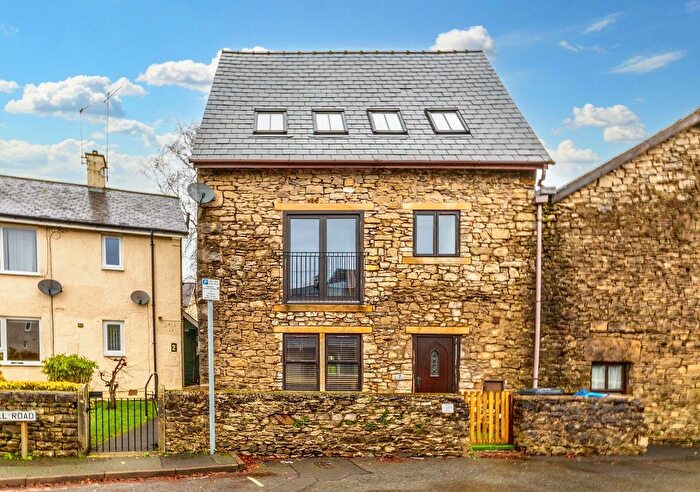
Properties for sale in Kendal Romney
Roads and Postcodes in Kendal Romney
Navigate through our locations to find the location of your next house in Kendal Romney, Kendal for sale or to rent.
| Streets | Postcodes |
|---|---|
| Ash Grove | LA9 5QX |
| Bellingham Road | LA9 5JP LA9 5JW |
| Burton Road | LA9 7LJ LA9 7LL |
| Ford Terrace | LA9 5RB |
| Garden Mews | LA9 7EJ |
| Garden Road | LA9 7ED |
| Garden Street | LA9 7EB |
| Howard Street | LA9 5QZ |
| Ivy Bank Apartments | LA9 7ST |
| Levens Close | LA9 7LU |
| Lound Place | LA9 7FE |
| Lound Road | LA9 7DZ LA9 7EG |
| Lound Street | LA9 7EA |
| Milnthorpe Road | LA9 5HE LA9 5QG LA9 5QQ |
| Natland Road | LA9 7LR LA9 7LT |
| Old Lound | LA9 7EH |
| Park Avenue | LA9 5QN LA9 5QW |
| Park Street | LA9 5QP |
| Rinkfield | LA9 7LN LA9 7LP |
| Riverdale Court | LA9 7LQ |
| Romney Avenue | LA9 5QT |
| Romney Road | LA9 5QR LA9 5RA |
| Romney Villas | LA9 5QU |
| South Road | LA9 5QH |
| Stonecross Gardens | LA9 5TB |
| Stonecross Green | LA9 5HL |
| Tudor Gardens | LA9 7SU |
| Wattsfield Avenue | LA9 5JJ |
| Wattsfield Lane | LA9 5HF |
| Wattsfield Road | LA9 5JH LA9 5JL LA9 5JN |
| West Street | LA9 5QJ LA9 5QL |
Transport near Kendal Romney
- FAQ
- Price Paid By Year
- Property Type Price
Frequently asked questions about Kendal Romney
What is the average price for a property for sale in Kendal Romney?
The average price for a property for sale in Kendal Romney is £243,329. This amount is 19% lower than the average price in Kendal. There are 985 property listings for sale in Kendal Romney.
What streets have the most expensive properties for sale in Kendal Romney?
The streets with the most expensive properties for sale in Kendal Romney are Stonecross Green at an average of £375,000, Riverdale Court at an average of £361,666 and Wattsfield Road at an average of £325,908.
What streets have the most affordable properties for sale in Kendal Romney?
The streets with the most affordable properties for sale in Kendal Romney are Lound Place at an average of £64,000, Garden Mews at an average of £117,500 and Old Lound at an average of £181,000.
Which train stations are available in or near Kendal Romney?
Some of the train stations available in or near Kendal Romney are Kendal, Oxenholme Lake District and Burneside.
Property Price Paid in Kendal Romney by Year
The average sold property price by year was:
| Year | Average Sold Price | Price Change |
Sold Properties
|
|---|---|---|---|
| 2025 | £262,369 | 12% |
23 Properties |
| 2024 | £229,626 | -8% |
43 Properties |
| 2023 | £248,732 | -7% |
28 Properties |
| 2022 | £266,075 | 14% |
30 Properties |
| 2021 | £228,556 | -1% |
38 Properties |
| 2020 | £230,901 | 11% |
33 Properties |
| 2019 | £204,518 | -11% |
42 Properties |
| 2018 | £227,125 | 13% |
39 Properties |
| 2017 | £197,243 | 2% |
39 Properties |
| 2016 | £192,966 | 5% |
43 Properties |
| 2015 | £183,582 | -10% |
42 Properties |
| 2014 | £201,338 | 10% |
35 Properties |
| 2013 | £180,310 | -4% |
43 Properties |
| 2012 | £186,940 | 19% |
37 Properties |
| 2011 | £150,861 | -17% |
34 Properties |
| 2010 | £175,775 | 0,1% |
31 Properties |
| 2009 | £175,650 | -12% |
15 Properties |
| 2008 | £195,995 | -4% |
24 Properties |
| 2007 | £204,382 | 16% |
42 Properties |
| 2006 | £171,221 | -1% |
42 Properties |
| 2005 | £173,690 | 9% |
35 Properties |
| 2004 | £157,257 | 18% |
48 Properties |
| 2003 | £129,142 | 10% |
48 Properties |
| 2002 | £116,705 | 15% |
63 Properties |
| 2001 | £99,177 | 24% |
68 Properties |
| 2000 | £75,242 | 17% |
53 Properties |
| 1999 | £62,290 | 8% |
59 Properties |
| 1998 | £57,240 | -7% |
51 Properties |
| 1997 | £61,273 | 4% |
48 Properties |
| 1996 | £58,736 | 12% |
40 Properties |
| 1995 | £51,745 | - |
31 Properties |
Property Price per Property Type in Kendal Romney
Here you can find historic sold price data in order to help with your property search.
The average Property Paid Price for specific property types in the last three years are:
| Property Type | Average Sold Price | Sold Properties |
|---|---|---|
| Semi Detached House | £270,580.00 | 18 Semi Detached Houses |
| Detached House | £344,357.00 | 7 Detached Houses |
| Terraced House | £245,200.00 | 55 Terraced Houses |
| Flat | £150,428.00 | 14 Flats |

