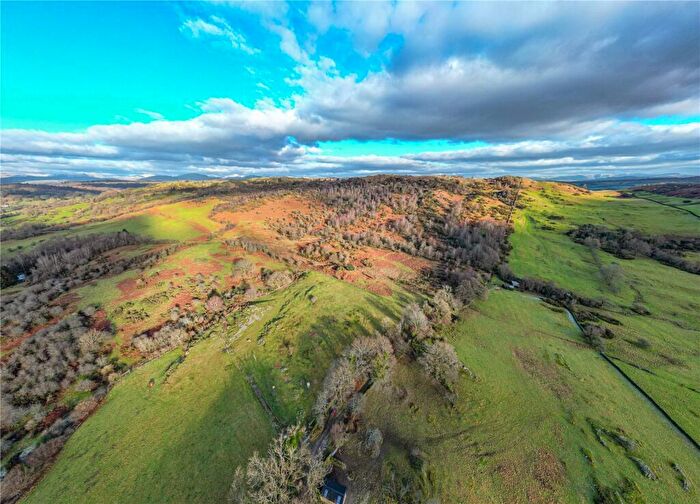
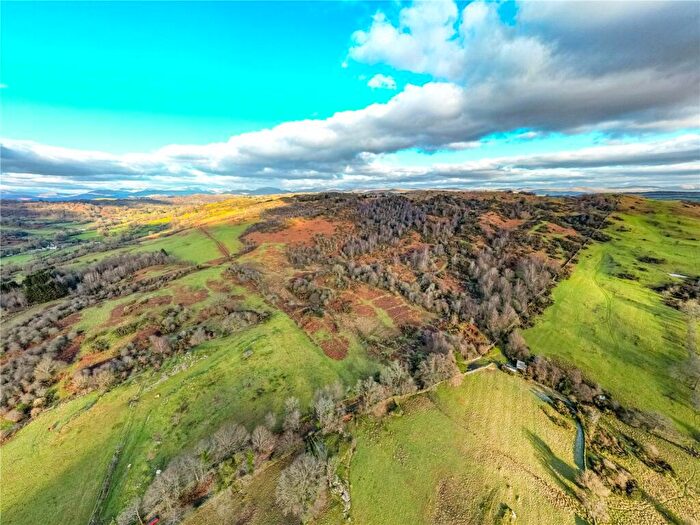
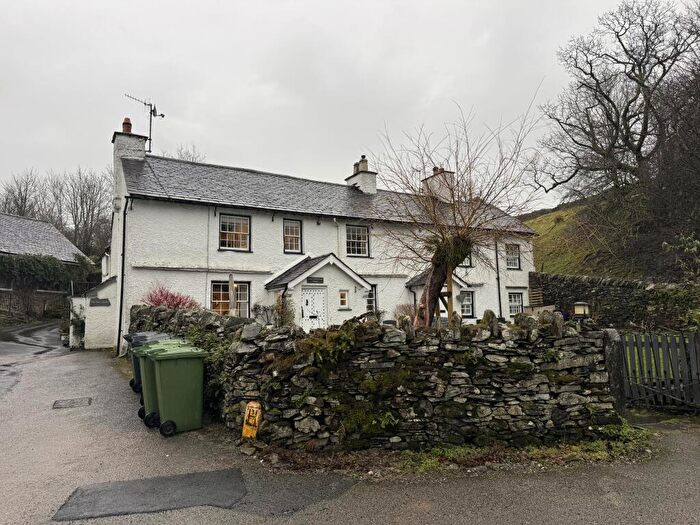
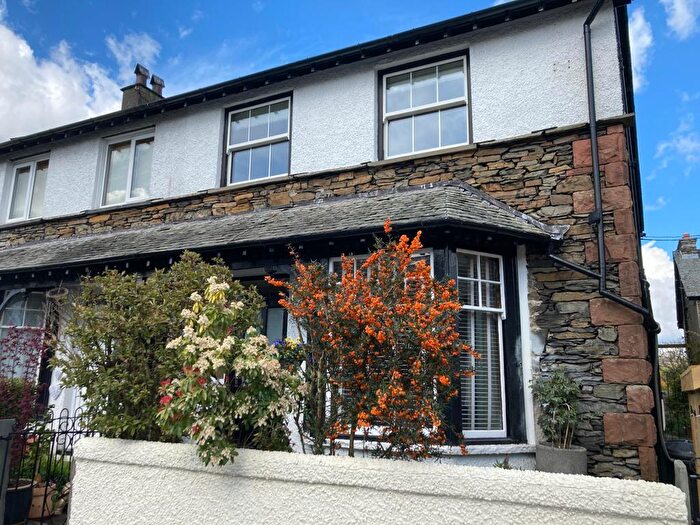
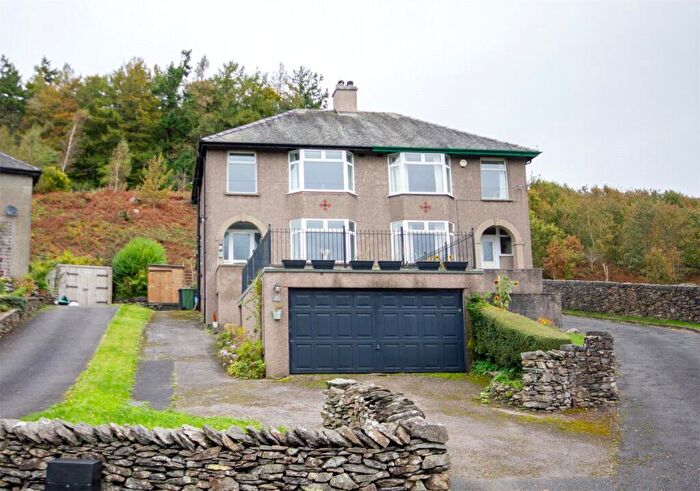
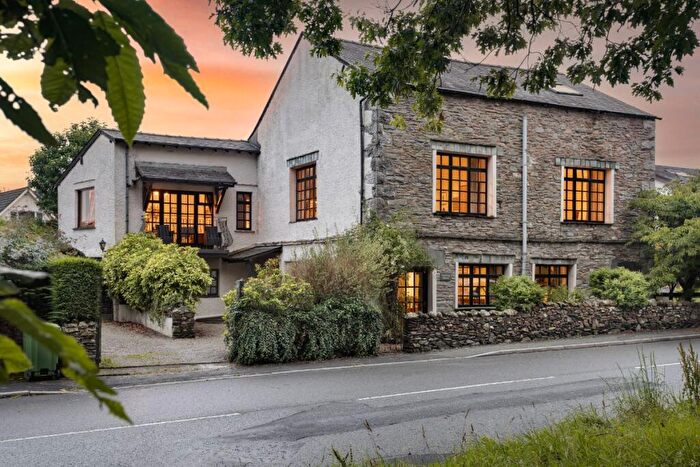
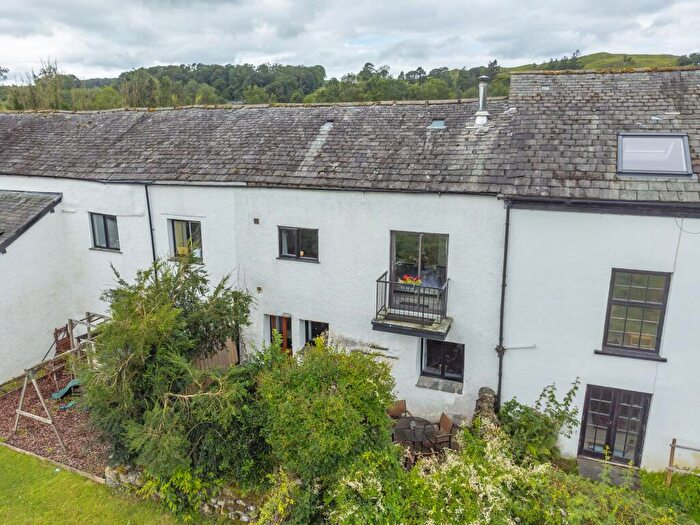
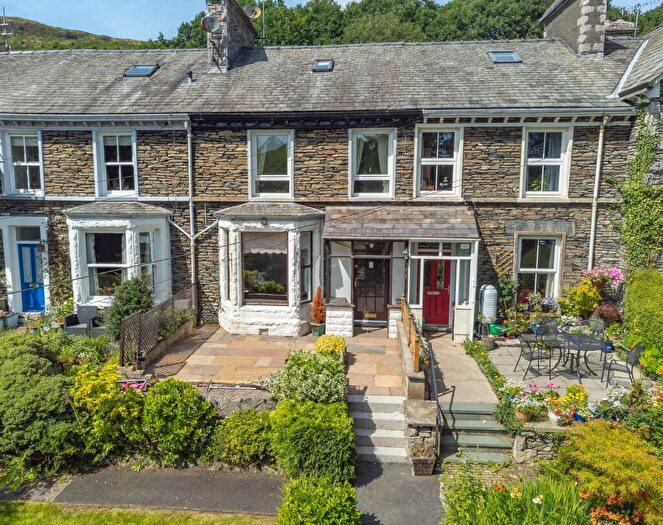
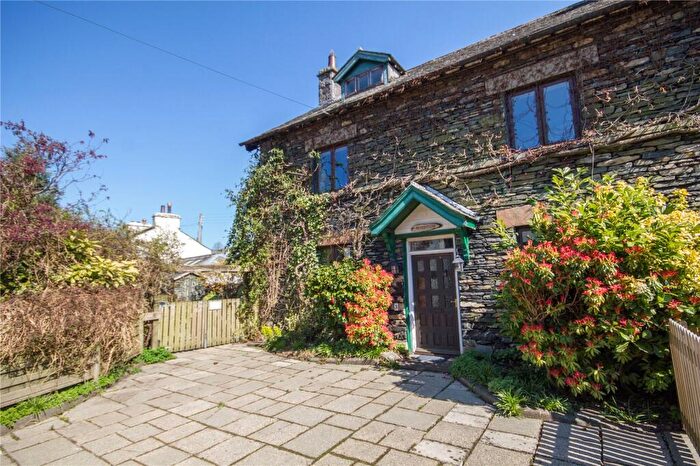
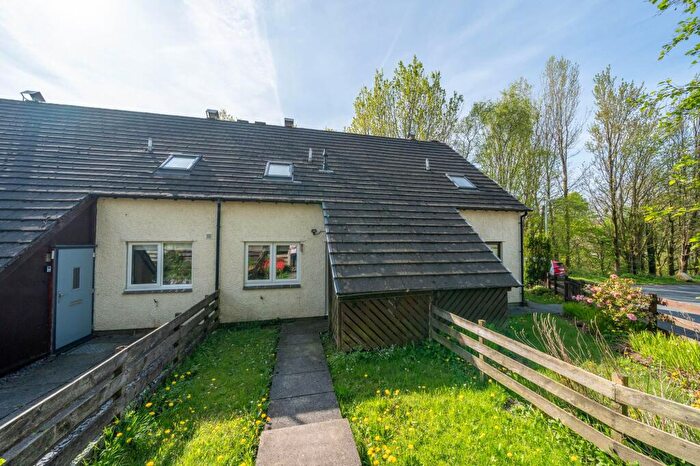
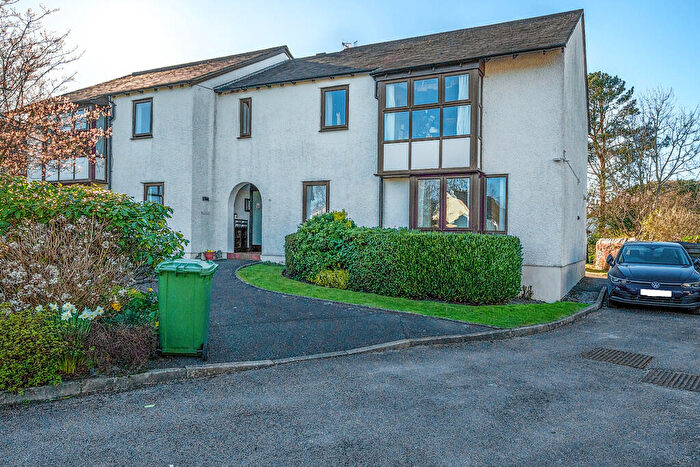
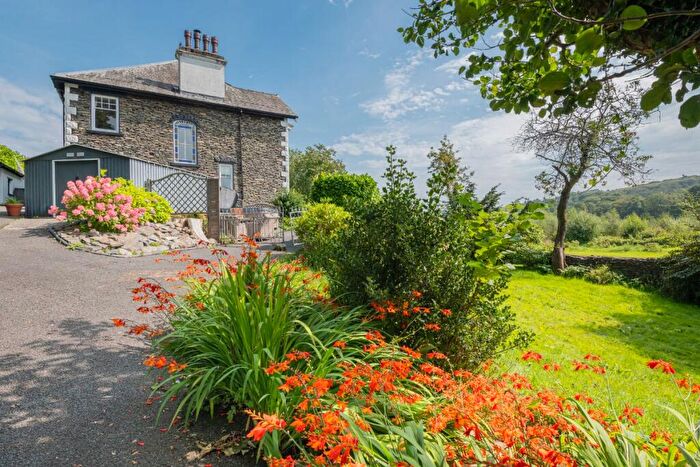
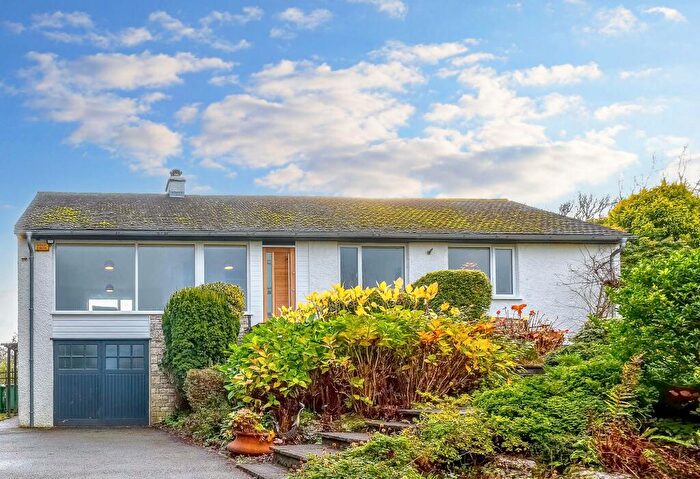
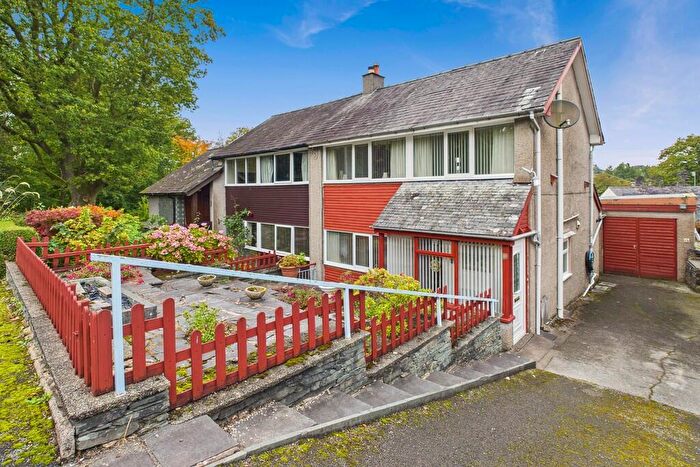
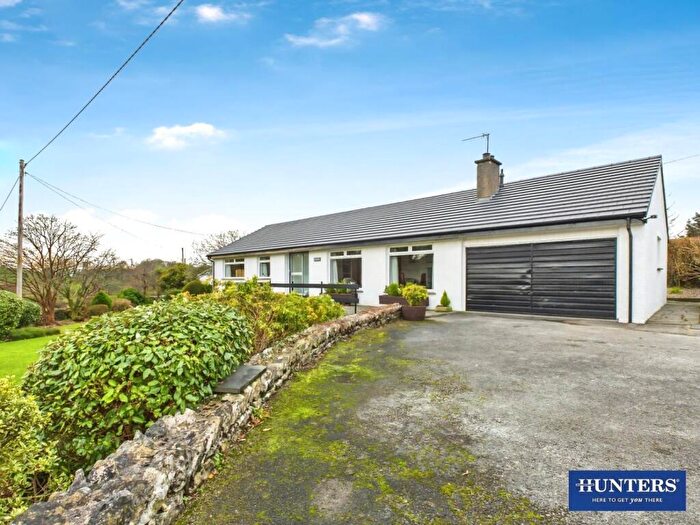
Houses for sale & to rent in Staveley-in-westmorland, Kendal
House Prices in Staveley-in-westmorland
Properties in Staveley-in-westmorland have an average house price of £423,348.00 and had 74 Property Transactions within the last 3 years¹.
Staveley-in-westmorland is an area in Kendal, Cumbria with 903 households², where the most expensive property was sold for £1,500,000.00.
Properties for sale in Staveley-in-westmorland
Roads and Postcodes in Staveley-in-westmorland
Navigate through our locations to find the location of your next house in Staveley-in-westmorland, Kendal for sale or to rent.
| Streets | Postcodes |
|---|---|
| Back Lane | LA8 9LR |
| Bank Side | LA8 9NH |
| Bank Terrace | LA8 9NQ |
| Beck Nook | LA8 9ND |
| Birchmill Cottages | LA8 8LE |
| Bridge End | LA8 9LZ |
| Brow Foot Lane | LA8 9JQ |
| Brow Lane | LA8 9PH LA8 9PJ |
| Burneside | LA8 9AA |
| Caldrigg Fold | LA8 9QN |
| Church View | LA8 9PD |
| Crag End | LA8 9PE |
| Crag View | LA8 9LT |
| Crook Road | LA8 9NG |
| Danes Crescent | LA8 9QJ |
| Danes Road | LA8 9PR LA8 9PW |
| Fairfield Close | LA8 9RA |
| Follet Close | LA8 8LG |
| Ghyll Fold | LA8 9AL |
| Gowan Bank | LA8 9LN |
| Gowan Close | LA8 9NW |
| Gowan Crescent | LA8 9NF |
| Gowan Terrace | LA8 9LW |
| Grassgarth Lane | LA8 9QF LA8 9QG |
| Green Garth | LA8 9NT |
| Hall Lane | LA8 9QY |
| Hogg House Close | LA8 9PF |
| Ings Hall Estate | LA8 9PZ |
| Kendal Road | LA8 9LP |
| Kent Drive | LA8 9NZ |
| Kentmere Road | LA8 9JD LA8 9JE LA8 9JF LA8 9PA |
| Main Street | LA8 9LU LA8 9LX |
| Plantation Bridge | LA8 9JA |
| Raven Garth | LA8 9PG |
| Rawes Garth | LA8 9QH |
| Rock Cottages | LA8 9NA |
| School Lane | LA8 9NU |
| Scroggs Close | LA8 9NY |
| Seed Howe | LA8 9PP |
| Seedfield | LA8 9NJ |
| Silver Street | LA8 9NX |
| Smithy Cottages | LA8 8LH |
| Station Road | LA8 9NB |
| Sunny Point Cottages | LA8 8LB |
| The Banks | LA8 9NE |
| The Green | LA8 9NS |
| Windermere Road | LA8 9LY LA8 9PL |
| LA8 8JZ LA8 8LA LA8 8LD LA8 8LF LA8 8LJ LA8 8LL LA8 8LN LA8 8LQ LA8 8LR LA8 8LW LA8 9HP LA8 9HR LA8 9HS LA8 9HU LA8 9JB LA8 9JG LA8 9JH LA8 9JJ LA8 9JL LA8 9JP LA8 9JW LA8 9NL LA8 9NN LA8 9PQ LA8 9PS LA8 9PT LA8 9PU LA8 9PY LA8 9QE LA8 9QQ LA8 9QT LA8 9QX LA8 9QZ |
Transport near Staveley-in-westmorland
- FAQ
- Price Paid By Year
- Property Type Price
Frequently asked questions about Staveley-in-westmorland
What is the average price for a property for sale in Staveley-in-westmorland?
The average price for a property for sale in Staveley-in-westmorland is £423,348. This amount is 40% higher than the average price in Kendal. There are 251 property listings for sale in Staveley-in-westmorland.
What streets have the most expensive properties for sale in Staveley-in-westmorland?
The streets with the most expensive properties for sale in Staveley-in-westmorland are Station Road at an average of £854,000, Brow Foot Lane at an average of £709,000 and Crag End at an average of £650,000.
What streets have the most affordable properties for sale in Staveley-in-westmorland?
The streets with the most affordable properties for sale in Staveley-in-westmorland are Silver Street at an average of £130,000, Follet Close at an average of £140,000 and Fairfield Close at an average of £209,000.
Which train stations are available in or near Staveley-in-westmorland?
Some of the train stations available in or near Staveley-in-westmorland are Staveley (Cumbria), Burneside and Windermere.
Property Price Paid in Staveley-in-westmorland by Year
The average sold property price by year was:
| Year | Average Sold Price | Price Change |
Sold Properties
|
|---|---|---|---|
| 2025 | £530,500 | 25% |
23 Properties |
| 2024 | £397,696 | 12% |
27 Properties |
| 2023 | £349,520 | -39% |
24 Properties |
| 2022 | £486,008 | 22% |
29 Properties |
| 2021 | £380,442 | 21% |
40 Properties |
| 2020 | £301,000 | -17% |
24 Properties |
| 2019 | £352,532 | 19% |
20 Properties |
| 2018 | £284,575 | -14% |
34 Properties |
| 2017 | £325,665 | -6% |
43 Properties |
| 2016 | £344,979 | 18% |
24 Properties |
| 2015 | £283,588 | -1% |
34 Properties |
| 2014 | £285,398 | 13% |
27 Properties |
| 2013 | £248,950 | -34% |
20 Properties |
| 2012 | £332,636 | 21% |
24 Properties |
| 2011 | £262,980 | -11% |
18 Properties |
| 2010 | £291,754 | 2% |
21 Properties |
| 2009 | £285,537 | -15% |
20 Properties |
| 2008 | £329,695 | 17% |
28 Properties |
| 2007 | £274,288 | -10% |
45 Properties |
| 2006 | £300,998 | -3% |
43 Properties |
| 2005 | £311,235 | 30% |
34 Properties |
| 2004 | £217,978 | -4% |
35 Properties |
| 2003 | £226,533 | 21% |
28 Properties |
| 2002 | £179,337 | 13% |
52 Properties |
| 2001 | £155,840 | 24% |
36 Properties |
| 2000 | £118,234 | 9% |
43 Properties |
| 1999 | £107,244 | 8% |
46 Properties |
| 1998 | £98,902 | 3% |
36 Properties |
| 1997 | £95,963 | 19% |
46 Properties |
| 1996 | £78,190 | -3% |
47 Properties |
| 1995 | £80,600 | - |
25 Properties |
Property Price per Property Type in Staveley-in-westmorland
Here you can find historic sold price data in order to help with your property search.
The average Property Paid Price for specific property types in the last three years are:
| Property Type | Average Sold Price | Sold Properties |
|---|---|---|
| Semi Detached House | £418,000.00 | 13 Semi Detached Houses |
| Detached House | £643,536.00 | 22 Detached Houses |
| Terraced House | £316,151.00 | 33 Terraced Houses |
| Flat | £217,166.00 | 6 Flats |

