
Houses for sale in CA7 5DZ, Water Street, Marsh, Wigton
House Prices in CA7 5DZ, Water Street, Marsh
Properties in CA7 5DZ have no sales history available within the last 3 years. CA7 5DZ is a postcode in Water Street located in Marsh, an area in Wigton, Cumbria, with 3 households².
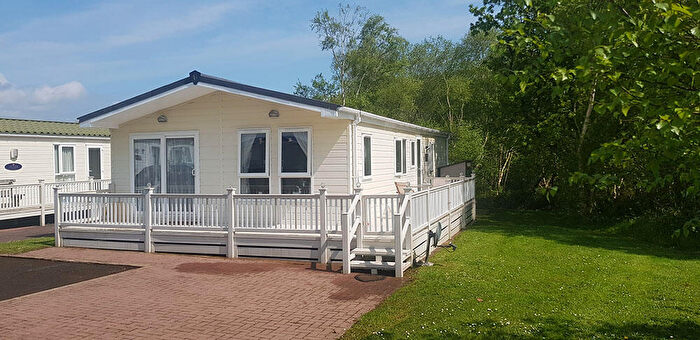
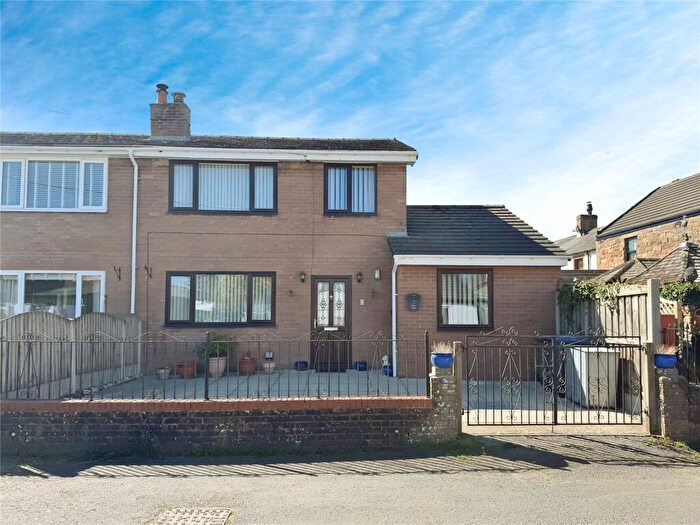
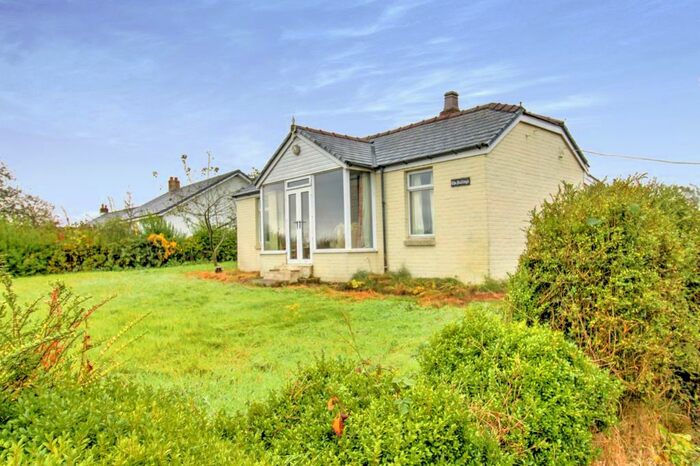
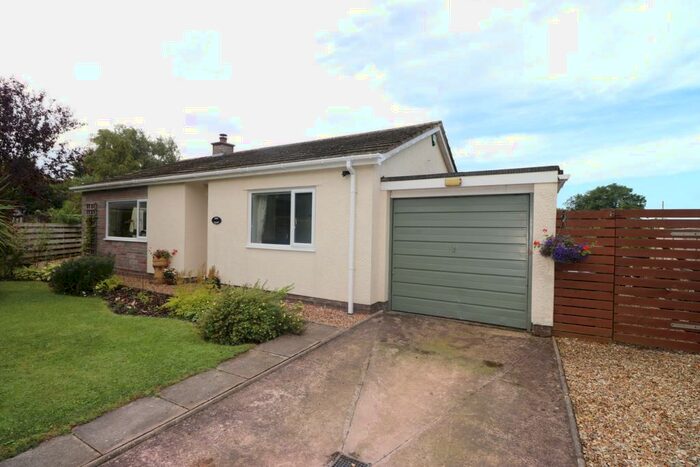
Properties for sale near CA7 5DZ, Water Street

![]()
If you are looking to sell your house, let it out, or receive a property valuation, an expert can help you.
Click the button below to get started.

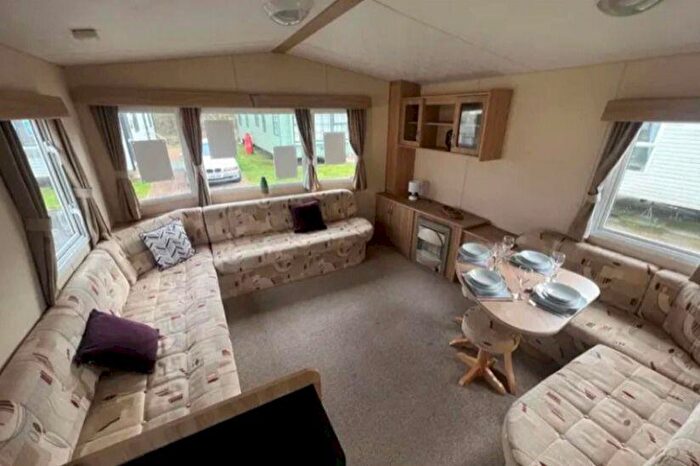
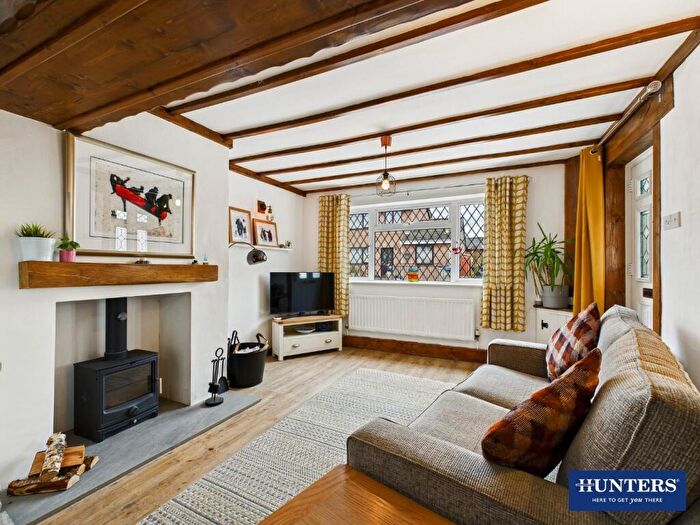
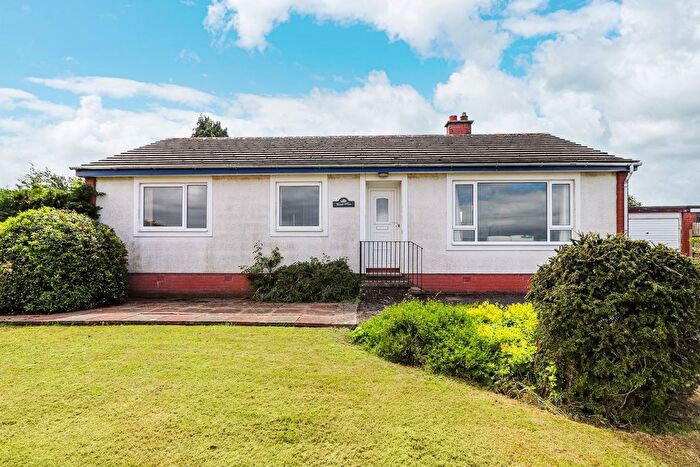
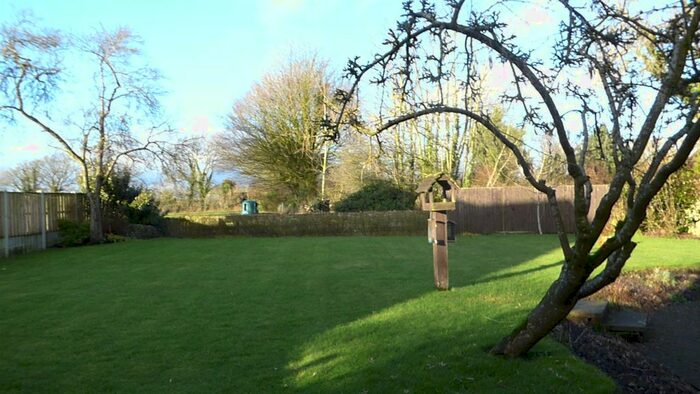
Previously listed properties near CA7 5DZ, Water Street

![]()
If you are looking to sell your house, let it out, or receive a property valuation, an expert can help you.
Click the button below to get started.


Price Paid in Water Street, CA7 5DZ, Marsh
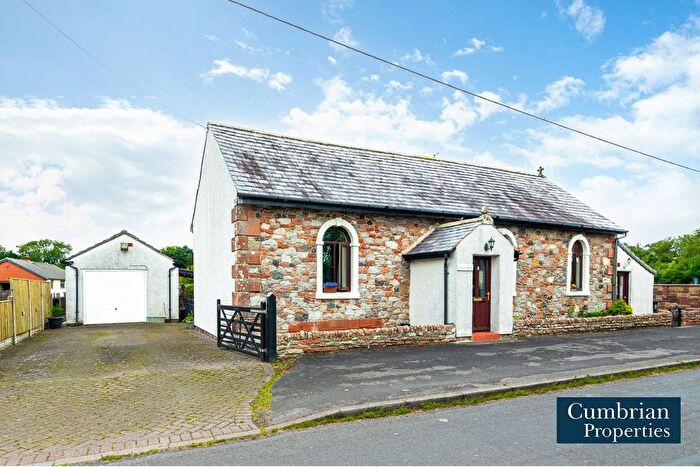
JUNIPER COTTAGE Water Street, CA7 5DZ, Marsh Wigton
Property JUNIPER COTTAGE has been sold 2 times. The last time it was sold was in 21/07/2017 and the sold price was £225,000.00.
This detached house, sold as a freehold on 21/07/2017, is a 244 sqm detached bungalow with an EPC rating of C.
| Date | Price | Property Type | Tenure | Classification |
|---|---|---|---|---|
| 21/07/2017 | £225,000.00 | Detached House | freehold | Established Building |
| 19/08/2005 | £160,000.00 | Detached House | freehold | Established Building |
3 Water Street, CA7 5DZ, Marsh Wigton
Property 3 has been sold 1 time. The last time it was sold was in 23/02/2001 and the sold price was £65,000.00.
This is a Terraced House which was sold as a freehold in 23/02/2001
| Date | Price | Property Type | Tenure | Classification |
|---|---|---|---|---|
| 23/02/2001 | £65,000.00 | Terraced House | freehold | Established Building |
1 Water Street Glasson, CA7 5DZ, Marsh Wigton
This is a 115 square meter End-terrace Bungalow with an EPC rating of E. Currently, there is no transaction history available for this property.
Property price trends in CA7 5DZ, Water Street
According to the latest Land Registry data, the average home in CA7 5DZ, Water Street sold for £225,000 in 2017. That figure comes from 3 sales logged over the past 16 years.
Zoom out to the past decade for the fuller picture. Back in 2005, homes here averaged £160,000, so the typical sold price has climbed about 40.6% since then, roughly 2.9% a year. Stretch the view to fifteen years and that annual pace edges up closer to 8.1%.
Property Price Paid in CA7 5DZ, Water Street by Year
The average sold property price by year was:
| Year | Average Sold Price | Price Change |
Sold Properties
|
|---|---|---|---|
| 2017 | £225,000 | 29% |
1 Property |
| 2005 | £160,000 | 59% |
1 Property |
| 2001 | £65,000 | - |
1 Property |
