Houses for sale & to rent in Marsh, Wigton
House Prices in Marsh
Properties in Marsh have an average house price of £232,666.00 and had 31 Property Transactions within the last 3 years¹.
Marsh is an area in Wigton, Cumbria with 507 households², where the most expensive property was sold for £420,000.00.
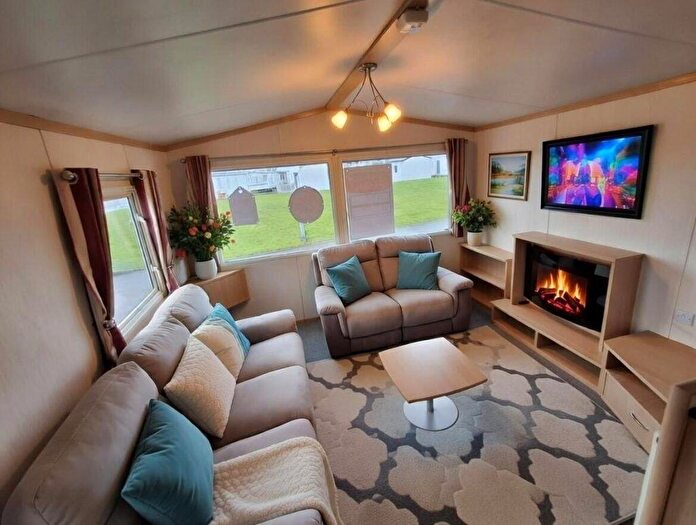
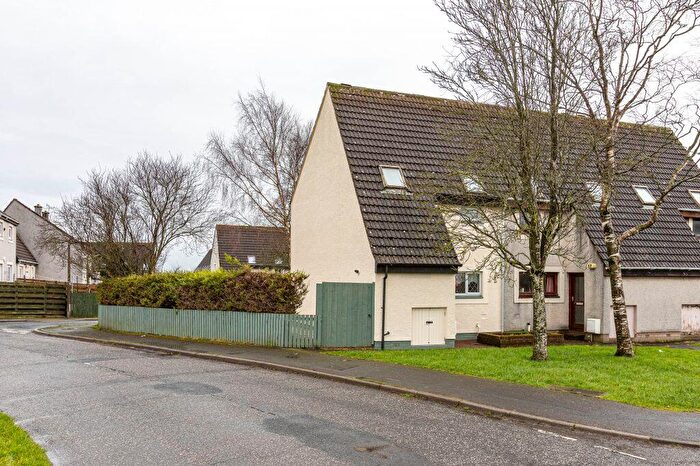
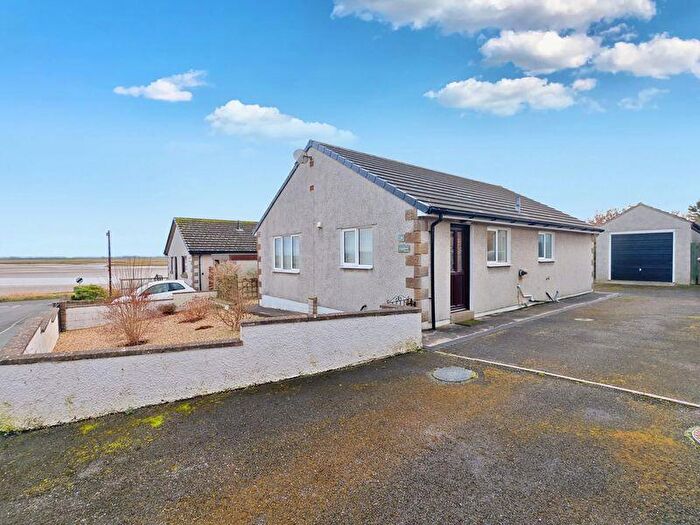
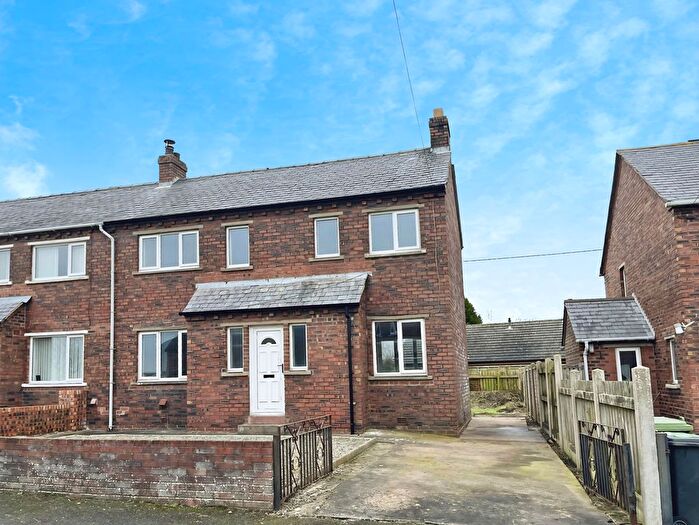
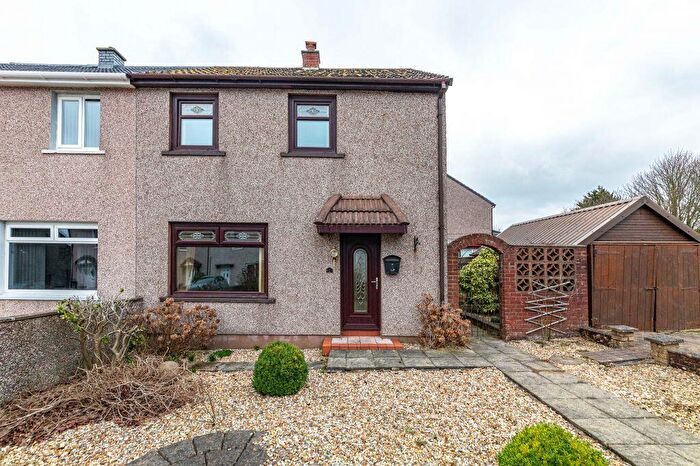
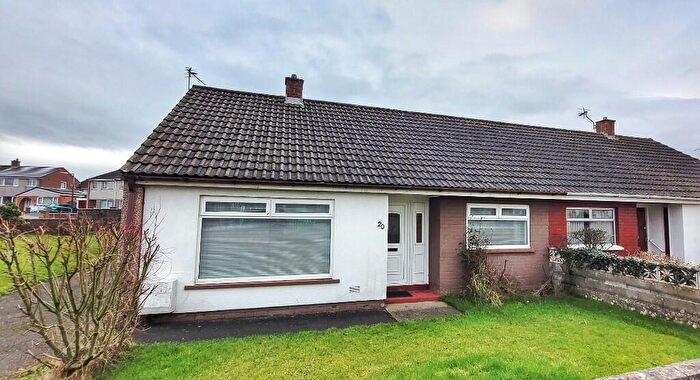
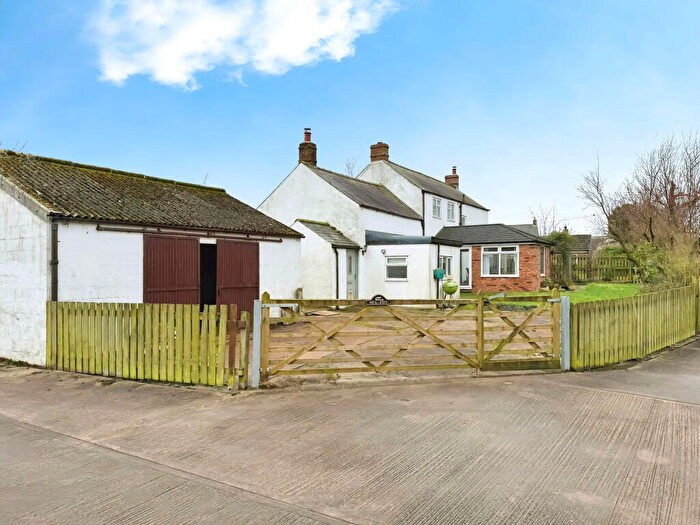
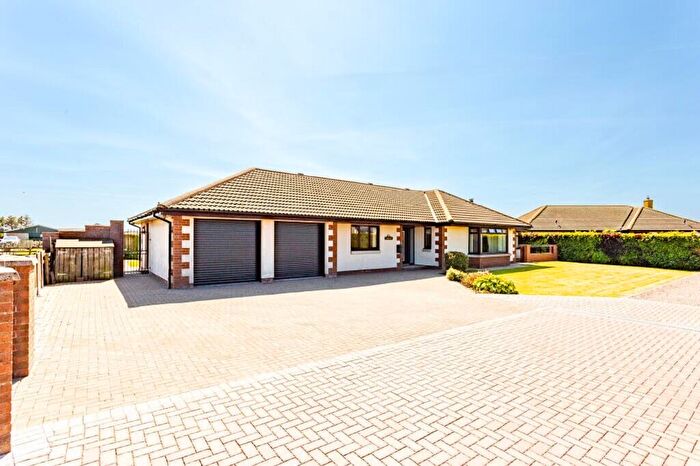
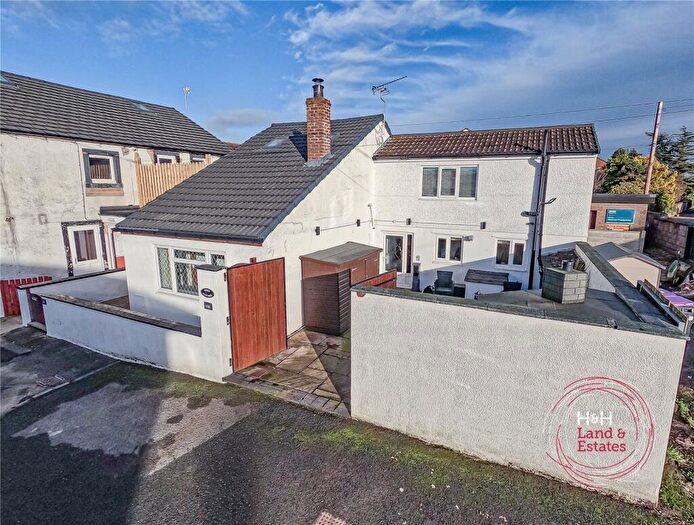
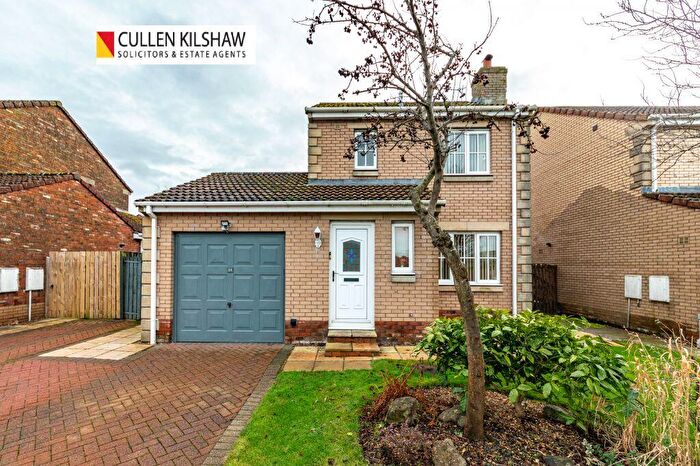
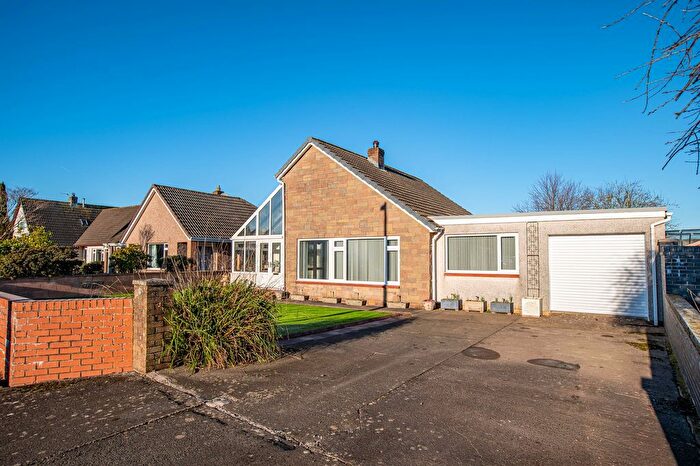
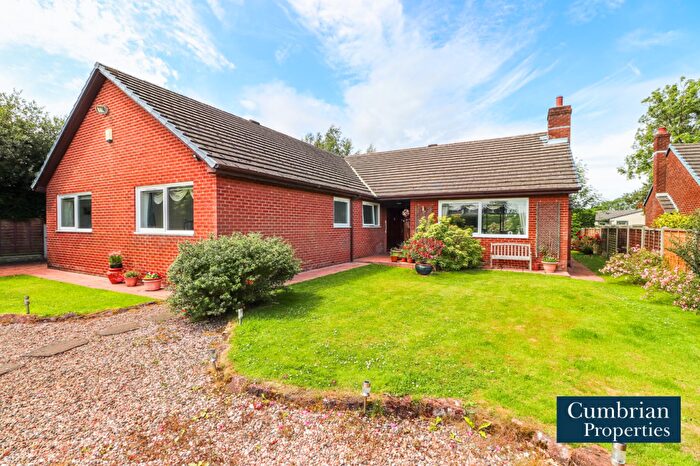
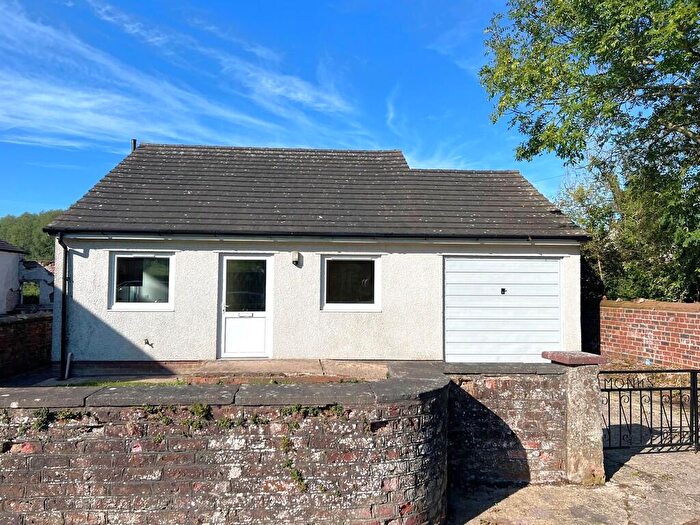
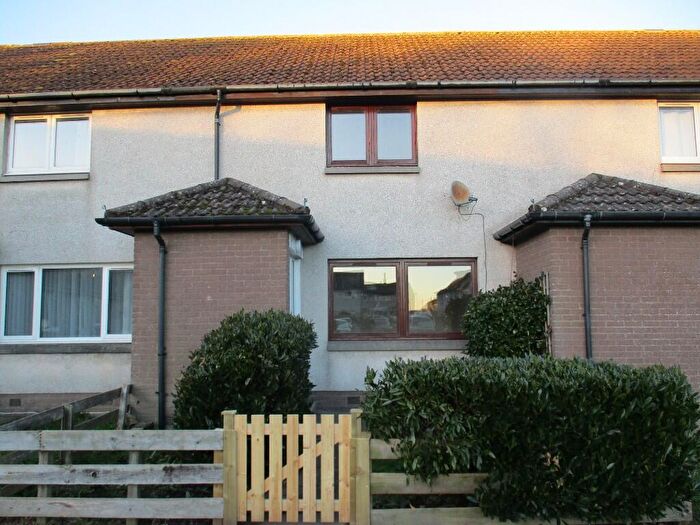
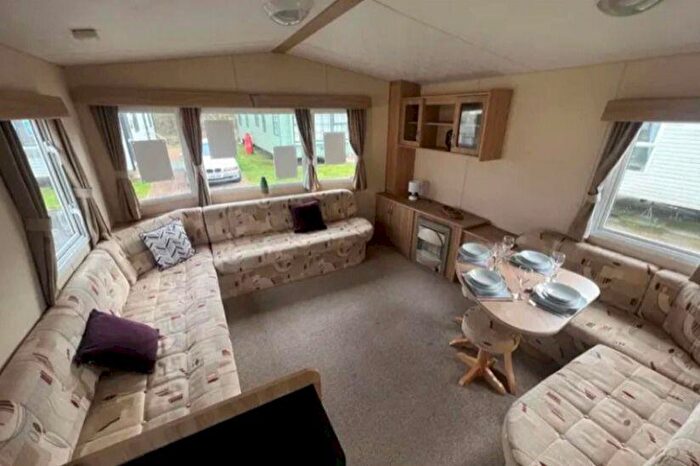
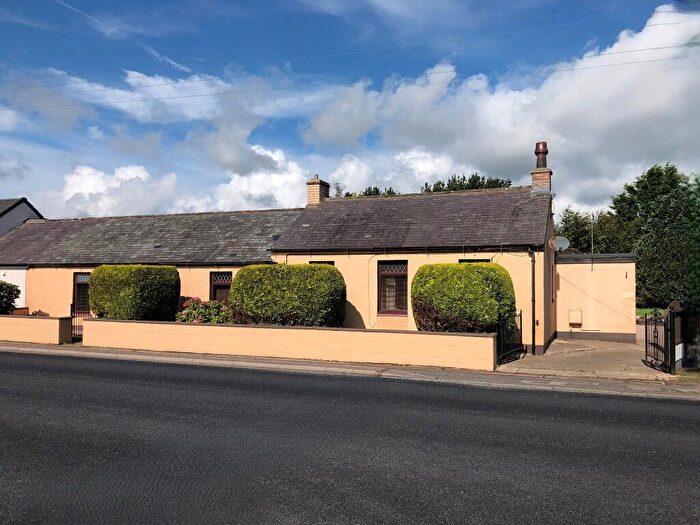
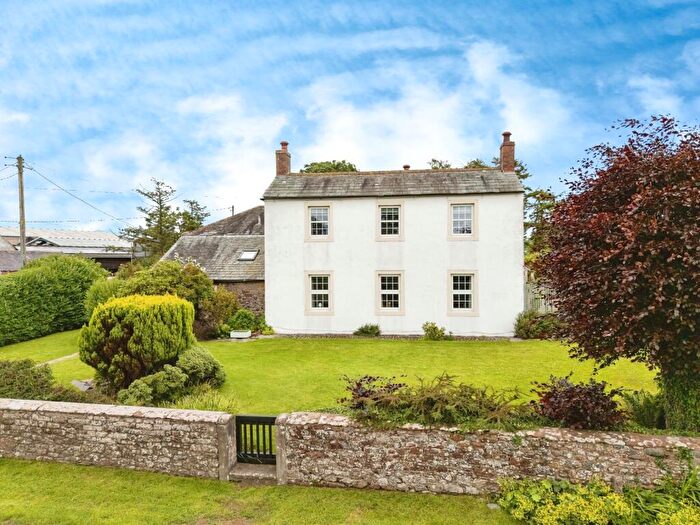
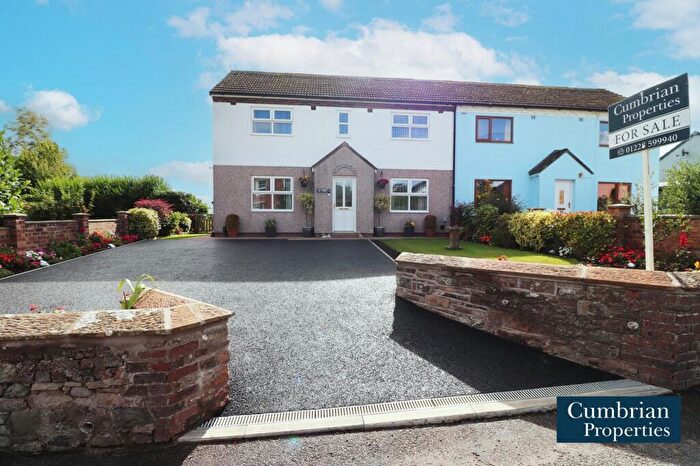
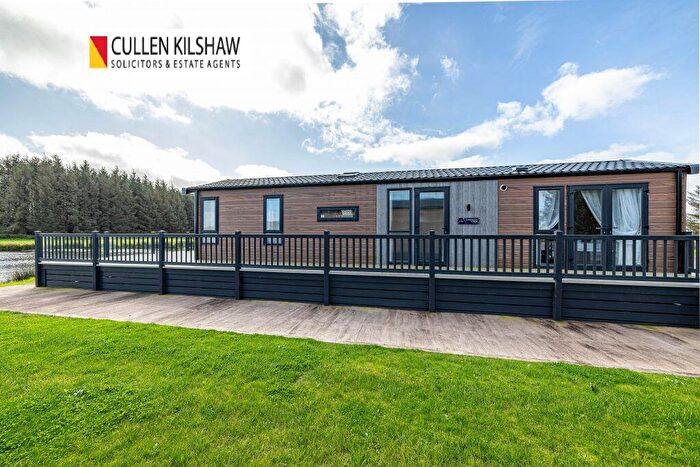
Properties for sale in Marsh
Roads and Postcodes in Marsh
Navigate through our locations to find the location of your next house in Marsh, Wigton for sale or to rent.
| Streets | Postcodes |
|---|---|
| Bowness-on-solway | CA7 5AF CA7 5AG CA7 5BH CA7 5BP CA7 5BT CA7 5BW |
| Cardurnock | CA7 5AQ |
| Criffel View | CA7 5DR |
| Fell View | CA7 5AL |
| Field View | CA7 5DA |
| Fingland | CA7 5EN |
| Greenspot | CA7 5EH |
| Hadrians Avenue | CA7 5AP |
| Irving Terrace | CA7 5DB |
| Lazonby Row | CA7 5ED |
| Mill Road | CA7 5EE |
| Moricambe Crescent | CA7 5AS |
| Quayside | CA7 5BX |
| Scotch Street | CA7 5BZ |
| Solway Drive | CA7 5AW |
| The Island | CA7 5AN |
| Water Street | CA7 5DZ |
| Waver Road | CA7 5AR |
| Whitrigg | CA7 5AA |
| CA7 0JJ CA7 0JQ CA7 5AD CA7 5AH CA7 5BA CA7 5BE CA7 5BU CA7 5BY CA7 5DL CA7 5DQ CA7 5DT CA7 5DU CA7 5DW CA7 5EB CA7 5EF CA7 5ER |
Transport near Marsh
- FAQ
- Price Paid By Year
- Property Type Price
Frequently asked questions about Marsh
What is the average price for a property for sale in Marsh?
The average price for a property for sale in Marsh is £232,666. This amount is 10% higher than the average price in Wigton. There are 941 property listings for sale in Marsh.
What streets have the most expensive properties for sale in Marsh?
The streets with the most expensive properties for sale in Marsh are Fingland at an average of £385,000, Bowness-on-solway at an average of £253,242 and The Island at an average of £192,500.
What streets have the most affordable properties for sale in Marsh?
The streets with the most affordable properties for sale in Marsh are Moricambe Crescent at an average of £107,500, Cardurnock at an average of £120,000 and Solway Drive at an average of £150,000.
Which train stations are available in or near Marsh?
Some of the train stations available in or near Marsh are Annan, Wigton and Gretna Green.
Property Price Paid in Marsh by Year
The average sold property price by year was:
| Year | Average Sold Price | Price Change |
Sold Properties
|
|---|---|---|---|
| 2025 | £240,160 | 5% |
5 Properties |
| 2024 | £228,937 | -3% |
16 Properties |
| 2023 | £234,885 | 27% |
10 Properties |
| 2022 | £170,300 | -21% |
10 Properties |
| 2021 | £205,656 | 4% |
22 Properties |
| 2020 | £198,377 | 26% |
14 Properties |
| 2019 | £147,470 | -21% |
17 Properties |
| 2018 | £179,050 | 16% |
20 Properties |
| 2017 | £150,590 | 5% |
22 Properties |
| 2016 | £142,447 | 4% |
19 Properties |
| 2015 | £136,642 | -15% |
14 Properties |
| 2014 | £156,497 | 7% |
17 Properties |
| 2013 | £144,997 | 14% |
17 Properties |
| 2012 | £124,688 | 7% |
9 Properties |
| 2011 | £116,090 | -15% |
11 Properties |
| 2010 | £133,530 | -22% |
13 Properties |
| 2009 | £163,070 | -0,5% |
10 Properties |
| 2008 | £163,850 | -2% |
12 Properties |
| 2007 | £167,910 | 4% |
23 Properties |
| 2006 | £161,969 | 8% |
23 Properties |
| 2005 | £149,694 | 6% |
18 Properties |
| 2004 | £141,375 | 24% |
20 Properties |
| 2003 | £107,304 | 44% |
29 Properties |
| 2002 | £59,944 | -7% |
34 Properties |
| 2001 | £64,348 | 18% |
34 Properties |
| 2000 | £52,445 | -7% |
22 Properties |
| 1999 | £56,275 | -22% |
18 Properties |
| 1998 | £68,512 | 27% |
25 Properties |
| 1997 | £49,733 | -2% |
15 Properties |
| 1996 | £50,778 | -16% |
25 Properties |
| 1995 | £58,950 | - |
20 Properties |
Property Price per Property Type in Marsh
Here you can find historic sold price data in order to help with your property search.
The average Property Paid Price for specific property types in the last three years are:
| Property Type | Average Sold Price | Sold Properties |
|---|---|---|
| Semi Detached House | £225,100.00 | 9 Semi Detached Houses |
| Detached House | £271,859.00 | 16 Detached Houses |
| Terraced House | £139,500.00 | 6 Terraced Houses |

