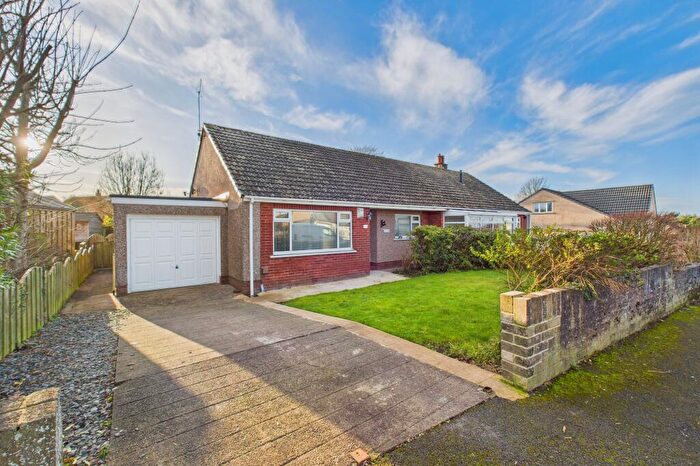
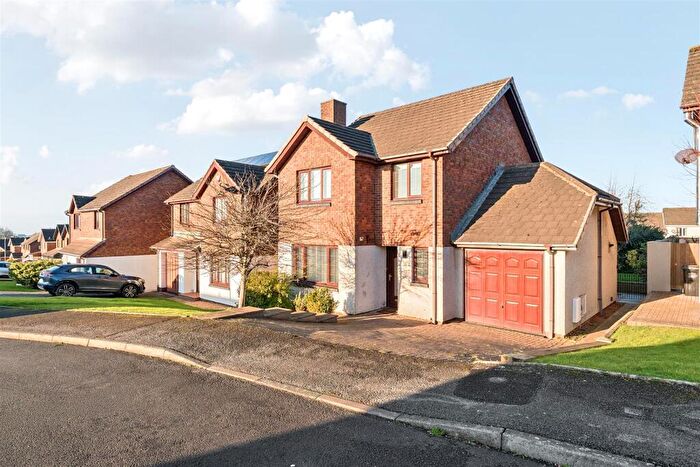
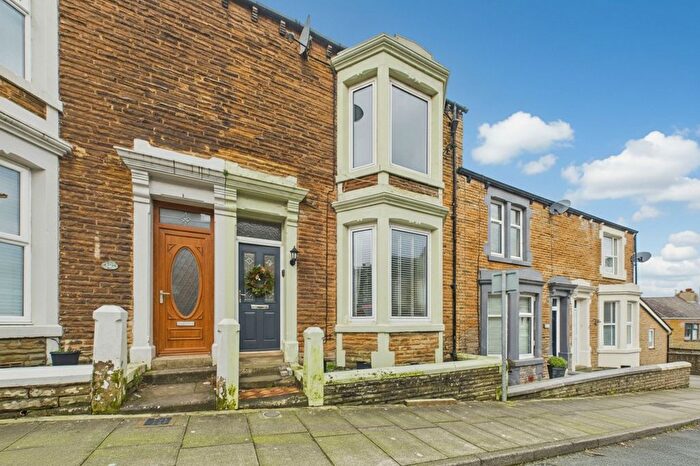
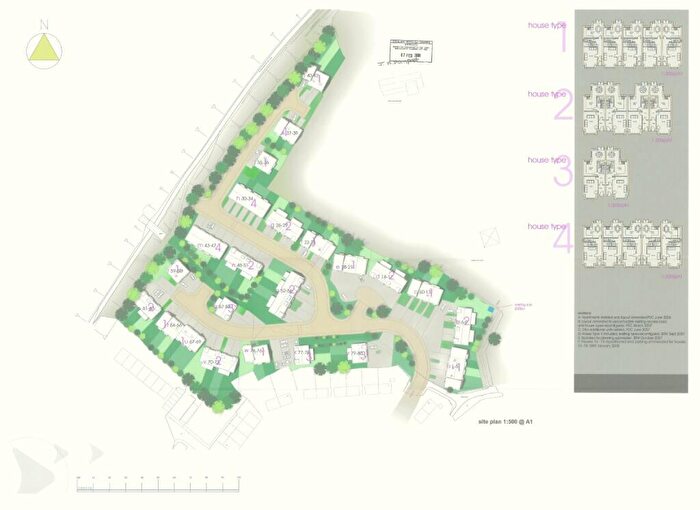
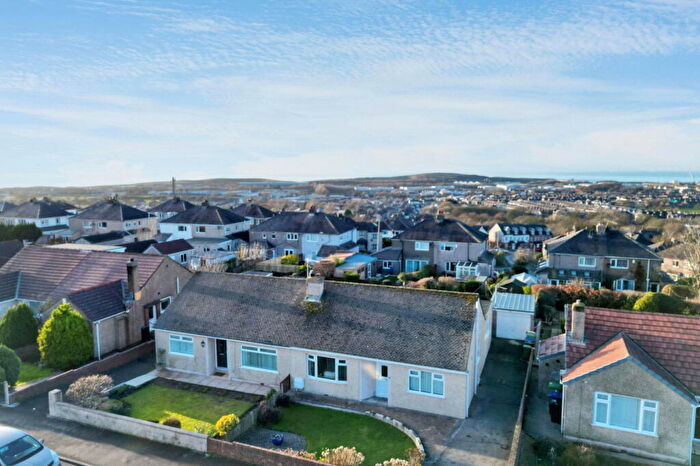
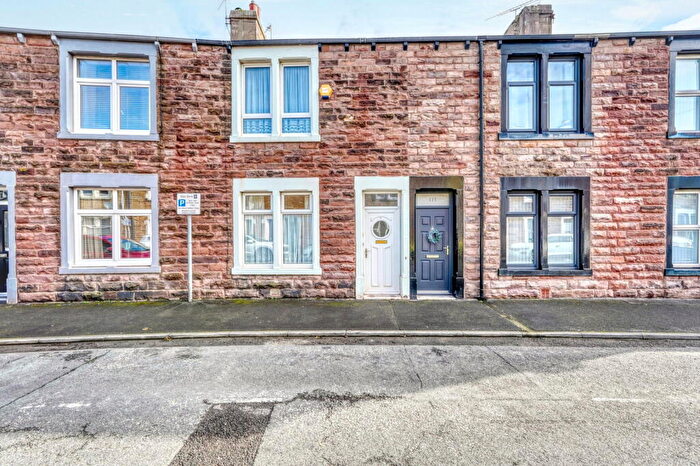
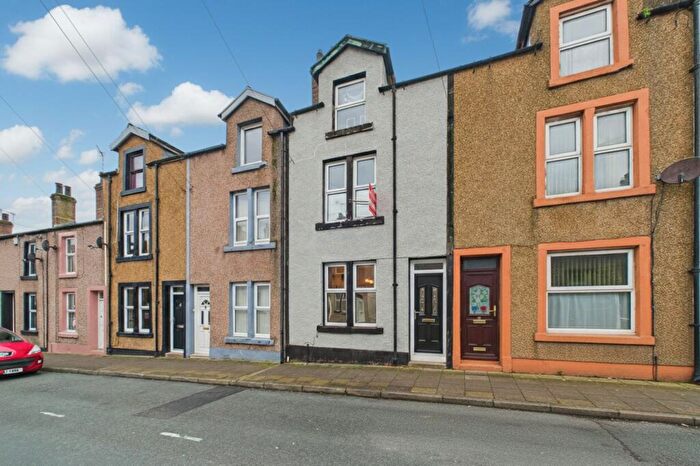
Houses for sale & to rent in Harrington, Workington
House Prices in Harrington
Properties in Harrington have an average house price of £190,075.00 and had 177 Property Transactions within the last 3 years¹.
Harrington is an area in Workington, Cumbria with 1,312 households², where the most expensive property was sold for £400,000.00.
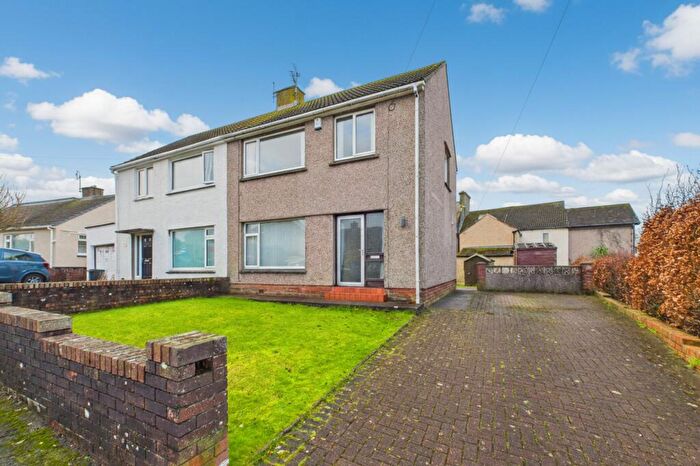
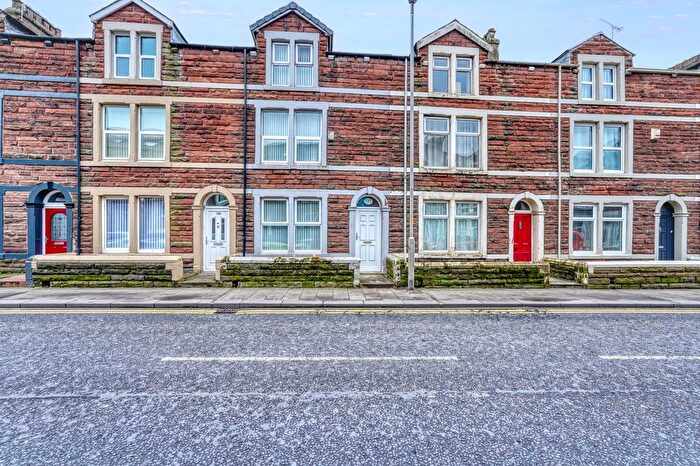
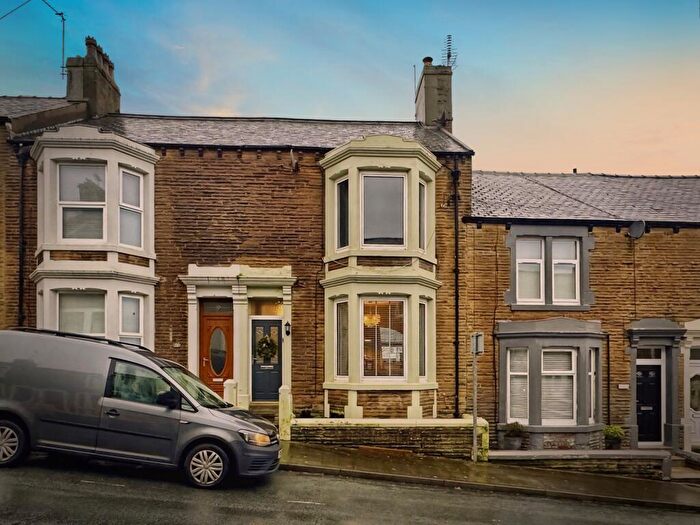
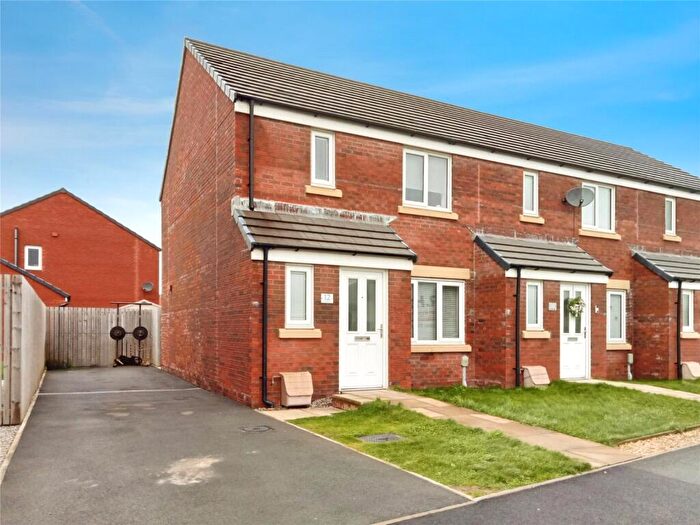
Properties for sale in Harrington
Roads and Postcodes in Harrington
Navigate through our locations to find the location of your next house in Harrington, Workington for sale or to rent.
| Streets | Postcodes |
|---|---|
| Abbey Court | CA14 4PG |
| Archer Street | CA14 5QJ |
| Bannatyne Drive | CA14 4LQ |
| Beaufort Avenue | CA14 4NR |
| Beckside | CA14 5RA |
| Beckstone Close | CA14 5QR |
| Bellaport Gardens | CA14 5QX |
| Broadacres | CA14 5RL CA14 5RN |
| Burnside | CA14 5PU |
| Castle Close | CA14 4QN |
| Christabel Road | CA14 4AH |
| Church Road | CA14 5PT CA14 5QA CA14 5QP |
| Church Road Terrace | CA14 5PL |
| Copperas Hill | CA14 5RX |
| Cromwell Crescent | CA14 4NT |
| Crooklands | CA14 4NJ |
| Dene Avenue | CA14 5PD |
| Eadie Street | CA14 5PY |
| East Avenue | CA14 5PJ |
| East Lane | CA14 5PW |
| Eller Bank | CA14 5JZ CA14 5LA |
| Florence Way | CA14 4AJ |
| Furnace Row | CA14 4NZ |
| Geltwood Avenue | CA14 4LD |
| Glenholme | CA14 5NZ |
| Grecian Terrace | CA14 5QD |
| Harringdale Road | CA14 4NU |
| High Close | CA14 5RF CA14 5RH CA14 5RQ |
| Hollins Close | CA14 5NP |
| Inglewood Close | CA14 4LE |
| Keys Brow | CA14 5RR |
| Kiln Green Avenue | CA14 4LN |
| Kipling Avenue | CA14 4NF |
| Lime Road | CA14 5QH |
| Little Croft | CA14 4PF |
| Main Road | CA14 4LH CA14 4LL CA14 4LT CA14 4NH CA14 4NL CA14 4NQ CA14 5NX CA14 5NY CA14 5PE CA14 5PF |
| Marlborough Avenue | CA14 4NW |
| Meadowdale | CA14 4JF |
| Melbourne Terrace | CA14 5PQ |
| Midtown | CA14 5RE CA14 5RG |
| Midtown Cottages | CA14 5RJ |
| Millicent Close | CA14 4LG |
| Moor View Close | CA14 4NX |
| Moorclose Road | CA14 5LB |
| Moore Way | CA14 4NB |
| Nightingale Row | CA14 4AL |
| North Shore Street | CA14 5QB |
| North Side | CA14 5QW |
| Northfield Avenue | CA14 4LJ |
| Oakley Avenue | CA14 4NP |
| Primrose Crescent | CA14 5PP |
| Primrose Terrace | CA14 5PS |
| Queens Road | CA14 4LX |
| Rectory Close | CA14 5PN |
| Rose Hill | CA14 5QL |
| Ross View | CA14 5PA CA14 5PB |
| Ruskin Close | CA14 4LP CA14 4LS |
| Scaw Road | CA14 4LU CA14 4LY CA14 4NA CA14 4ND CA14 4NG CA14 4PH |
| Scawfield | CA14 4LZ |
| Seadown Drive | CA14 4NE |
| Sibson Place | CA14 5QF |
| Simpson Street | CA14 5QS |
| Sloan Close | CA14 4LF |
| Springfield Avenue | CA14 4LW |
| Stocks Hill | CA14 5PH CA14 5RB |
| Stocks Hill Rise | CA14 5RD |
| West Ghyll Place | CA14 5RS |
| Whins Close | CA14 4AD |
| Winscales Avenue | CA14 4NY |
| Wood End Close | CA14 4QP |
| Woodville Way | CA14 4NS |
| CA14 4JG CA14 4ST CA14 4SU CA14 5RT |
Transport near Harrington
- FAQ
- Price Paid By Year
- Property Type Price
Frequently asked questions about Harrington
What is the average price for a property for sale in Harrington?
The average price for a property for sale in Harrington is £190,075. This amount is 24% higher than the average price in Workington. There are 1,832 property listings for sale in Harrington.
What streets have the most expensive properties for sale in Harrington?
The streets with the most expensive properties for sale in Harrington are Rectory Close at an average of £400,000, West Ghyll Place at an average of £380,000 and Hollins Close at an average of £360,000.
What streets have the most affordable properties for sale in Harrington?
The streets with the most affordable properties for sale in Harrington are Eller Bank at an average of £57,331, Melbourne Terrace at an average of £58,750 and Eadie Street at an average of £71,000.
Which train stations are available in or near Harrington?
Some of the train stations available in or near Harrington are Harrington, Workington and Parton.
Property Price Paid in Harrington by Year
The average sold property price by year was:
| Year | Average Sold Price | Price Change |
Sold Properties
|
|---|---|---|---|
| 2025 | £197,603 | 3% |
54 Properties |
| 2024 | £190,822 | 5% |
68 Properties |
| 2023 | £181,760 | 5% |
55 Properties |
| 2022 | £172,571 | 4% |
64 Properties |
| 2021 | £165,480 | -6% |
66 Properties |
| 2020 | £174,717 | 8% |
48 Properties |
| 2019 | £161,216 | -2% |
62 Properties |
| 2018 | £165,202 | 10% |
50 Properties |
| 2017 | £147,936 | 9% |
61 Properties |
| 2016 | £135,124 | -23% |
74 Properties |
| 2015 | £165,895 | -8% |
138 Properties |
| 2014 | £178,599 | 19% |
88 Properties |
| 2013 | £144,783 | -13% |
51 Properties |
| 2012 | £163,895 | 13% |
36 Properties |
| 2011 | £142,836 | -7% |
37 Properties |
| 2010 | £153,202 | 11% |
43 Properties |
| 2009 | £135,959 | 5% |
42 Properties |
| 2008 | £129,839 | -1% |
25 Properties |
| 2007 | £131,635 | -3% |
69 Properties |
| 2006 | £135,269 | 7% |
57 Properties |
| 2005 | £126,461 | 16% |
48 Properties |
| 2004 | £106,309 | 22% |
73 Properties |
| 2003 | £83,334 | 12% |
59 Properties |
| 2002 | £73,220 | 24% |
82 Properties |
| 2001 | £55,955 | -4% |
59 Properties |
| 2000 | £58,027 | 13% |
79 Properties |
| 1999 | £50,580 | -1% |
55 Properties |
| 1998 | £51,029 | 3% |
60 Properties |
| 1997 | £49,476 | 4% |
67 Properties |
| 1996 | £47,565 | -5% |
72 Properties |
| 1995 | £49,898 | - |
62 Properties |
Property Price per Property Type in Harrington
Here you can find historic sold price data in order to help with your property search.
The average Property Paid Price for specific property types in the last three years are:
| Property Type | Average Sold Price | Sold Properties |
|---|---|---|
| Semi Detached House | £184,073.00 | 63 Semi Detached Houses |
| Detached House | £258,321.00 | 59 Detached Houses |
| Terraced House | £127,896.00 | 51 Terraced Houses |
| Flat | £70,750.00 | 4 Flats |

