
Houses for sale & to rent in Central, Darlington
House Prices in Central
Properties in Central have an average house price of £115k and had 195 Property Transactions within the last 3 years¹.
Central is an area in Darlington, Darlington with 1,865 households², where the most expensive property was sold for £405k.
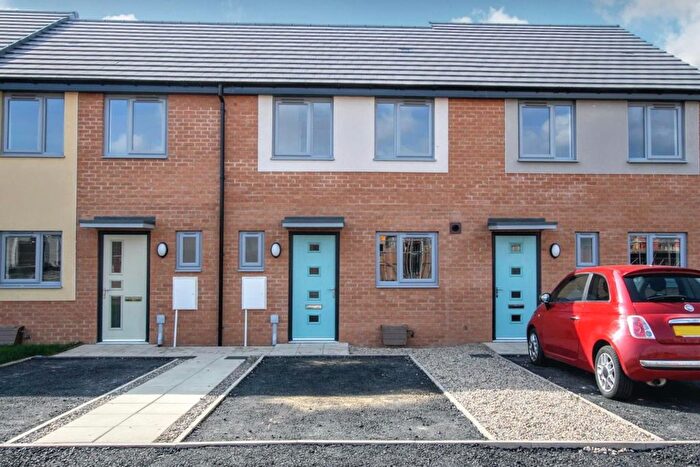
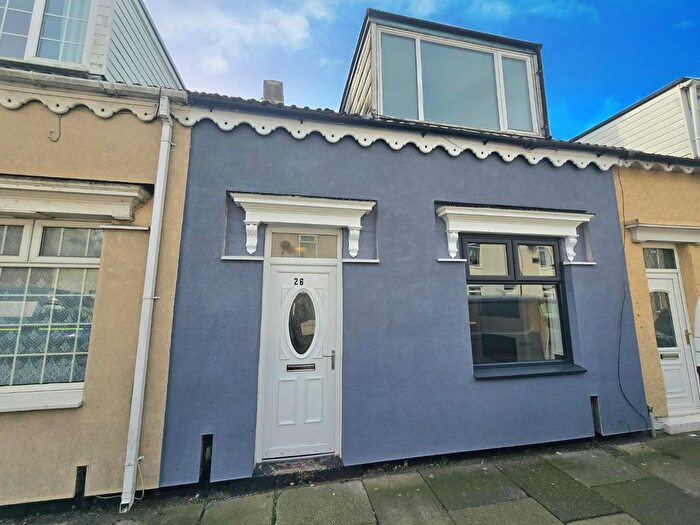
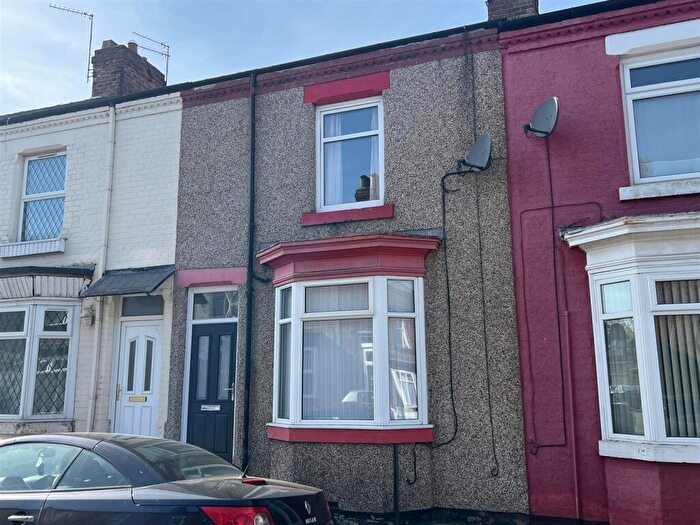
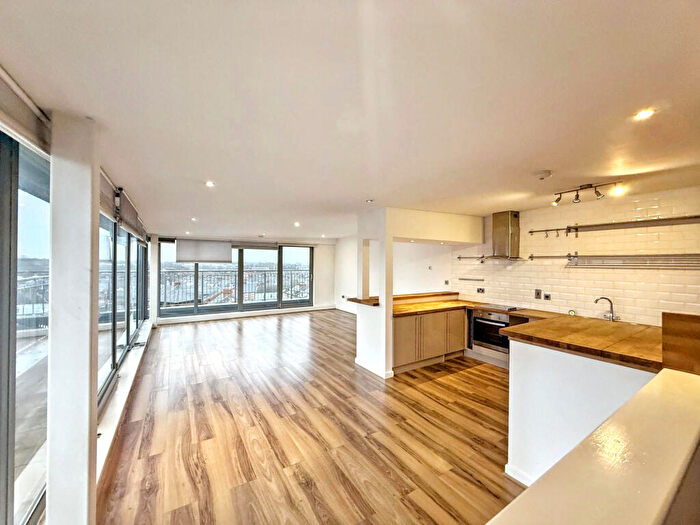
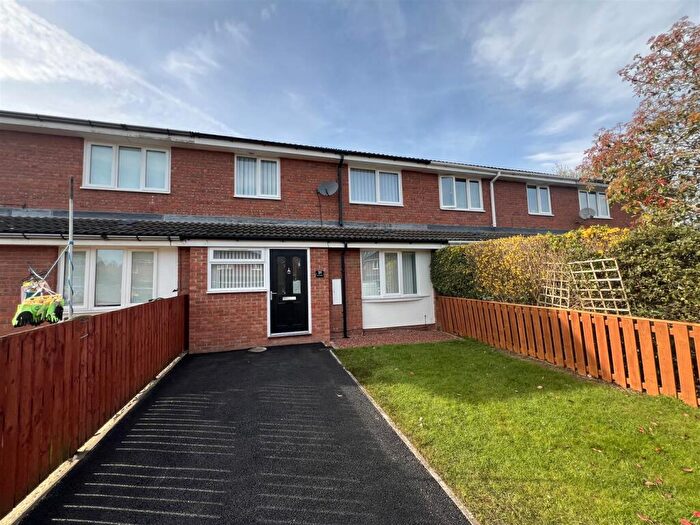
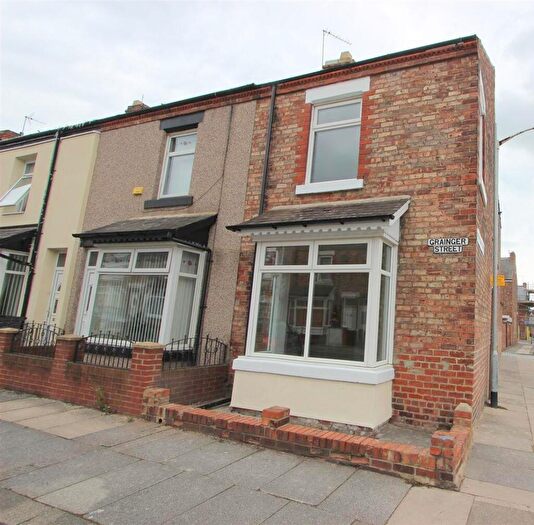
Properties for sale in Central
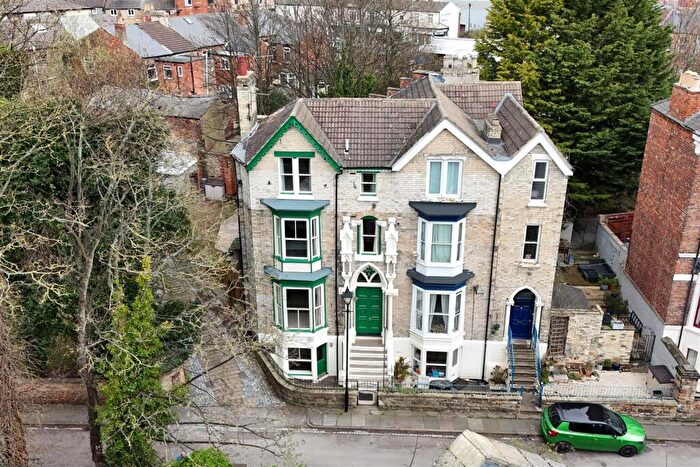
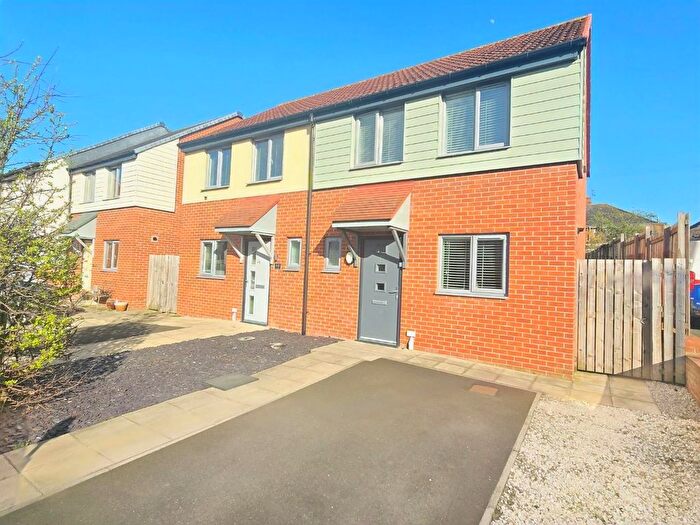
![]()
If you are looking to sell your house, let it out, or receive a property valuation, an expert can help you.
Click the button below to get started.

Roads and Postcodes in Central
Navigate through our locations to find the location of your next house in Central, Darlington for sale or to rent.
| Streets | Postcodes |
|---|---|
| Allan Street | DL1 2LU DL1 2NR |
| Alliance Industrial Estate | DL1 2PA |
| Beck Road | DL1 1TW |
| Blackwellgate | DL1 5HL DL1 5HW |
| Bondgate | DL3 7JE DL3 7JJ |
| Borough Road | DL1 1SD DL1 1SG DL1 1SR DL1 1SW |
| Bowes Court | DL1 2HL |
| Chancery Lane | DL1 5QP |
| Chapel Cottages | DL1 2JY |
| Church Grove | DL1 2LS |
| Clarks Yard | DL3 7QG DL3 7QH |
| Cleveland Street | DL1 2JU |
| Coniscliffe Road | DL3 7EE DL3 7RG |
| Cornwall Avenue | DL1 2LJ |
| Devonshire Road | DL1 2LE |
| Dorset Drive | DL1 2LH |
| Duke Street | DL3 7AA DL3 7AJ DL3 7AN DL3 7AQ DL3 7RX DL3 7SD |
| Dumfries Street | DL1 1LB |
| Dundee Street | DL1 1JX |
| East Raby Street | DL3 7TJ |
| Eastmount Road | DL1 1JY DL1 1JZ DL1 1LA DL1 1LE |
| Eskdale Street | DL3 7DE DL3 7DG |
| Essex Way | DL1 2LF |
| Fairweather Court | DL3 7TS |
| Falstaff Court | DL1 1GA |
| Freemans Place | DL1 1SZ |
| Garden Street | DL1 1QP |
| Gloucester Place | DL1 2LG |
| Grey Street | DL1 2LY |
| Hargreave Terrace | DL1 5LE DL1 5LF |
| Haughton Road | DL1 1JP DL1 1SS DL1 1SU DL1 2BP DL1 2DA DL1 2JX DL1 2LB DL1 2LD |
| High Northgate | DL1 1UL |
| Hilda Street | DL1 1SY |
| Houndgate | DL1 5RF DL1 5RL |
| Huntley Street | DL1 5LQ |
| Killinghall Street | DL1 2NE |
| Kirkby Close | DL1 2PN |
| Larchfield Street | DL3 7DL DL3 7DQ DL3 7TE DL3 7TF DL3 7TG |
| Leadenhall Street | DL1 1RD |
| Lodge Street | DL1 1TD |
| Lucknow Street | DL1 2NP |
| Melland Street | DL1 1SF |
| Middleton Street | DL1 1SL |
| Montrose Street | DL1 1JU |
| Napier Street | DL3 7DJ DL3 7DN DL3 7DW |
| Nestfield Street | DL1 2LZ |
| North Eastern Terrace | DL1 5LL |
| Northgate | DL1 1QS DL1 1RA |
| Northumberland Street | DL3 7HB |
| Outram Street | DL3 7DB DL3 7DD DL3 7DF DL3 7DP |
| Parkgate | DL1 1RX DL1 1RZ |
| Pensbury Street | DL1 5LH DL1 5LJ |
| Portland Place | DL3 7BP |
| Post House Wynd | DL3 7LP DL3 7LU |
| Powlett Street | DL3 7TL |
| Prescott Street | DL1 2ND |
| Primrose Street | DL3 7TN |
| Raby Street | DL3 7TH |
| Raby Terrace | DL3 7TW |
| Russell Street | DL1 1TB |
| Sanderson Street | DL1 1SJ |
| Shutts Court | DL3 7PD |
| Skinnergate | DL3 7LX DL3 7NR |
| Somerset Grove | DL1 2LL |
| St James Court | DL1 2LX |
| Stanhope Road North | DL3 7AP |
| Stanhope Road South | DL3 7SF |
| Sussex Way | DL1 2LQ |
| Throstlenest Avenue | DL1 2BH |
| Valley Street North | DL1 1PY |
| Victoria Road | DL1 5JH DL1 5JJ DL1 5JQ DL1 5SF |
| Weir Street | DL1 1QN |
| West Powlett Street | DL3 7TQ |
| Westgarth Terrace | DL1 2LA |
| Wolsingham Terrace | DL1 2JZ |
| Woodland Road | DL3 7BJ |
| Wycombe Street | DL3 7DA |
| DL1 1RB |
Transport near Central

- FAQ
- Price Paid By Year
- Property Type Price
Frequently asked questions about Central
What is the average price for a property for sale in Central?
The average price for a property for sale in Central is £115,092. This amount is 30% lower than the average price in Darlington. There are 1,186 property listings for sale in Central.
What streets have the most expensive properties for sale in Central?
The streets with the most expensive properties for sale in Central are Stanhope Road North at an average of £337,290, Stanhope Road South at an average of £325,000 and Bowes Court at an average of £175,500.
What streets have the most affordable properties for sale in Central?
The streets with the most affordable properties for sale in Central are North Eastern Terrace at an average of £48,750, Borough Road at an average of £52,000 and St James Court at an average of £58,300.
Which train stations are available in or near Central?
Some of the train stations available in or near Central are Darlington, North Road and Dinsdale.
Property Price Paid in Central by Year
The average sold property price by year was:
| Year | Average Sold Price | Price Change |
Sold Properties
|
|---|---|---|---|
| 2026 | £115,000 | 1% |
4 Properties |
| 2025 | £114,378 | 1% |
56 Properties |
| 2024 | £113,423 | -3% |
59 Properties |
| 2023 | £116,918 | 10% |
76 Properties |
| 2022 | £105,100 | -13% |
87 Properties |
| 2021 | £118,779 | 33% |
106 Properties |
| 2020 | £79,475 | -0,2% |
37 Properties |
| 2019 | £79,659 | -22% |
63 Properties |
| 2018 | £97,408 | 4% |
54 Properties |
| 2017 | £93,845 | 0,5% |
66 Properties |
| 2016 | £93,421 | 5% |
57 Properties |
| 2015 | £88,982 | 2% |
52 Properties |
| 2014 | £87,522 | 1% |
60 Properties |
| 2013 | £86,342 | 9% |
41 Properties |
| 2012 | £78,189 | -10% |
40 Properties |
| 2011 | £85,636 | -19% |
45 Properties |
| 2010 | £101,630 | -5% |
31 Properties |
| 2009 | £106,815 | -12% |
49 Properties |
| 2008 | £119,205 | 4% |
90 Properties |
| 2007 | £114,076 | 12% |
221 Properties |
| 2006 | £100,151 | 10% |
152 Properties |
| 2005 | £89,776 | 8% |
117 Properties |
| 2004 | £82,328 | 24% |
146 Properties |
| 2003 | £62,873 | 27% |
171 Properties |
| 2002 | £45,628 | 11% |
154 Properties |
| 2001 | £40,480 | 18% |
101 Properties |
| 2000 | £33,085 | 2% |
81 Properties |
| 1999 | £32,288 | -18% |
71 Properties |
| 1998 | £38,186 | 12% |
74 Properties |
| 1997 | £33,601 | 1% |
67 Properties |
| 1996 | £33,187 | -10% |
75 Properties |
| 1995 | £36,391 | - |
65 Properties |
Property Price per Property Type in Central
Here you can find historic sold price data in order to help with your property search.
The average Property Paid Price for specific property types in the last three years are:
| Property Type | Average Sold Price | Sold Properties |
|---|---|---|
| Semi Detached House | £140,764.00 | 25 Semi Detached Houses |
| Detached House | £225,857.00 | 7 Detached Houses |
| Terraced House | £110,943.00 | 134 Terraced Houses |
| Flat | £85,396.00 | 29 Flats |