
Houses for sale & to rent in Park East, Darlington
House Prices in Park East
Properties in Park East have an average house price of £130k and had 264 Property Transactions within the last 3 years¹.
Park East is an area in Darlington, Darlington with 2,945 households², where the most expensive property was sold for £765k.
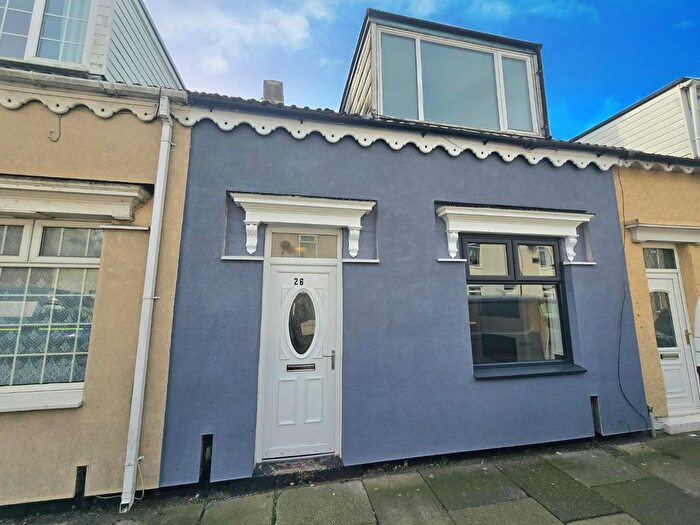
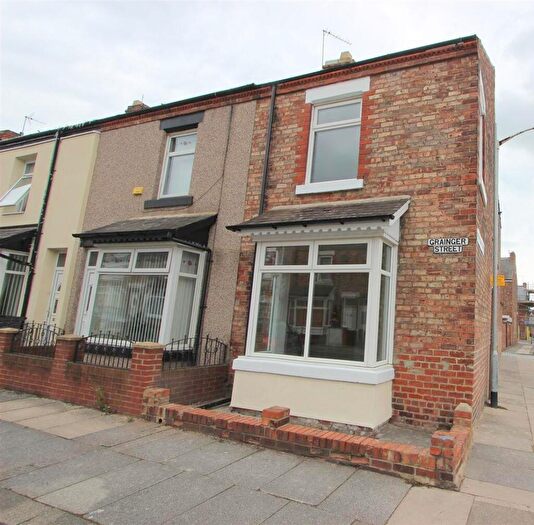
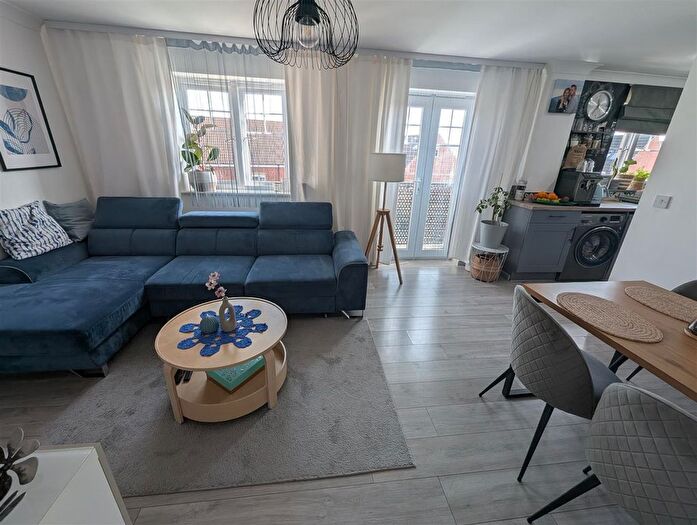
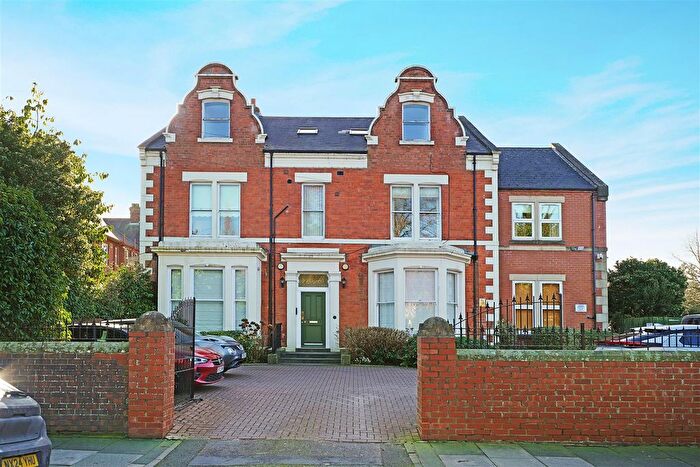
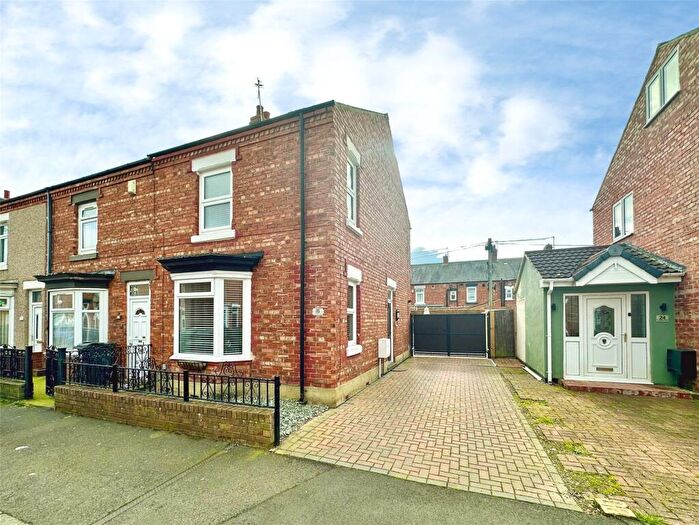
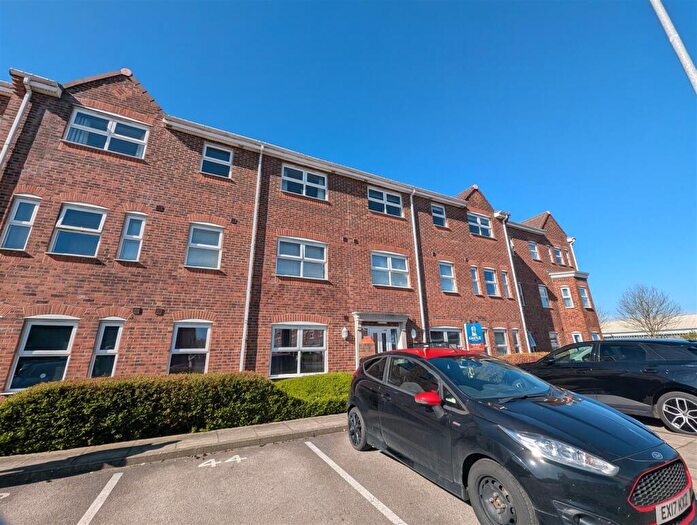
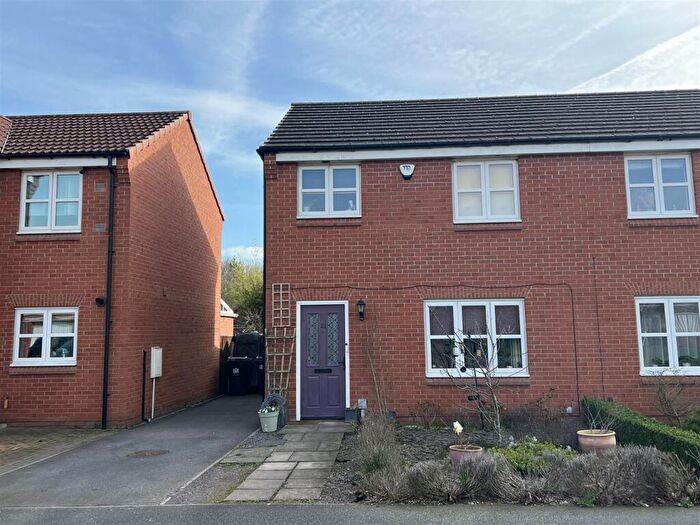
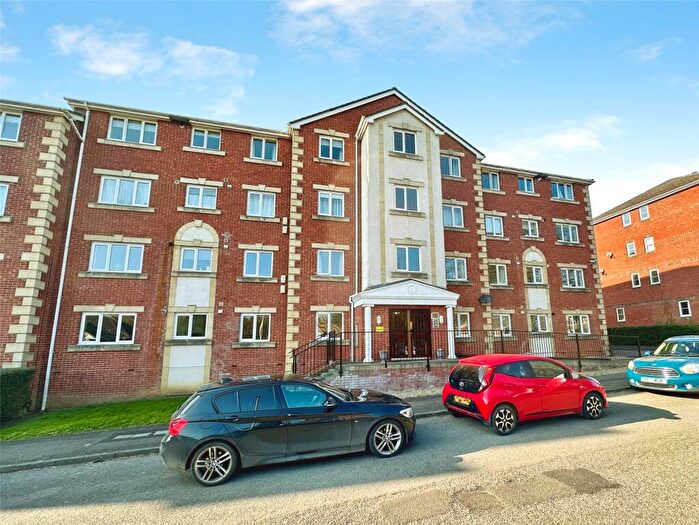
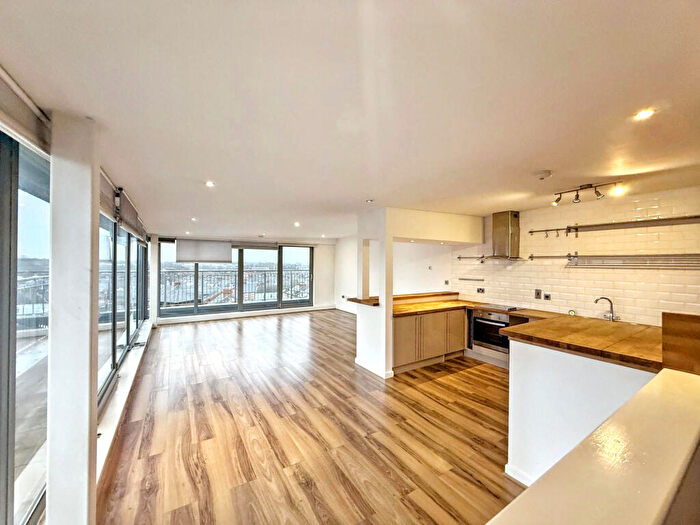
Properties for sale in Park East
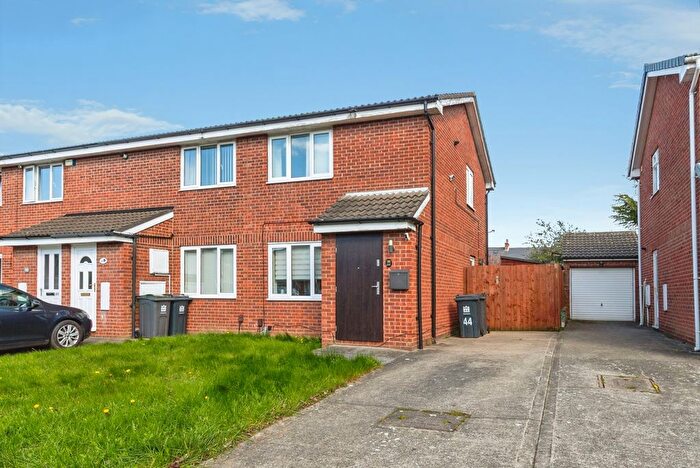
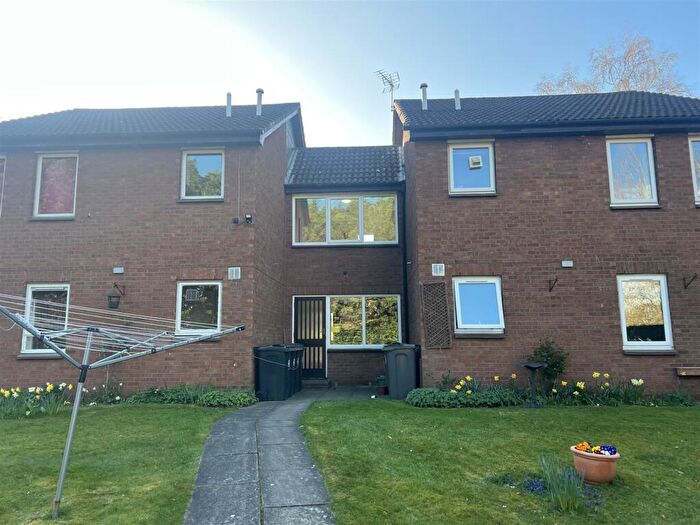
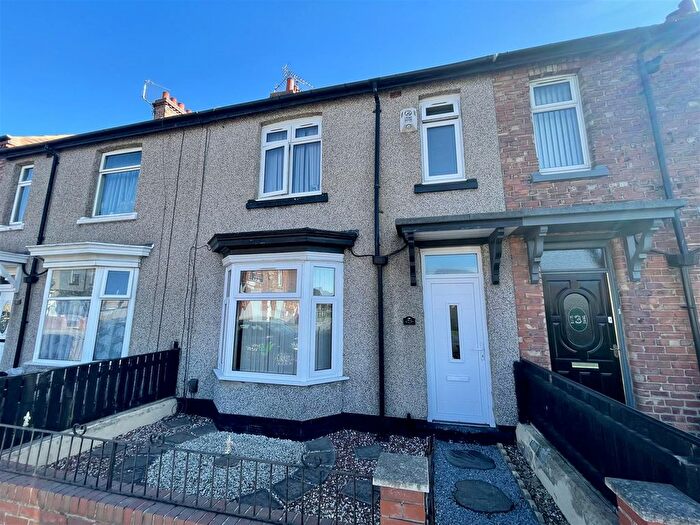
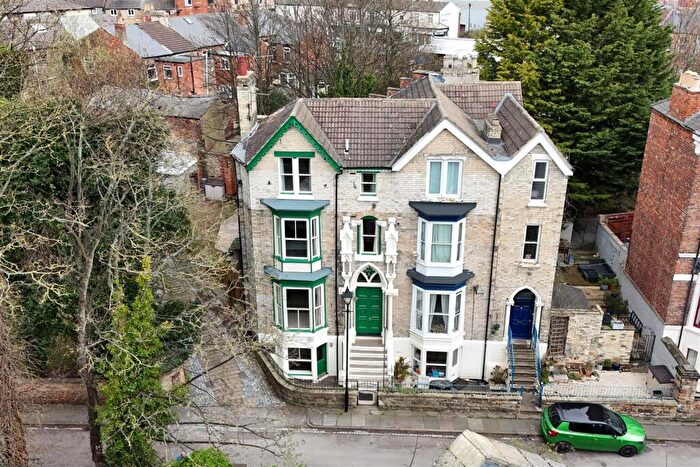
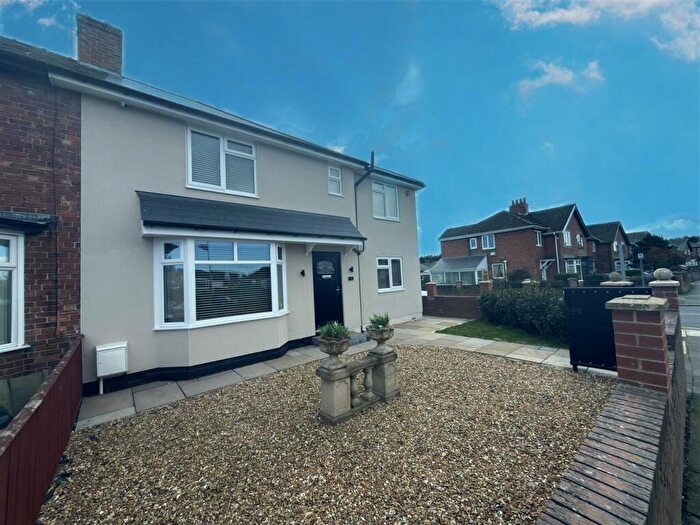
![]()
If you are looking to sell your house, let it out, or receive a property valuation, an expert can help you.
Click the button below to get started.


Roads and Postcodes in Park East
Navigate through our locations to find the location of your next house in Park East, Darlington for sale or to rent.
Transport near Park East

- FAQ
- Price Paid By Year
- Property Type Price
Frequently asked questions about Park East
What is the average price for a property for sale in Park East?
The average price for a property for sale in Park East is £130,094. This amount is 20% lower than the average price in Darlington. There are 1,065 property listings for sale in Park East.
What streets have the most expensive properties for sale in Park East?
The streets with the most expensive properties for sale in Park East are Coniscliffe Road at an average of £345,000, Oakdene Avenue at an average of £325,785 and Beechwood Avenue at an average of £278,333.
What streets have the most affordable properties for sale in Park East?
The streets with the most affordable properties for sale in Park East are Smithfield Road at an average of £58,000, George Street at an average of £68,500 and Severn Way at an average of £71,750.
Which train stations are available in or near Park East?
Some of the train stations available in or near Park East are Darlington, North Road and Dinsdale.
Property Price Paid in Park East by Year
The average sold property price by year was:
| Year | Average Sold Price | Price Change |
Sold Properties
|
|---|---|---|---|
| 2026 | £94,900 | -51% |
5 Properties |
| 2025 | £143,132 | 17% |
83 Properties |
| 2024 | £119,006 | -10% |
87 Properties |
| 2023 | £130,751 | 12% |
89 Properties |
| 2022 | £114,666 | -6% |
103 Properties |
| 2021 | £122,066 | -1% |
127 Properties |
| 2020 | £123,729 | 12% |
90 Properties |
| 2019 | £108,764 | 3% |
88 Properties |
| 2018 | £105,587 | -5% |
73 Properties |
| 2017 | £110,422 | -6% |
86 Properties |
| 2016 | £116,968 | 6% |
99 Properties |
| 2015 | £109,443 | -2% |
85 Properties |
| 2014 | £111,918 | 8% |
98 Properties |
| 2013 | £102,872 | 18% |
75 Properties |
| 2012 | £83,997 | -26% |
62 Properties |
| 2011 | £105,959 | 3% |
59 Properties |
| 2010 | £102,717 | -1% |
68 Properties |
| 2009 | £103,965 | -8% |
58 Properties |
| 2008 | £112,265 | -9% |
97 Properties |
| 2007 | £122,535 | 11% |
155 Properties |
| 2006 | £109,417 | 8% |
147 Properties |
| 2005 | £101,039 | 8% |
109 Properties |
| 2004 | £92,596 | 20% |
155 Properties |
| 2003 | £74,090 | 17% |
173 Properties |
| 2002 | £61,554 | 16% |
165 Properties |
| 2001 | £51,803 | -6% |
136 Properties |
| 2000 | £54,758 | 13% |
142 Properties |
| 1999 | £47,388 | 7% |
95 Properties |
| 1998 | £44,069 | -8% |
117 Properties |
| 1997 | £47,572 | 10% |
110 Properties |
| 1996 | £43,015 | 1% |
99 Properties |
| 1995 | £42,448 | - |
79 Properties |
Property Price per Property Type in Park East
Here you can find historic sold price data in order to help with your property search.
The average Property Paid Price for specific property types in the last three years are:
| Property Type | Average Sold Price | Sold Properties |
|---|---|---|
| Semi Detached House | £144,143.00 | 73 Semi Detached Houses |
| Detached House | £375,166.00 | 6 Detached Houses |
| Terraced House | £120,077.00 | 154 Terraced Houses |
| Flat | £99,337.00 | 31 Flats |