
Houses for sale & to rent in Cockerton East, Darlington
House Prices in Cockerton East
Properties in Cockerton East have an average house price of £161,261.00 and had 261 Property Transactions within the last 3 years¹.
Cockerton East is an area in Darlington, Darlington with 1,985 households², where the most expensive property was sold for £415,000.00.
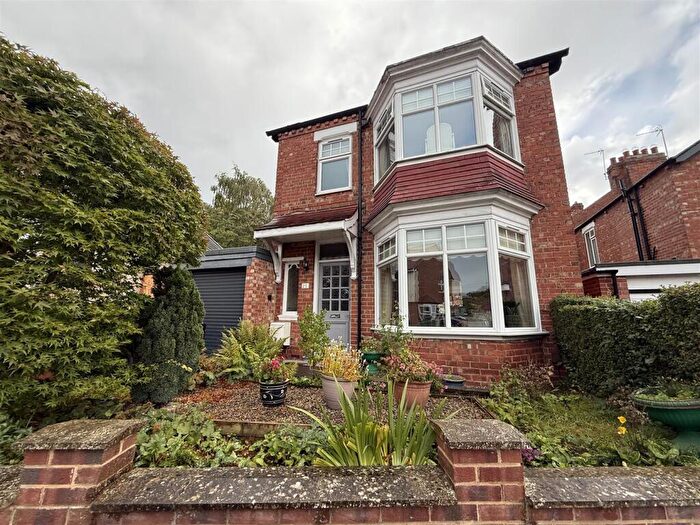
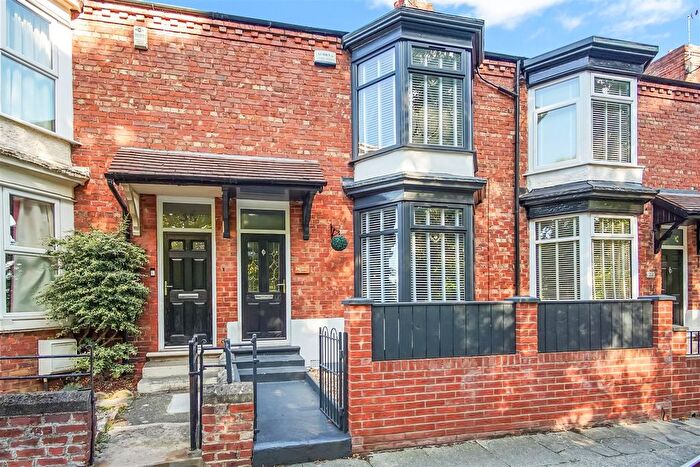
Properties for sale in Cockerton East

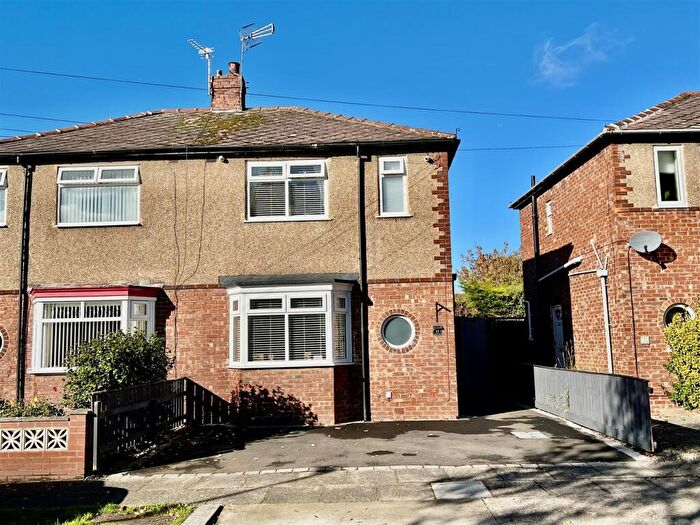
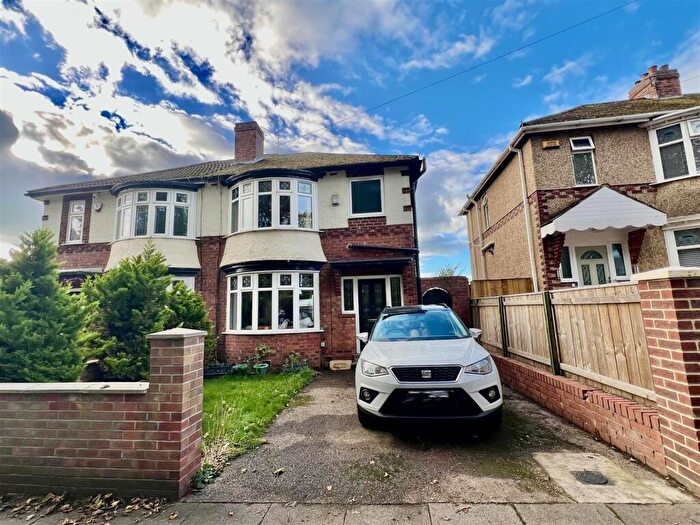

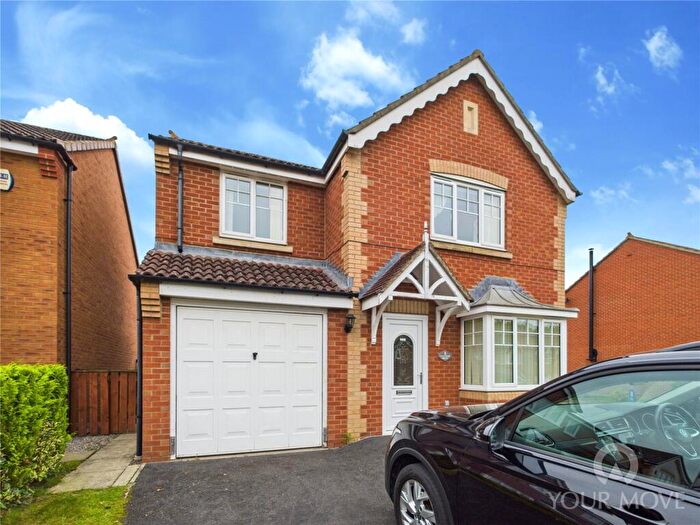
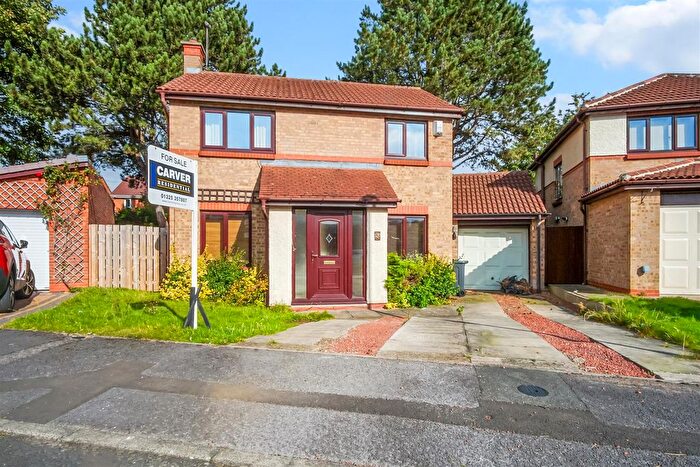
![]()
If you are looking to sell your house, let it out, or receive a property valuation, an expert can help you.
Click the button below to get started.


Roads and Postcodes in Cockerton East
Navigate through our locations to find the location of your next house in Cockerton East, Darlington for sale or to rent.
| Streets | Postcodes |
|---|---|
| Aldgrove Way | DL3 0GR |
| Amiens Close | DL3 0UL |
| Archdeacon Crescent | DL3 0BH |
| Armstrong Court | DL3 9LB |
| Bates Avenue | DL3 0TJ DL3 0TL DL3 0TN DL3 0TS DL3 0TU DL3 0UE |
| Bellburn Lane | DL3 0JR DL3 0LW |
| Berrybank Crest | DL3 0BJ |
| Bliss Close | DL3 0YZ |
| Blossom Close | DL3 0YX |
| Bluebell Close | DL3 0YU |
| Bowen Road | DL3 0TH |
| Brawton Grove | DL3 0GL |
| Brinkburn Avenue | DL3 0JN DL3 0JW |
| Brinkburn Drive | DL3 0JX DL3 0JY DL3 0LA DL3 0LB |
| Brinkburn Road | DL3 6EB |
| Callum Close | DL3 0RE |
| Cottingham Court | DL3 0BW |
| Crossfield Road | DL3 0TG DL3 0TR |
| Darrowby Drive | DL3 0GY DL3 0GZ |
| Elvet Place | DL3 0DA |
| Farnham Drive | DL3 0RS |
| Hartington Way | DL3 0GP DL3 0RZ |
| Hensfield Grove | DL3 0GT |
| Highfield Road | DL3 0DY DL3 0DZ DL3 0EA |
| Honeywood Gardens | DL3 0LL |
| Hunstanworth Road | DL3 0BN DL3 0BP |
| Ivywood Court | DL3 0LN |
| Lady Kathryn Grove | DL3 0YR |
| Leach Grove | DL3 0TW |
| Mansley Court | DL3 0GN |
| Marwood Crescent | DL3 0JU |
| Marycourt | DL3 9EY |
| Meadowfield Road | DL3 0DT DL3 0DU DL3 0DX |
| Milkwood Court | DL3 0JS |
| Mornington Lane | DL3 0JT |
| Mulheim Close | DL3 0UJ |
| Newton Lane | DL3 9EX |
| Nickstream Lane | DL3 0DB |
| Prior Dene | DL3 9EW |
| Redworth Road | DL3 0BL |
| Richmond Close | DL3 0DS |
| Rye Hill | DL3 0LE |
| Sandriggs | DL3 0TP DL3 0TY DL3 0TZ DL3 0UA DL3 0UB |
| School Street | DL3 0UG |
| Sildale Close | DL3 0GU |
| Skeldale Grove | DL3 0GW |
| Spring Court | DL3 0SR |
| Stooperdale Avenue | DL3 0UD DL3 0UF DL3 0UH DL3 0UQ |
| Sugar Hill Grove | DL3 0AF |
| Therby Close | DL3 0GS |
| Tristram Avenue | DL3 0RF |
| Walworth Crescent | DL3 0TX |
| Wayland Terrace | DL3 0JP |
| Wederly Close | DL3 0GX |
| West Auckland Road | DL3 0LF DL3 0SP |
Transport near Cockerton East

- FAQ
- Price Paid By Year
- Property Type Price
Frequently asked questions about Cockerton East
What is the average price for a property for sale in Cockerton East?
The average price for a property for sale in Cockerton East is £161,261. This amount is 2% lower than the average price in Darlington. There are 882 property listings for sale in Cockerton East.
What streets have the most expensive properties for sale in Cockerton East?
The streets with the most expensive properties for sale in Cockerton East are Bliss Close at an average of £415,000, Mansley Court at an average of £249,000 and Farnham Drive at an average of £237,916.
What streets have the most affordable properties for sale in Cockerton East?
The streets with the most affordable properties for sale in Cockerton East are Armstrong Court at an average of £68,333, Blossom Close at an average of £93,750 and Cottingham Court at an average of £109,833.
Which train stations are available in or near Cockerton East?
Some of the train stations available in or near Cockerton East are North Road, Darlington and Heighington.
Property Price Paid in Cockerton East by Year
The average sold property price by year was:
| Year | Average Sold Price | Price Change |
Sold Properties
|
|---|---|---|---|
| 2025 | £166,460 | 6% |
25 Properties |
| 2024 | £156,060 | -2% |
84 Properties |
| 2023 | £159,685 | -5% |
77 Properties |
| 2022 | £166,971 | 11% |
75 Properties |
| 2021 | £148,406 | 9% |
85 Properties |
| 2020 | £134,820 | 6% |
79 Properties |
| 2019 | £127,147 | -3% |
91 Properties |
| 2018 | £130,916 | -6% |
83 Properties |
| 2017 | £139,058 | 5% |
90 Properties |
| 2016 | £131,617 | 8% |
90 Properties |
| 2015 | £120,649 | -12% |
75 Properties |
| 2014 | £135,590 | 7% |
107 Properties |
| 2013 | £126,531 | 3% |
93 Properties |
| 2012 | £123,268 | -5% |
72 Properties |
| 2011 | £129,579 | 8% |
62 Properties |
| 2010 | £118,706 | -7% |
65 Properties |
| 2009 | £126,715 | -3% |
52 Properties |
| 2008 | £130,872 | -4% |
59 Properties |
| 2007 | £135,910 | 5% |
134 Properties |
| 2006 | £129,154 | 4% |
119 Properties |
| 2005 | £124,133 | - |
96 Properties |
| 2004 | £124,161 | 13% |
192 Properties |
| 2003 | £108,348 | 30% |
164 Properties |
| 2002 | £75,443 | 9% |
130 Properties |
| 2001 | £68,668 | 11% |
205 Properties |
| 2000 | £61,407 | 7% |
170 Properties |
| 1999 | £56,965 | 4% |
147 Properties |
| 1998 | £54,533 | 4% |
153 Properties |
| 1997 | £52,409 | 3% |
163 Properties |
| 1996 | £50,714 | 10% |
126 Properties |
| 1995 | £45,888 | - |
57 Properties |
Property Price per Property Type in Cockerton East
Here you can find historic sold price data in order to help with your property search.
The average Property Paid Price for specific property types in the last three years are:
| Property Type | Average Sold Price | Sold Properties |
|---|---|---|
| Semi Detached House | £157,858.00 | 196 Semi Detached Houses |
| Detached House | £231,515.00 | 32 Detached Houses |
| Terraced House | £132,818.00 | 22 Terraced Houses |
| Flat | £74,409.00 | 11 Flats |