
Houses for sale & to rent in Faverdale, Darlington
House Prices in Faverdale
Properties in Faverdale have an average house price of £179k and had 171 Property Transactions within the last 3 years¹.
Faverdale is an area in Darlington, Darlington with 1,137 households², where the most expensive property was sold for £435k.
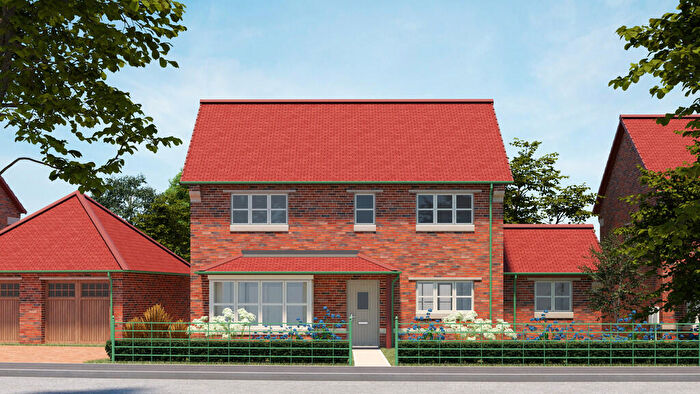
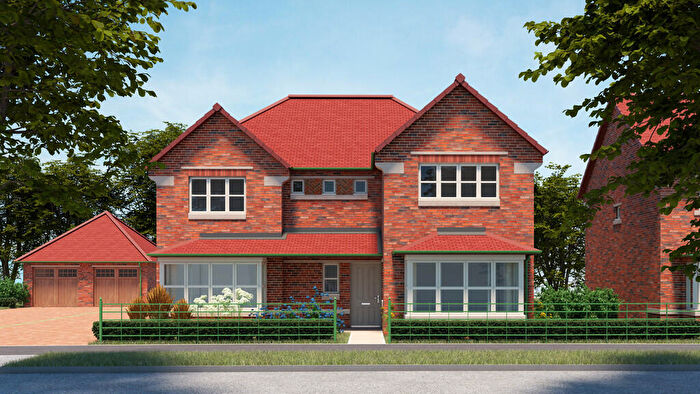
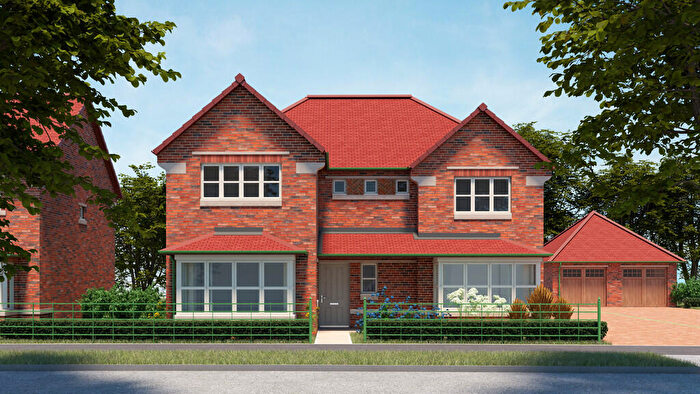
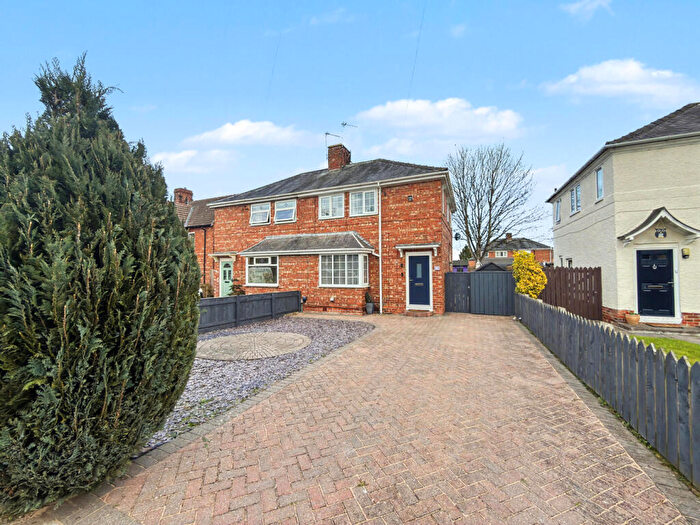
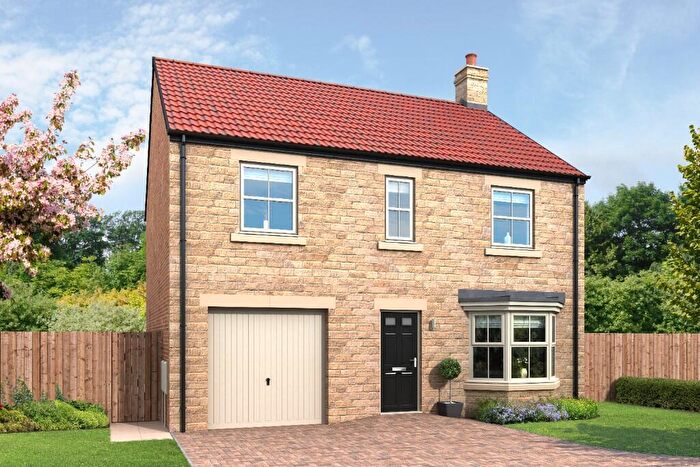
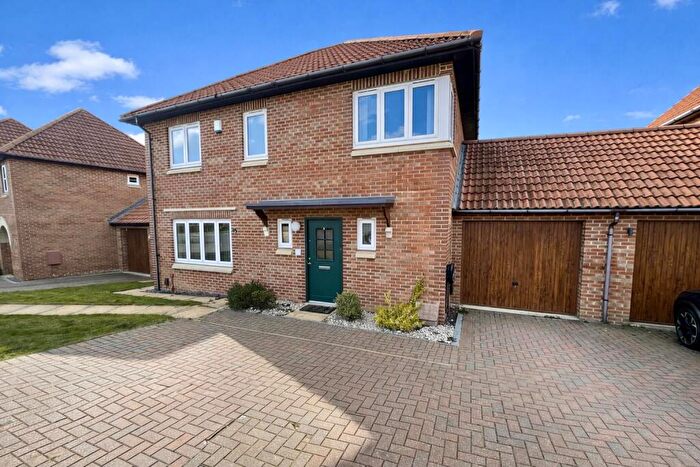
Properties for sale in Faverdale
![]()
If you are looking to sell your house, let it out, or receive a property valuation, an expert can help you.
Click the button below to get started.
Roads and Postcodes in Faverdale
Navigate through our locations to find the location of your next house in Faverdale, Darlington for sale or to rent.
| Streets | Postcodes |
|---|---|
| Abbotsfield Way | DL3 0GB |
| Abercorn Court | DL3 0GF |
| Agricola Court | DL3 0GE |
| Ainsley Grove | DL3 0GD |
| Alverton Drive | DL3 0BD DL3 0GA |
| Amberley Grove | DL3 0GG |
| Bakewell Mews | DL2 2FB |
| Bleath Ghyll | DL2 2GS |
| Chantry Close | DL3 0BG |
| Charnwood Drive | DL3 0EG |
| Clowbeck Court | DL3 0BB DL3 0BQ |
| Collingsway | DL2 2FD |
| Colpitts Lane | DL2 2FG |
| Comets Garth | DL2 2FL |
| Curlew Close | DL3 0EQ |
| Daylesford Grove | DL3 0GJ |
| Didcot Close | DL3 0GQ |
| Duxford Grove | DL3 0GH |
| Faverdale Road | DL3 0TA |
| Faversham Park | DL3 0UN |
| George Stephenson Drive | DL2 2GE |
| Gilderdale Close | DL3 0EE |
| Glanton Court | DL3 0NY |
| Greenrigg Close | DL3 0EF |
| Greensfield Close | DL3 0ED |
| Gunnerton Close | DL3 0NZ |
| Holderness Drive | DL2 2FE |
| Hubback Square | DL2 2FH |
| Locomotion Lane | DL2 2GJ |
| Old Favourites Walk | DL2 2FJ |
| Paradise Way | DL2 2GD |
| Rainhill Way | DL2 2GA |
| Raisby Lane | DL2 2GQ |
| Redrose Close | DL2 2FP |
| Sans Pareil Square | DL2 2GH |
| Shorthorn Lane | DL2 2FQ |
| Skerningham Avenue | DL2 2FF |
| Swinbridge | DL2 2GB |
| Teeswater | DL2 2FW |
| Tillage Green | DL2 2GL |
| Timothy Hackworth Drive | DL2 2GN |
| Tower Grange | DL3 0QF |
| West Auckland Road | DL3 0ST DL3 0SU |
| Westerdale Court | DL3 0TE |
| Westerhope Court | DL3 0TD |
| Westgate Crescent | DL3 0SX DL3 0SY |
| Westgate Road | DL3 0SZ |
| Westkirk Close | DL3 0TF |
| Westpark Drive | DL3 0TB |
| Wildair Close | DL2 2FN |
| DL3 0UU |
Transport near Faverdale

- FAQ
- Price Paid By Year
- Property Type Price
Frequently asked questions about Faverdale
What is the average price for a property for sale in Faverdale?
The average price for a property for sale in Faverdale is £178,816. This amount is 9% higher than the average price in Darlington. There are 1,746 property listings for sale in Faverdale.
What streets have the most expensive properties for sale in Faverdale?
The streets with the most expensive properties for sale in Faverdale are Tower Grange at an average of £388,750, Daylesford Grove at an average of £315,000 and Gunnerton Close at an average of £290,000.
What streets have the most affordable properties for sale in Faverdale?
The streets with the most affordable properties for sale in Faverdale are Tillage Green at an average of £90,000, Rainhill Way at an average of £106,625 and Clowbeck Court at an average of £117,666.
Which train stations are available in or near Faverdale?
Some of the train stations available in or near Faverdale are North Road, Darlington and Heighington.
Property Price Paid in Faverdale by Year
The average sold property price by year was:
| Year | Average Sold Price | Price Change |
Sold Properties
|
|---|---|---|---|
| 2026 | £154,750 | -16% |
2 Properties |
| 2025 | £180,150 | -0,2% |
63 Properties |
| 2024 | £180,558 | 2% |
54 Properties |
| 2023 | £176,318 | -12% |
52 Properties |
| 2022 | £197,252 | 10% |
68 Properties |
| 2021 | £176,838 | 1% |
98 Properties |
| 2020 | £174,250 | 4% |
66 Properties |
| 2019 | £166,688 | 11% |
66 Properties |
| 2018 | £148,118 | -14% |
84 Properties |
| 2017 | £168,183 | 1% |
61 Properties |
| 2016 | £166,918 | -5% |
65 Properties |
| 2015 | £175,570 | 5% |
86 Properties |
| 2014 | £166,232 | 1% |
87 Properties |
| 2013 | £164,777 | 6% |
70 Properties |
| 2012 | £154,702 | -1% |
59 Properties |
| 2011 | £155,541 | -3% |
40 Properties |
| 2010 | £159,815 | -6% |
64 Properties |
| 2009 | £169,683 | 12% |
57 Properties |
| 2008 | £149,076 | -17% |
99 Properties |
| 2007 | £175,137 | 4% |
144 Properties |
| 2006 | £167,495 | -2% |
132 Properties |
| 2005 | £171,067 | 4% |
158 Properties |
| 2004 | £163,683 | 30% |
139 Properties |
| 2003 | £114,912 | 24% |
79 Properties |
| 2002 | £87,354 | 11% |
114 Properties |
| 2001 | £77,574 | 7% |
141 Properties |
| 2000 | £72,483 | 10% |
96 Properties |
| 1999 | £65,291 | -5% |
99 Properties |
| 1998 | £68,397 | -2% |
117 Properties |
| 1997 | £70,083 | 13% |
131 Properties |
| 1996 | £61,185 | 7% |
74 Properties |
| 1995 | £56,690 | - |
75 Properties |
Property Price per Property Type in Faverdale
Here you can find historic sold price data in order to help with your property search.
The average Property Paid Price for specific property types in the last three years are:
| Property Type | Average Sold Price | Sold Properties |
|---|---|---|
| Semi Detached House | £171,736.00 | 79 Semi Detached Houses |
| Detached House | £270,241.00 | 31 Detached Houses |
| Terraced House | £174,144.00 | 38 Terraced Houses |
| Flat | £87,630.00 | 23 Flats |