
Houses for sale & to rent in Sadberge And Whessoe, Darlington
House Prices in Sadberge And Whessoe
Properties in Sadberge And Whessoe have an average house price of £263k and had 49 Property Transactions within the last 3 years¹.
Sadberge And Whessoe is an area in Darlington, Darlington with 590 households², where the most expensive property was sold for £684k.
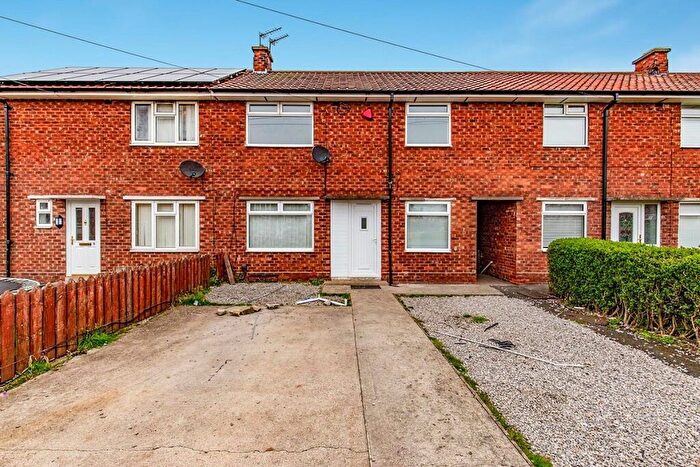
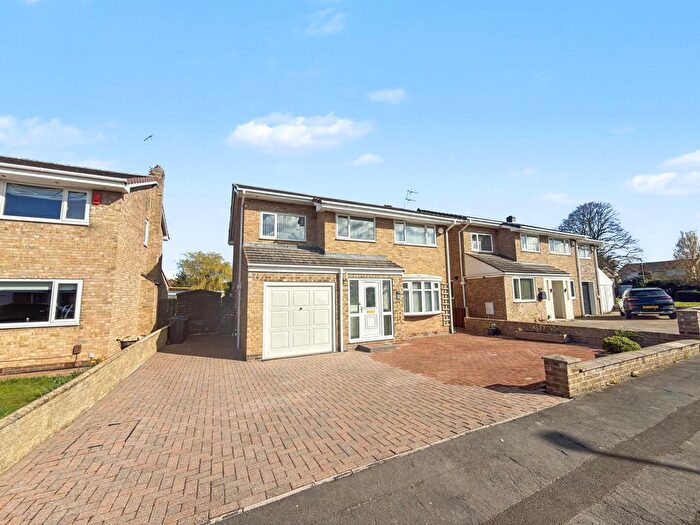
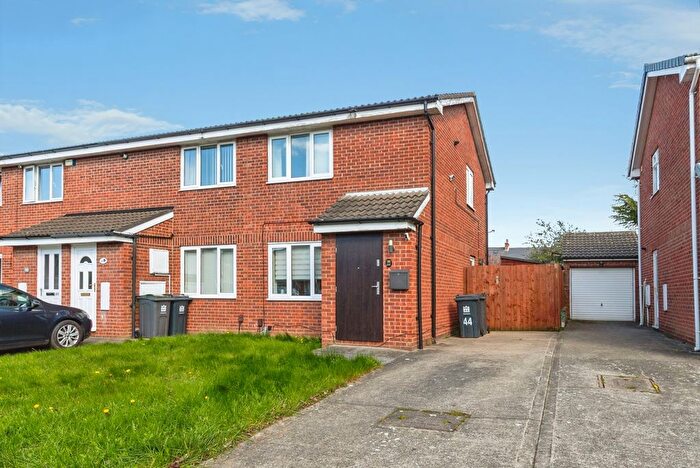
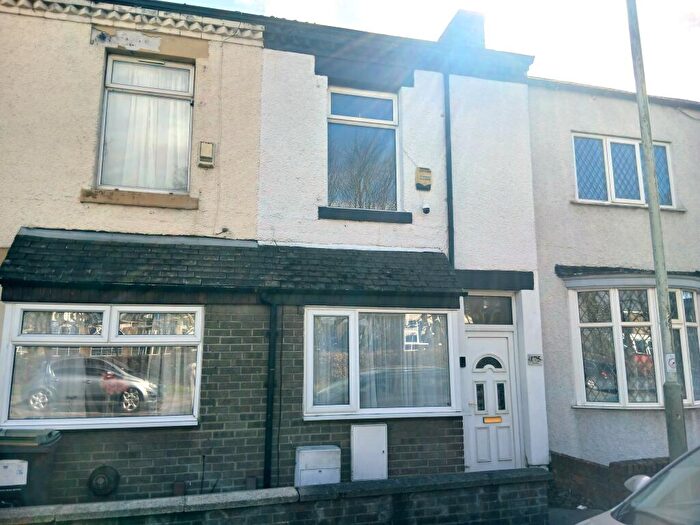
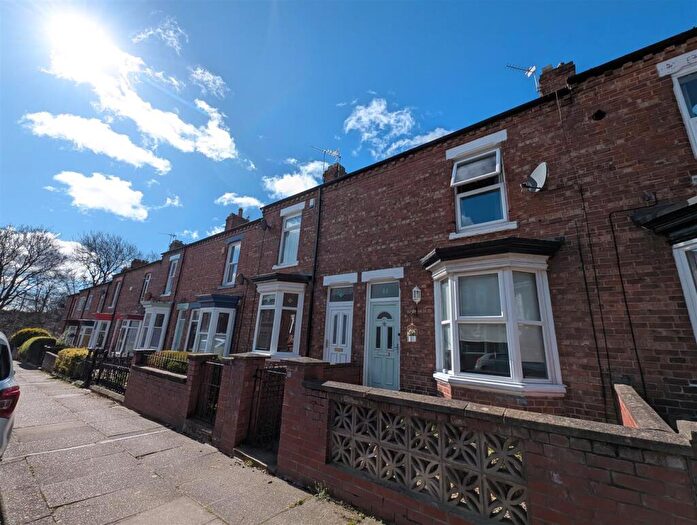
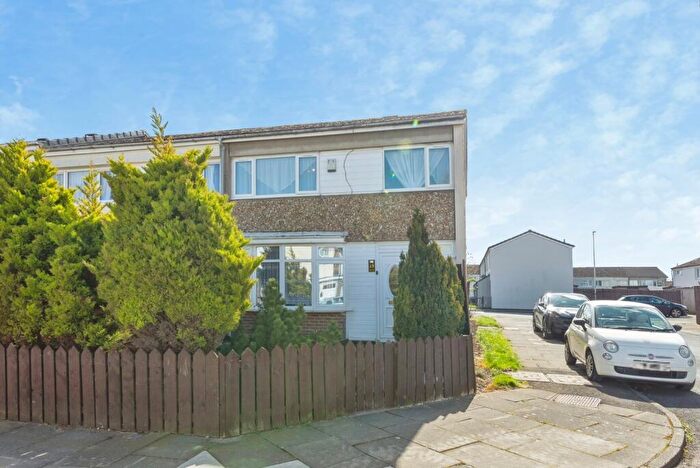
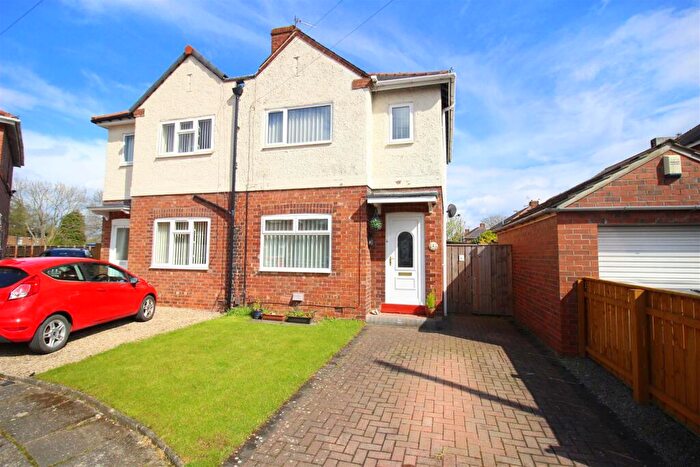
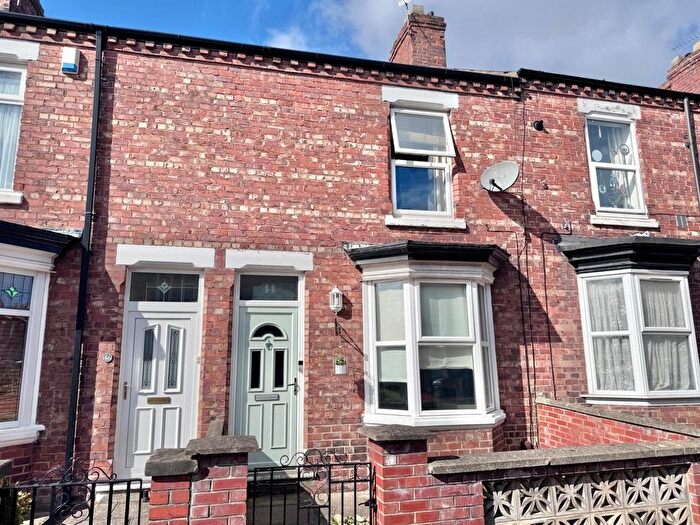
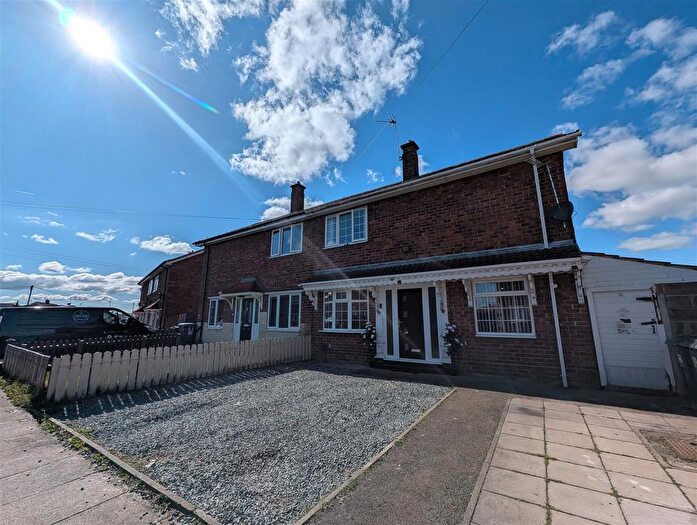
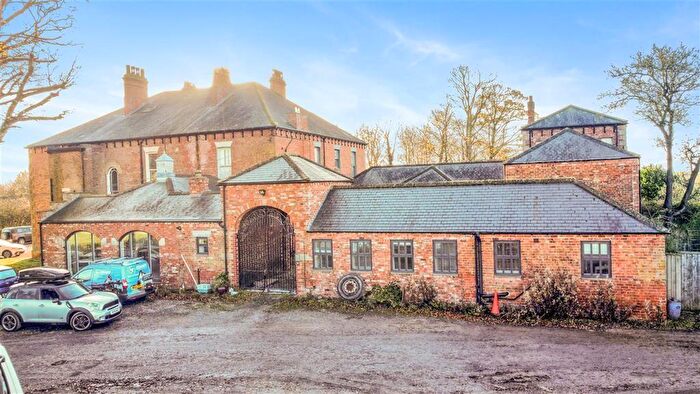
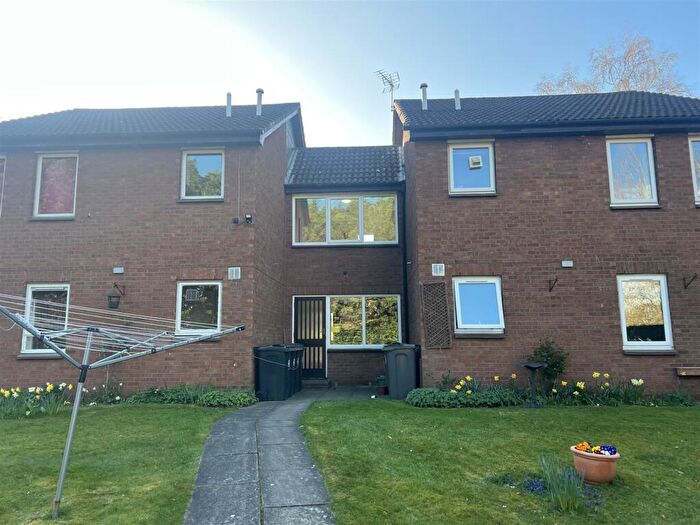
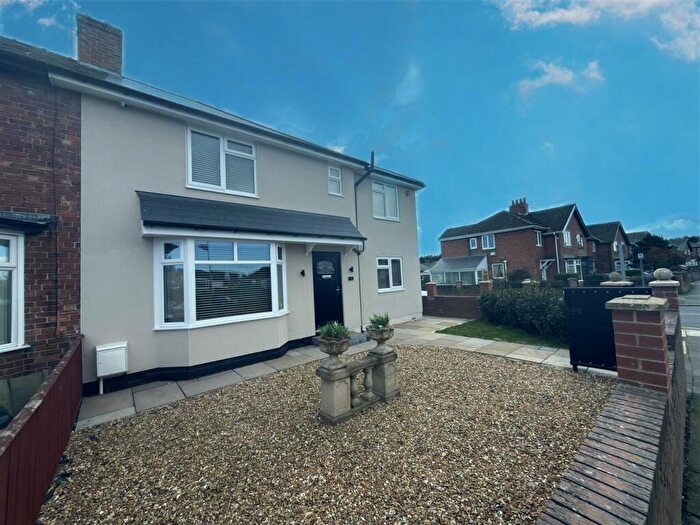
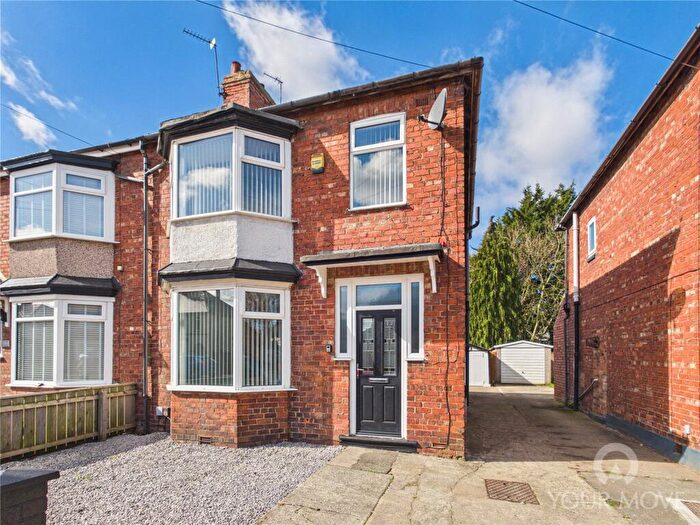
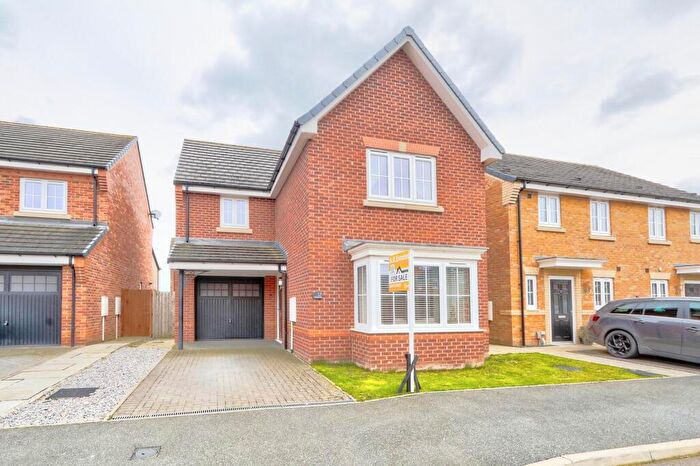
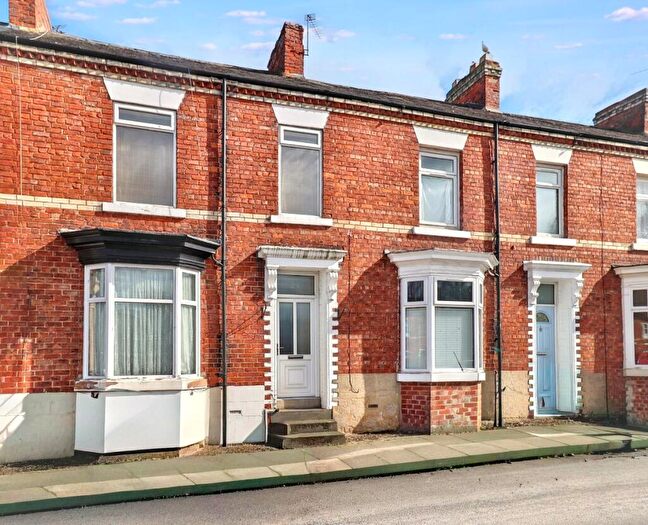
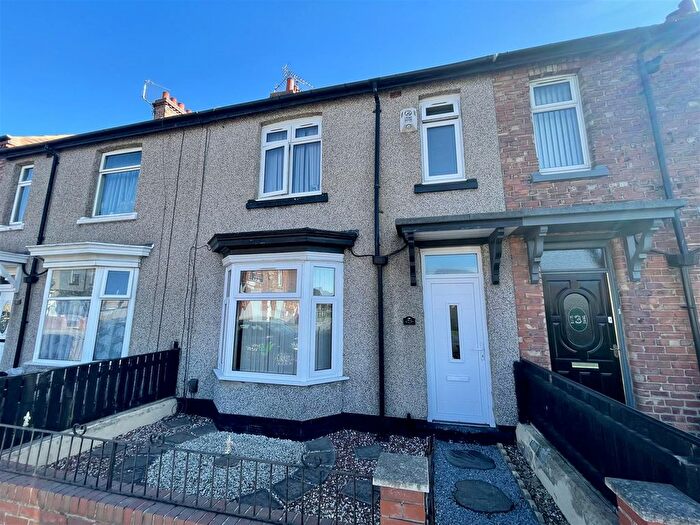
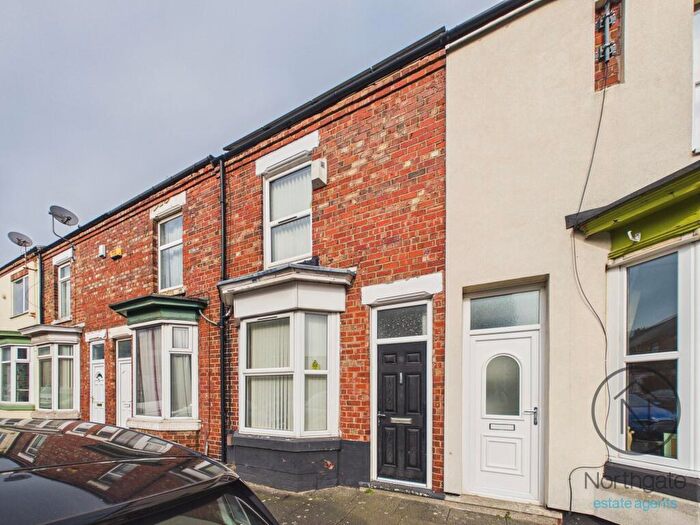
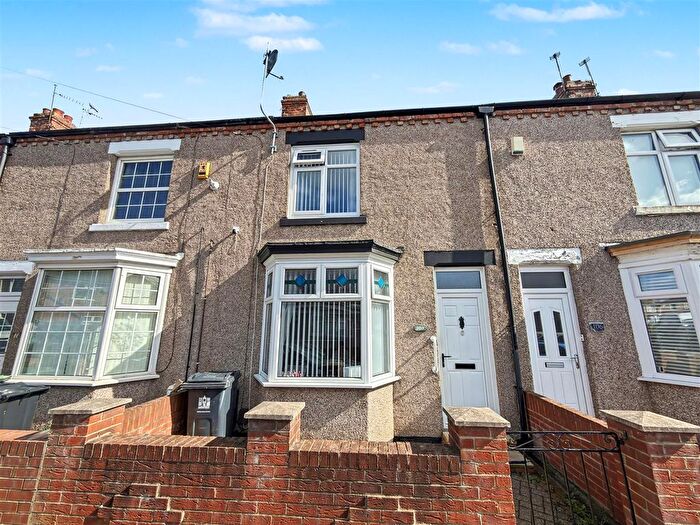
Properties for sale in Sadberge And Whessoe
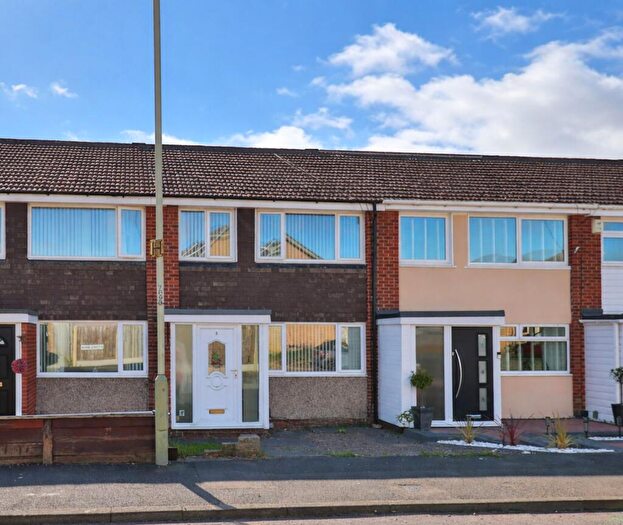
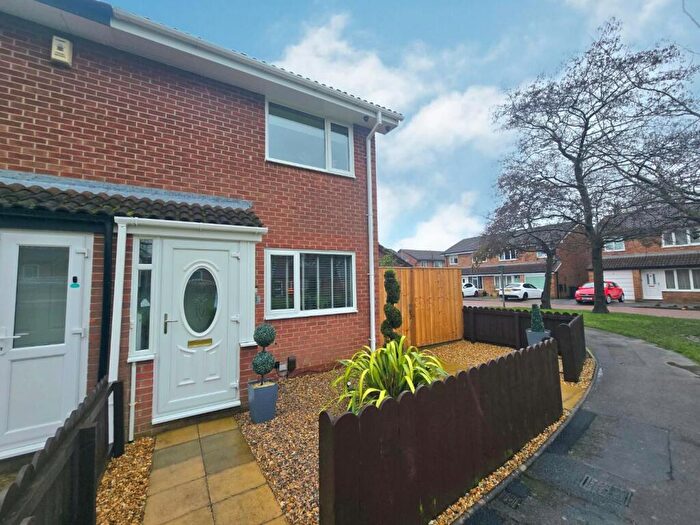
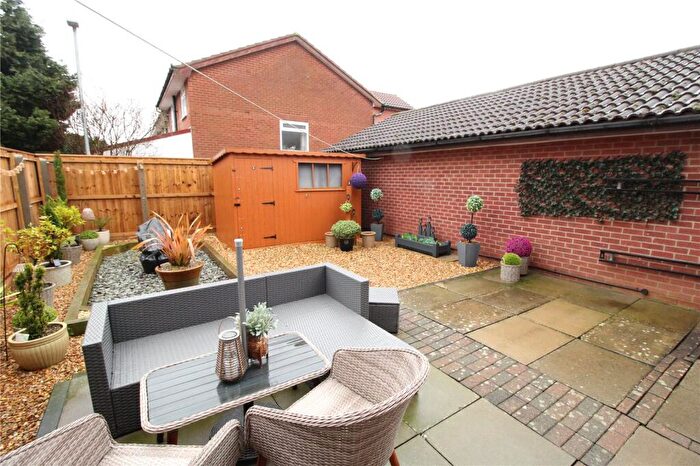
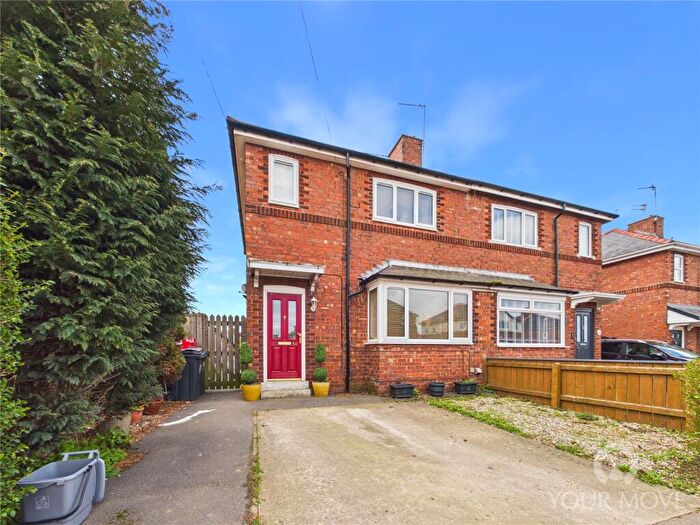
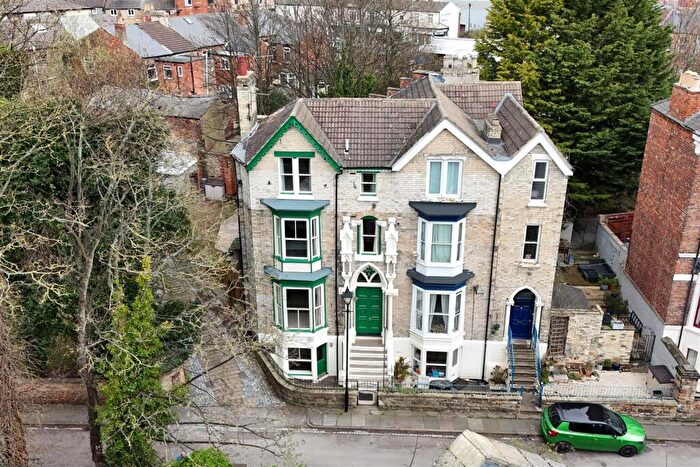
![]()
If you are looking to sell your house, let it out, or receive a property valuation, an expert can help you.
Click the button below to get started.

Roads and Postcodes in Sadberge And Whessoe
Navigate through our locations to find the location of your next house in Sadberge And Whessoe, Darlington for sale or to rent.
| Streets | Postcodes |
|---|---|
| Abbey Road | DL2 1SS |
| Barmpton Lane | DL1 3JF |
| Beacon Grange Park | DL2 1TW |
| Beacon Hill Bungalows | DL1 3JS |
| Beaumont Hill | DL1 3ND DL1 3NG DL1 3NQ |
| Bishopton Lane | DL1 3JR |
| Broadway | DL1 3NA |
| Burtree Lane | DL3 0XD |
| Chapel Row | DL2 1SH |
| Church Lane | DL2 1TF |
| Church View | DL2 1SD |
| Dale Road | DL2 1ST |
| Darlington Road | DL2 1JY DL2 1SA DL2 1SB |
| Durham Road | DL1 3LZ |
| East Close | DL2 1SG |
| East View | DL2 1SF |
| Goodwood Close | DL2 1WA |
| Hartlea Avenue | DL1 3NE |
| Hillhouse Lane | DL2 1SJ DL2 1SL |
| Hillside Terrace | DL2 1RS |
| Laurel Terrace | DL2 1RT |
| Low Skerningham Lane | DL1 3JA |
| Middleton Road | DL2 1RN DL2 1RP DL2 1RR |
| Norton Back Lane | DL2 1SU |
| Norton Crescent | DL2 1SR |
| Norton Road | DL2 1SP DL2 1SW |
| Orient Villas | DL2 1RJ |
| Pleasant View | DL2 1SQ |
| Richmond Cottages | DL2 1RW |
| Riverside Drive | DL1 3JW |
| Sadberge Road | DL2 1RL |
| South View | DL1 3LB DL2 1RX |
| St Andrews Park | DL2 1BF |
| Stockton Road | DL2 1SY DL2 1SZ DL2 1TA |
| The Cottages | DL1 3LX |
| The Green | DL1 3JL DL1 3JQ DL1 3LA |
| The Orchard | DL2 1SE |
| West Row | DL2 1RZ |
| Whiley Hill | DL3 0XN |
| DL1 3JG DL1 3JJ DL1 3LQ DL1 3LS DL1 3LU DL1 3NF DL1 3NJ DL2 1RU DL3 0XL |
Transport near Sadberge And Whessoe

- FAQ
- Price Paid By Year
- Property Type Price
Frequently asked questions about Sadberge And Whessoe
What is the average price for a property for sale in Sadberge And Whessoe?
The average price for a property for sale in Sadberge And Whessoe is £262,586. This amount is 60% higher than the average price in Darlington. There are 3,880 property listings for sale in Sadberge And Whessoe.
What streets have the most expensive properties for sale in Sadberge And Whessoe?
The streets with the most expensive properties for sale in Sadberge And Whessoe are Durham Road at an average of £520,000, South View at an average of £505,000 and Low Skerningham Lane at an average of £471,500.
What streets have the most affordable properties for sale in Sadberge And Whessoe?
The streets with the most affordable properties for sale in Sadberge And Whessoe are Hillside Terrace at an average of £101,000, Norton Road at an average of £110,000 and Middleton Road at an average of £133,000.
Which train stations are available in or near Sadberge And Whessoe?
Some of the train stations available in or near Sadberge And Whessoe are North Road, Dinsdale and Darlington.
Property Price Paid in Sadberge And Whessoe by Year
The average sold property price by year was:
| Year | Average Sold Price | Price Change |
Sold Properties
|
|---|---|---|---|
| 2026 | £302,000 | 24% |
2 Properties |
| 2025 | £230,583 | -32% |
21 Properties |
| 2024 | £304,218 | 16% |
16 Properties |
| 2023 | £255,300 | -1% |
10 Properties |
| 2022 | £257,929 | 1% |
29 Properties |
| 2021 | £254,318 | 21% |
25 Properties |
| 2020 | £202,104 | -8% |
21 Properties |
| 2019 | £217,404 | 1% |
22 Properties |
| 2018 | £215,312 | 7% |
24 Properties |
| 2017 | £199,363 | -13% |
22 Properties |
| 2016 | £225,585 | 5% |
17 Properties |
| 2015 | £213,435 | 17% |
14 Properties |
| 2014 | £177,792 | -19% |
20 Properties |
| 2013 | £211,670 | 1% |
20 Properties |
| 2012 | £208,772 | 22% |
11 Properties |
| 2011 | £163,569 | -45% |
28 Properties |
| 2010 | £237,358 | 0,2% |
18 Properties |
| 2009 | £236,861 | 6% |
18 Properties |
| 2008 | £222,096 | -4% |
13 Properties |
| 2007 | £231,690 | 3% |
26 Properties |
| 2006 | £223,960 | -16% |
28 Properties |
| 2005 | £260,211 | 29% |
21 Properties |
| 2004 | £183,457 | 1% |
26 Properties |
| 2003 | £181,425 | 29% |
26 Properties |
| 2002 | £128,991 | 26% |
37 Properties |
| 2001 | £95,604 | -10% |
36 Properties |
| 2000 | £105,347 | 21% |
18 Properties |
| 1999 | £82,730 | -11% |
29 Properties |
| 1998 | £91,739 | 0,1% |
24 Properties |
| 1997 | £91,672 | 41% |
26 Properties |
| 1996 | £53,895 | -37% |
11 Properties |
| 1995 | £73,884 | - |
13 Properties |
Property Price per Property Type in Sadberge And Whessoe
Here you can find historic sold price data in order to help with your property search.
The average Property Paid Price for specific property types in the last three years are:
| Property Type | Average Sold Price | Sold Properties |
|---|---|---|
| Semi Detached House | £220,625.00 | 12 Semi Detached Houses |
| Detached House | £364,712.00 | 20 Detached Houses |
| Terraced House | £183,214.00 | 14 Terraced Houses |
| Flat | £120,000.00 | 3 Flats |