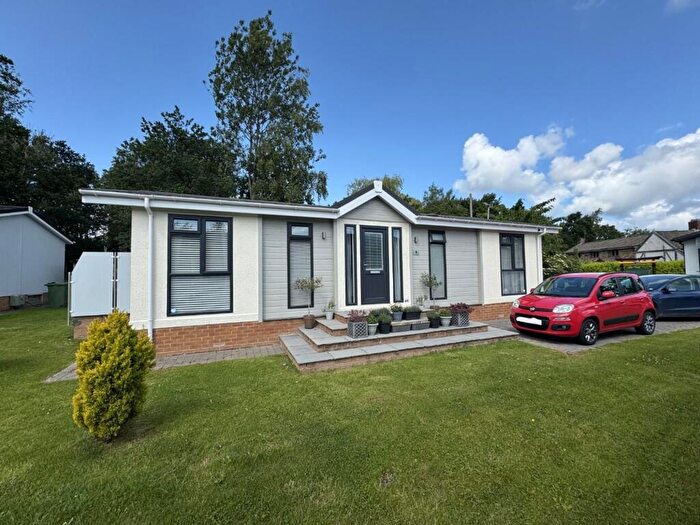
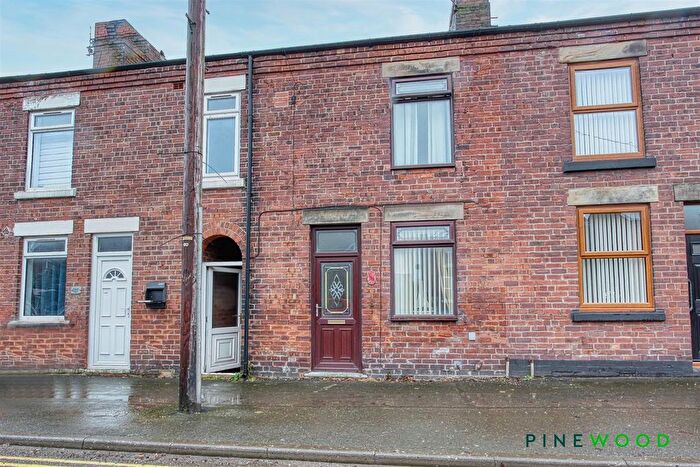
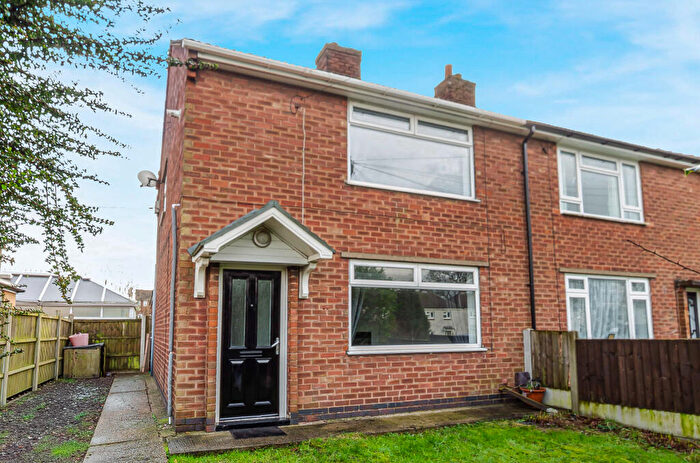
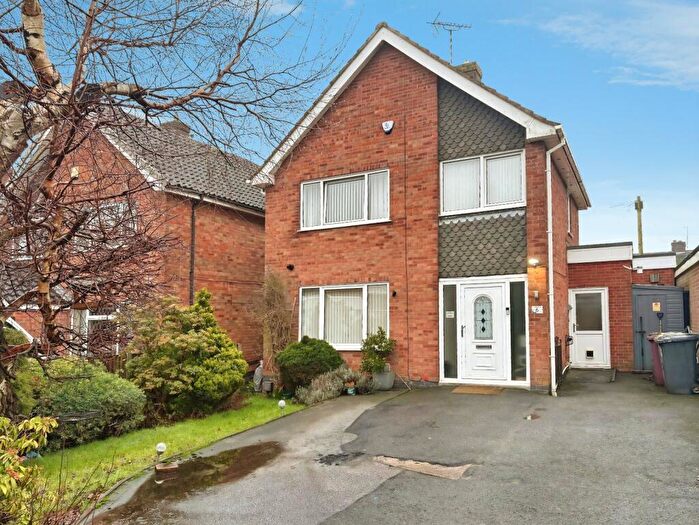
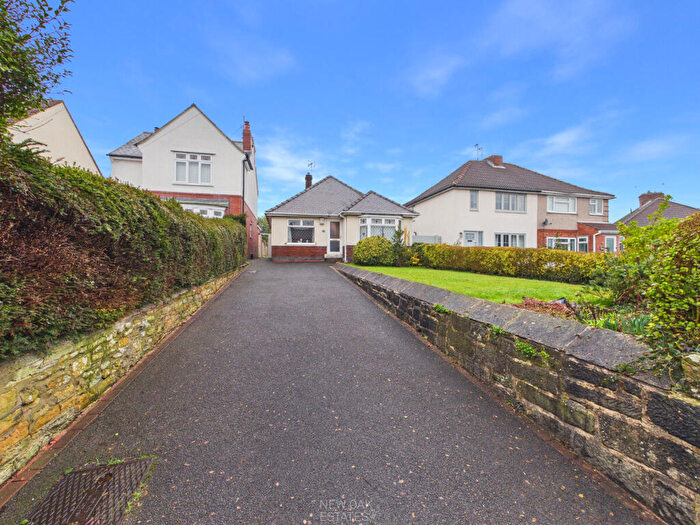
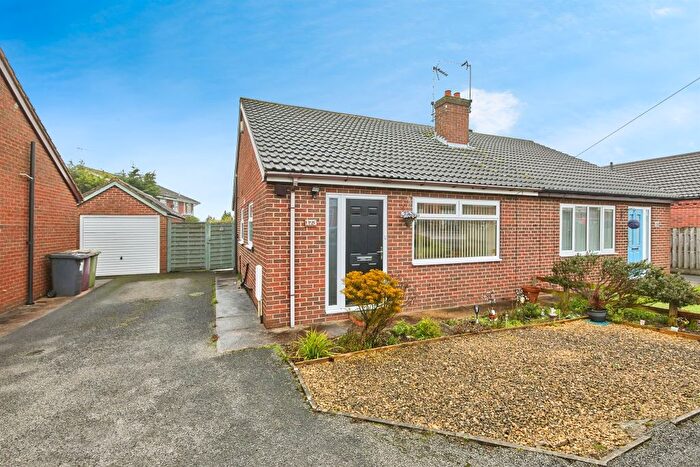
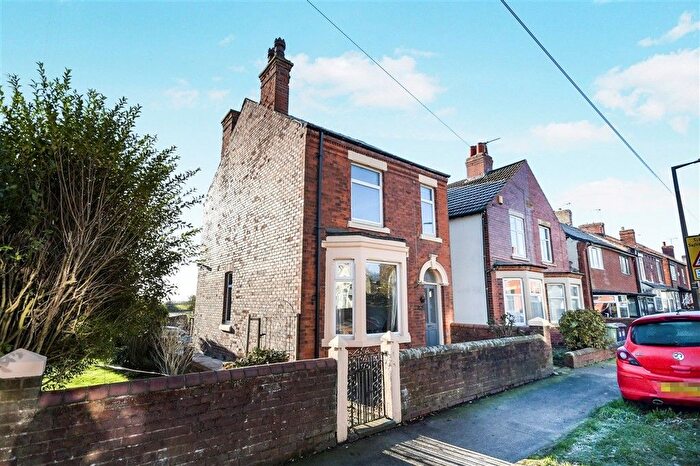
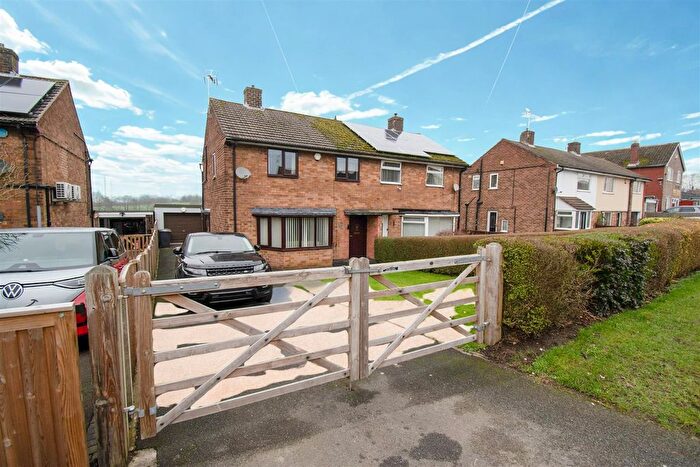
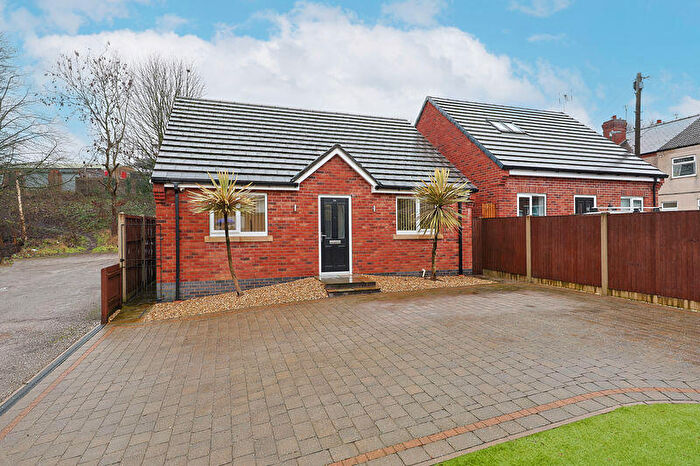
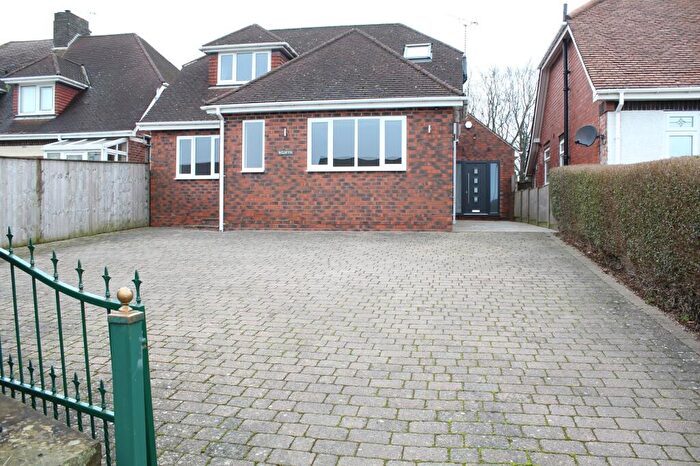
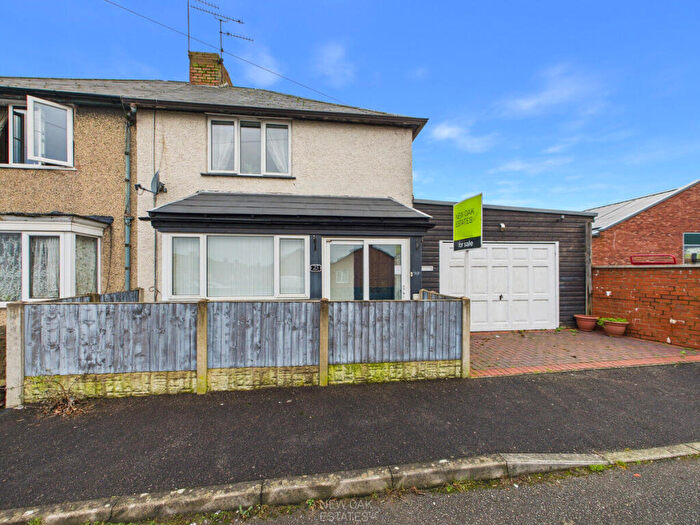
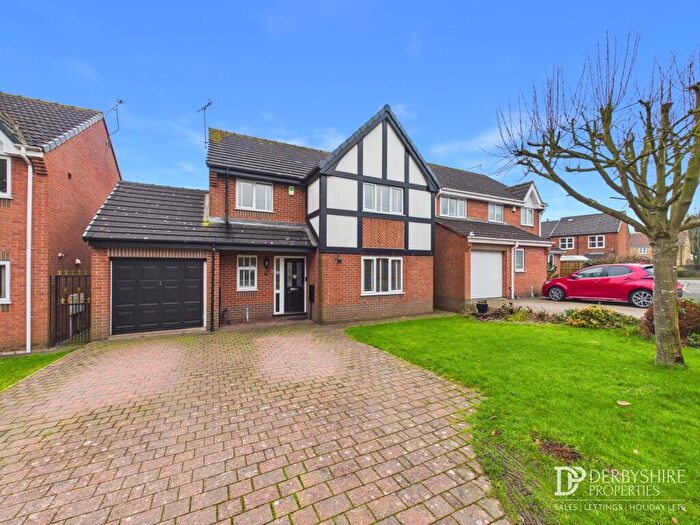
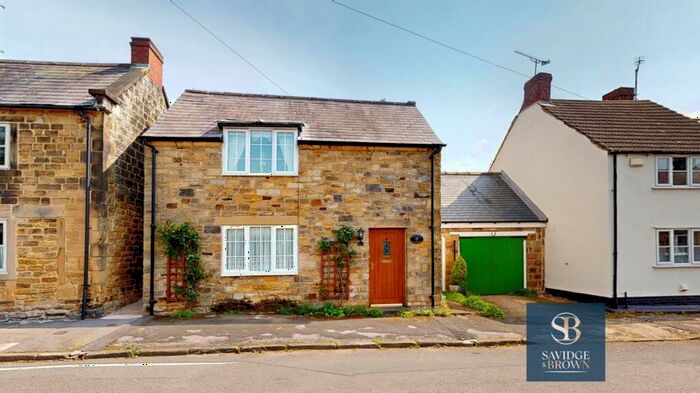
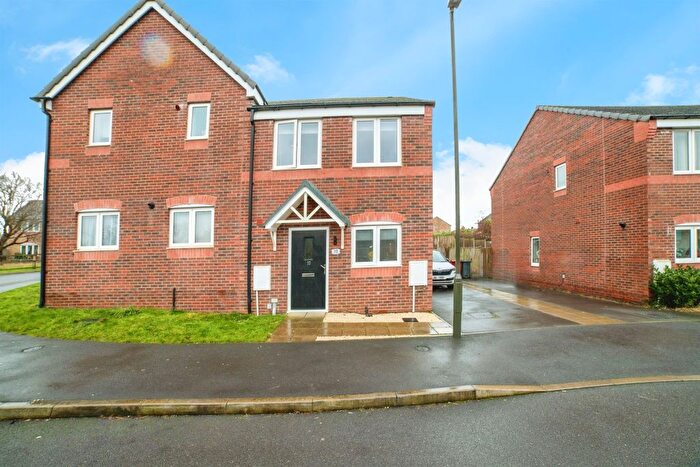
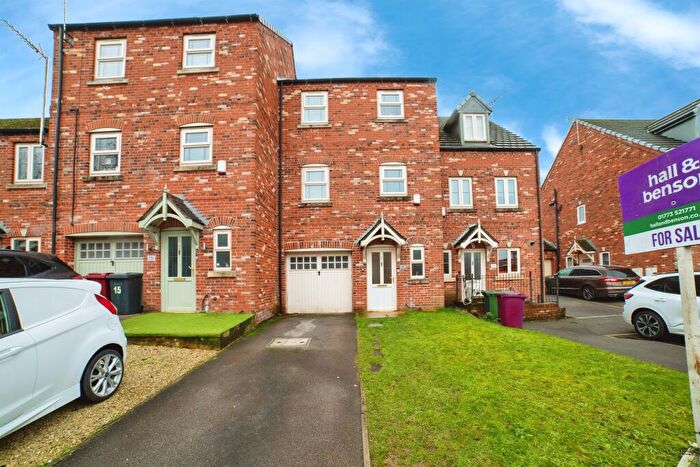
Houses for sale & to rent in Pilsley And Morton, Alfreton
House Prices in Pilsley And Morton
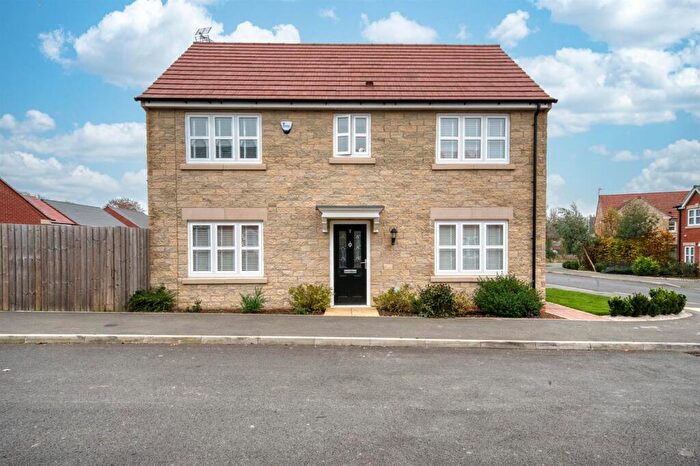
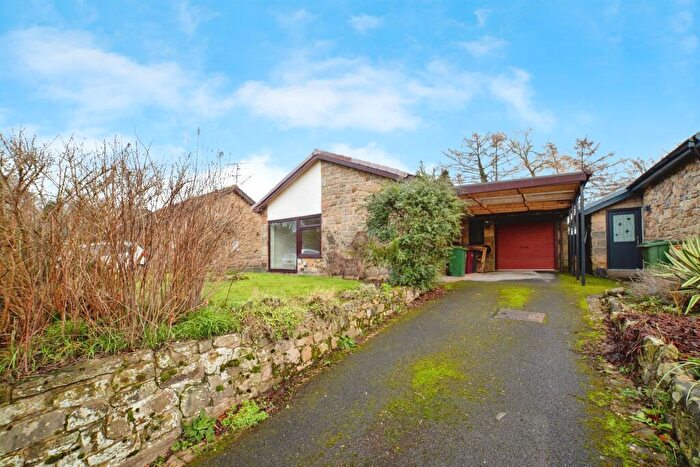
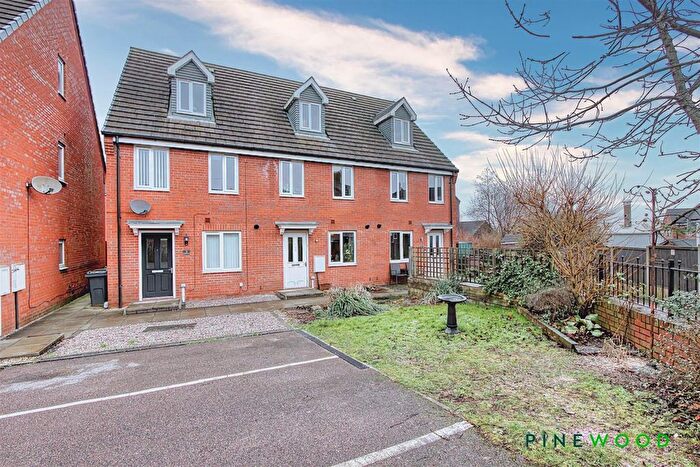
Properties in Pilsley And Morton have an average house price of £272,806.00 and had 67 Property Transactions within the last 3 years¹.
Pilsley And Morton is an area in Alfreton, Derbyshire with 697 households², where the most expensive property was sold for £900,000.00.
Properties for sale in Pilsley And Morton
Roads and Postcodes in Pilsley And Morton
Navigate through our locations to find the location of your next house in Pilsley And Morton, Alfreton for sale or to rent.
| Streets | Postcodes |
|---|---|
| Ashover Road | DE55 6FF |
| Bacchus Way | DE55 6HR |
| Back Lane | DE55 6GT |
| Badger Lane | DE55 6FG |
| Beresford Lane | DE55 6FH |
| Church Lane | DE55 6GU |
| Evershill Close | DE55 6GZ |
| Evershill Lane | DE55 6HA |
| Highstairs Lane | DE55 6FD |
| Holland Close | DE55 6HE |
| Main Road | DE55 6EW DE55 6FB DE55 6GS DE55 6HH DE55 6HL |
| New Street | DE55 6GR |
| Ogston | DE55 6EL |
| Penfold Way | DE55 6HS |
| Pilsley Road | DE55 6HP |
| Pit Lane | DE55 6HJ |
| Sitwell Villas | DE55 6GX |
| Smiths Lane | DE55 6EU |
| Smithymoor | DE55 6FE |
| Station Road | DE55 6HN |
| Straw Lane | DE55 6EX |
| Stretton Road | DE55 6GW |
| Temperance Hill | DE55 6FJ |
| Westwood Gardens | DE55 6HT |
| DE55 6FL |
Transport near Pilsley And Morton
-
Alfreton Station
-
Whatstandwell Station
-
Cromford Station
-
Matlock Station
-
Matlock Bath Station
-
Ambergate Station
-
Chesterfield Station
-
Sutton Parkway Station
-
Kirkby in Ashfield Station
-
Mansfield Woodhouse Station
- FAQ
- Price Paid By Year
- Property Type Price
Frequently asked questions about Pilsley And Morton
What is the average price for a property for sale in Pilsley And Morton?
The average price for a property for sale in Pilsley And Morton is £272,806. This amount is 36% higher than the average price in Alfreton. There are 1,258 property listings for sale in Pilsley And Morton.
What streets have the most expensive properties for sale in Pilsley And Morton?
The streets with the most expensive properties for sale in Pilsley And Morton are Highstairs Lane at an average of £578,737, Temperance Hill at an average of £429,000 and Evershill Lane at an average of £375,000.
What streets have the most affordable properties for sale in Pilsley And Morton?
The streets with the most affordable properties for sale in Pilsley And Morton are New Street at an average of £106,178, Evershill Close at an average of £156,250 and Pilsley Road at an average of £190,000.
Which train stations are available in or near Pilsley And Morton?
Some of the train stations available in or near Pilsley And Morton are Alfreton, Whatstandwell and Cromford.
Property Price Paid in Pilsley And Morton by Year
The average sold property price by year was:
| Year | Average Sold Price | Price Change |
Sold Properties
|
|---|---|---|---|
| 2025 | £212,676 | -32% |
17 Properties |
| 2024 | £281,110 | -7% |
20 Properties |
| 2023 | £301,345 | 27% |
30 Properties |
| 2022 | £218,830 | -5% |
18 Properties |
| 2021 | £229,193 | 17% |
31 Properties |
| 2020 | £189,590 | -21% |
16 Properties |
| 2019 | £229,440 | 22% |
23 Properties |
| 2018 | £179,998 | 6% |
26 Properties |
| 2017 | £168,724 | -49% |
20 Properties |
| 2016 | £251,255 | 31% |
18 Properties |
| 2015 | £172,212 | 5% |
20 Properties |
| 2014 | £164,134 | 1% |
42 Properties |
| 2013 | £162,636 | -9% |
15 Properties |
| 2012 | £177,837 | 29% |
20 Properties |
| 2011 | £125,971 | -30% |
14 Properties |
| 2010 | £164,147 | 4% |
17 Properties |
| 2009 | £157,423 | -34% |
13 Properties |
| 2008 | £210,810 | 24% |
24 Properties |
| 2007 | £160,529 | -4% |
30 Properties |
| 2006 | £167,533 | 13% |
40 Properties |
| 2005 | £145,437 | -3% |
32 Properties |
| 2004 | £149,446 | 26% |
29 Properties |
| 2003 | £111,074 | 25% |
34 Properties |
| 2002 | £82,837 | 18% |
44 Properties |
| 2001 | £67,561 | 20% |
29 Properties |
| 2000 | £54,027 | 18% |
22 Properties |
| 1999 | £44,540 | -26% |
27 Properties |
| 1998 | £56,341 | -25% |
24 Properties |
| 1997 | £70,677 | 25% |
26 Properties |
| 1996 | £52,800 | 16% |
21 Properties |
| 1995 | £44,591 | - |
30 Properties |
Property Price per Property Type in Pilsley And Morton
Here you can find historic sold price data in order to help with your property search.
The average Property Paid Price for specific property types in the last three years are:
| Property Type | Average Sold Price | Sold Properties |
|---|---|---|
| Semi Detached House | £215,537.00 | 24 Semi Detached Houses |
| Terraced House | £124,057.00 | 13 Terraced Houses |
| Detached House | £383,080.00 | 30 Detached Houses |

