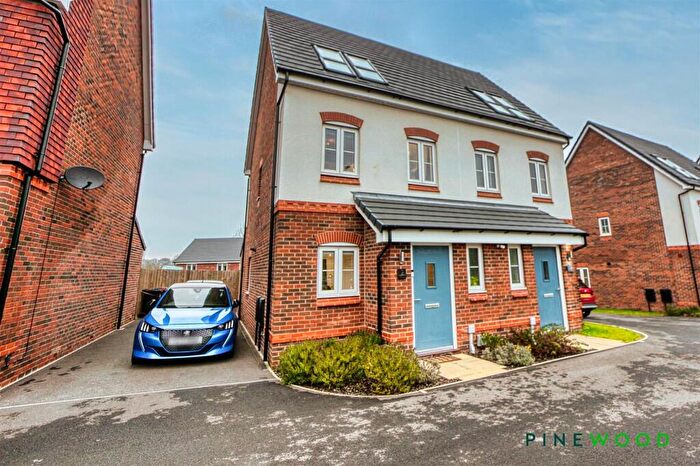
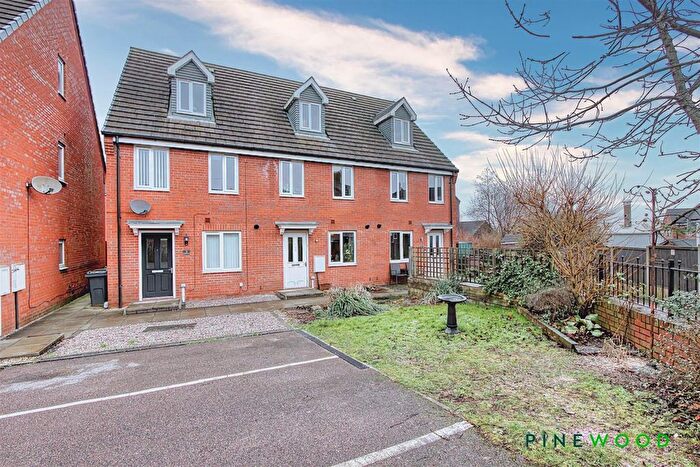
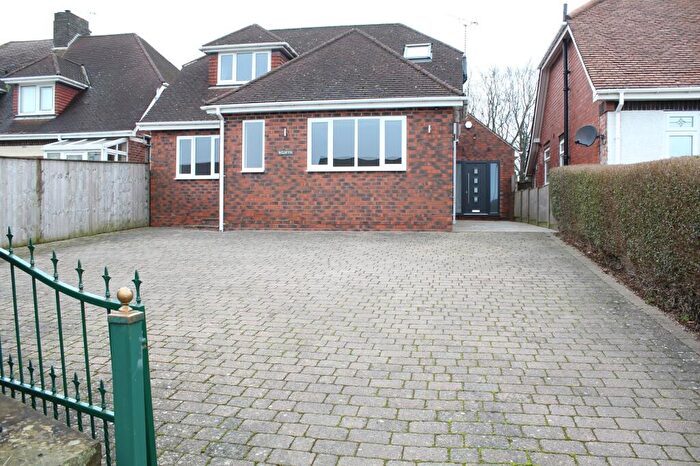
Houses for sale & to rent in Clay Cross South, Chesterfield
House Prices in Clay Cross South
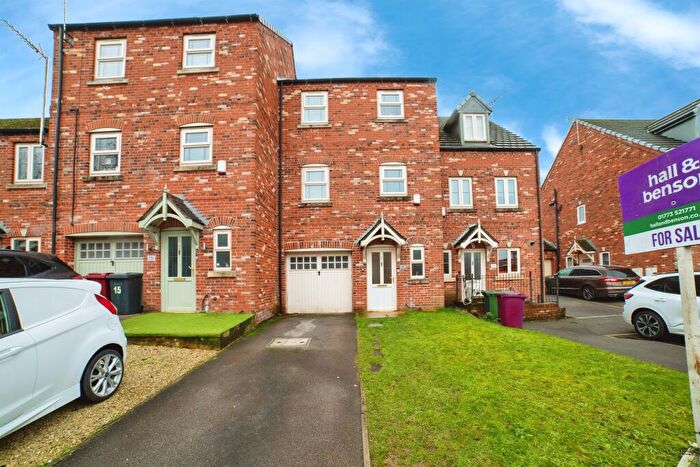
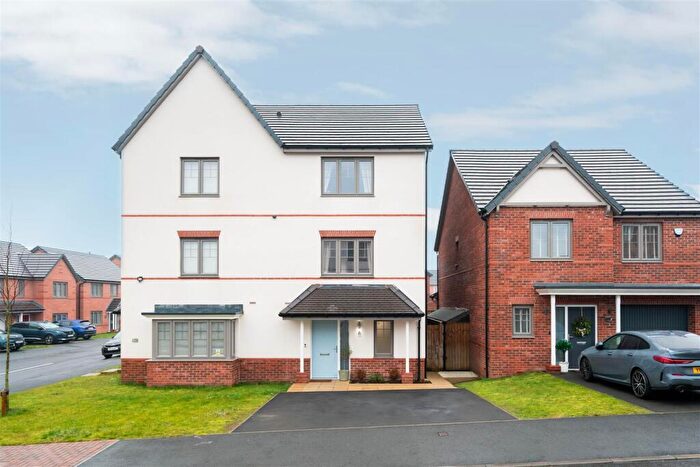
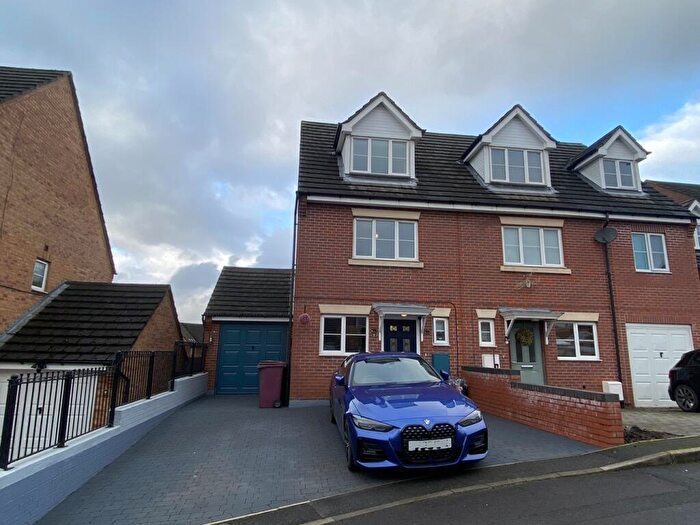
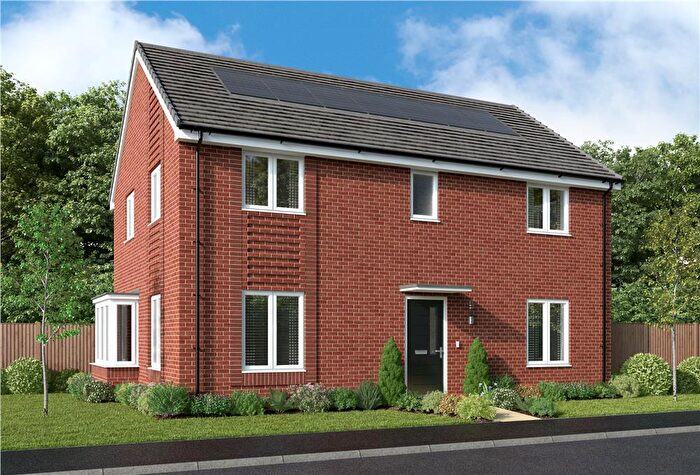
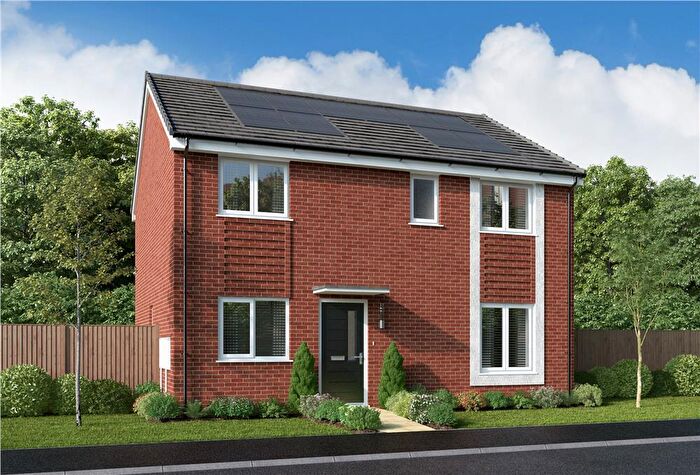
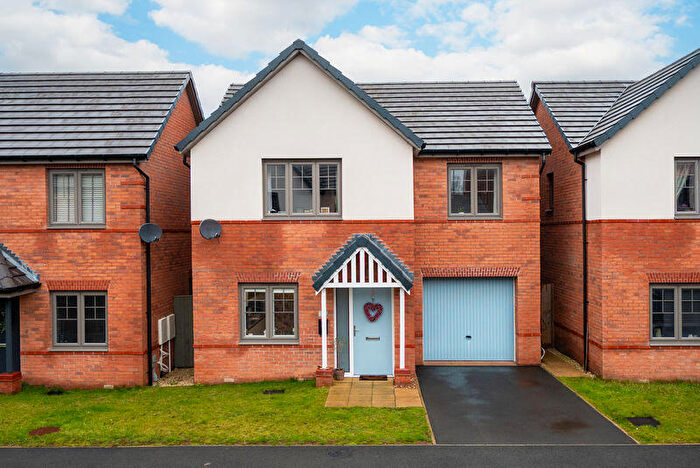
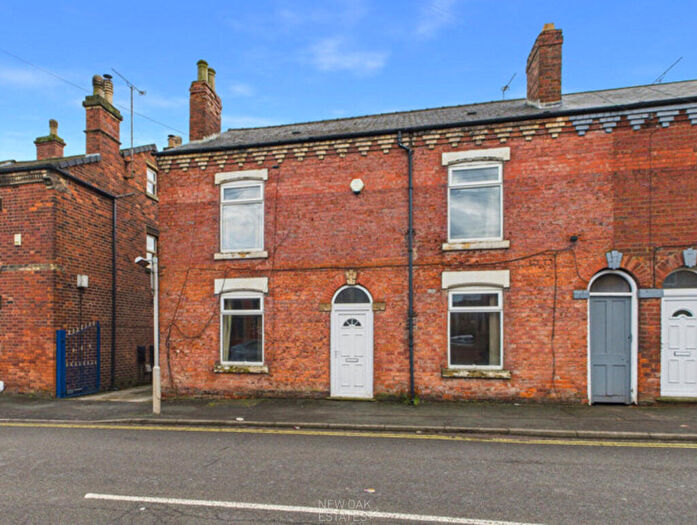
Properties in Clay Cross South have an average house price of £171,074.00 and had 125 Property Transactions within the last 3 years¹.
Clay Cross South is an area in Chesterfield, Derbyshire with 1,716 households², where the most expensive property was sold for £550,000.00.
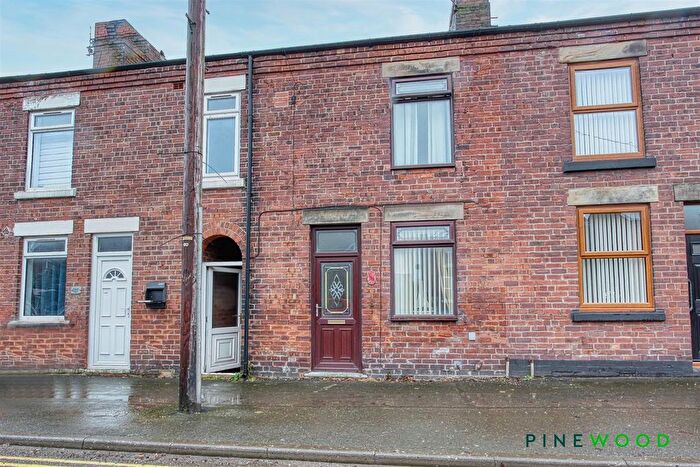
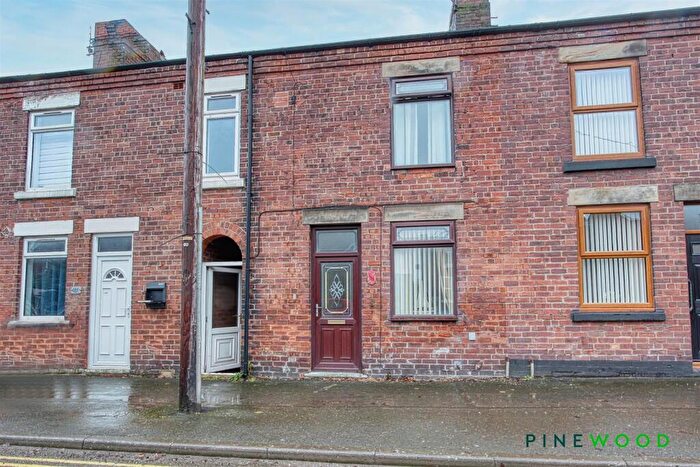
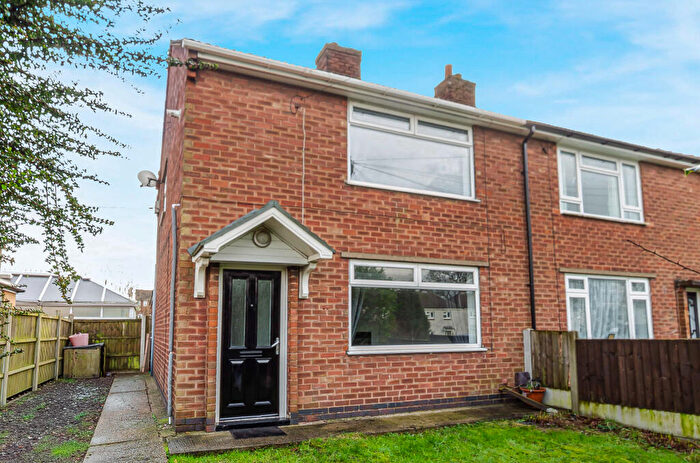
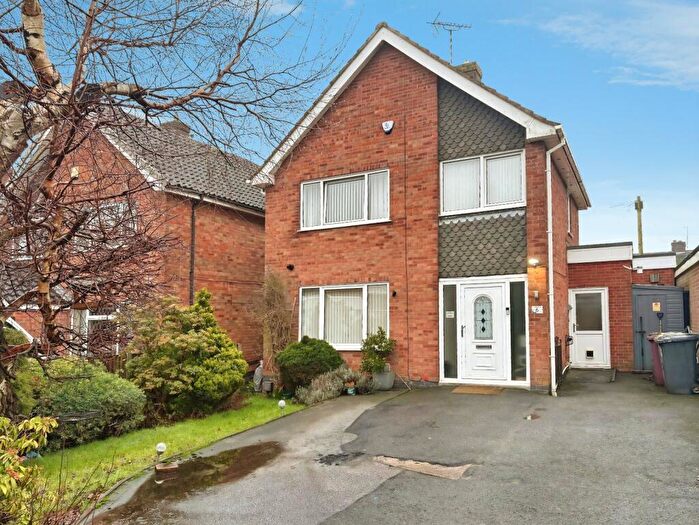
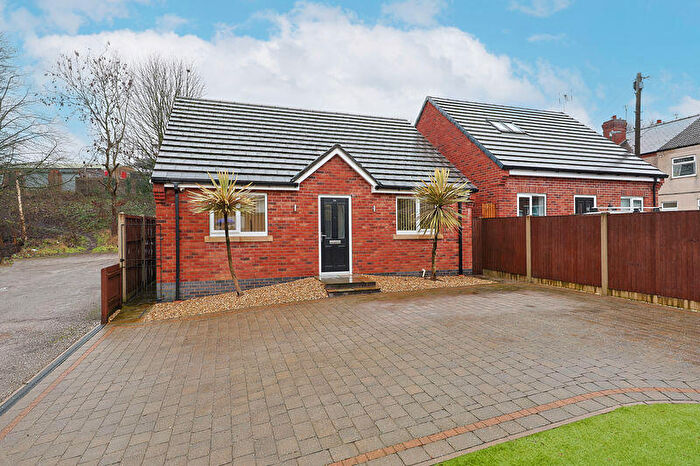
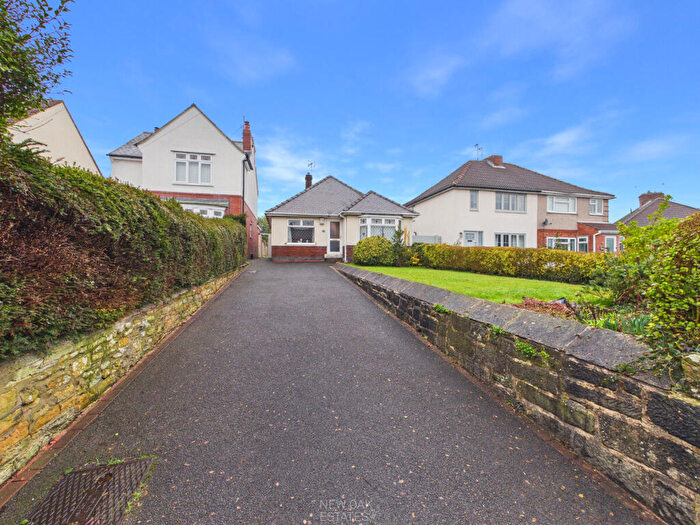
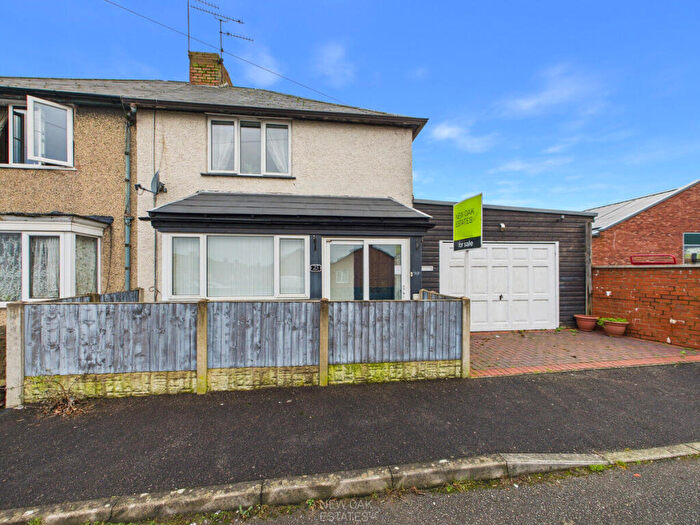
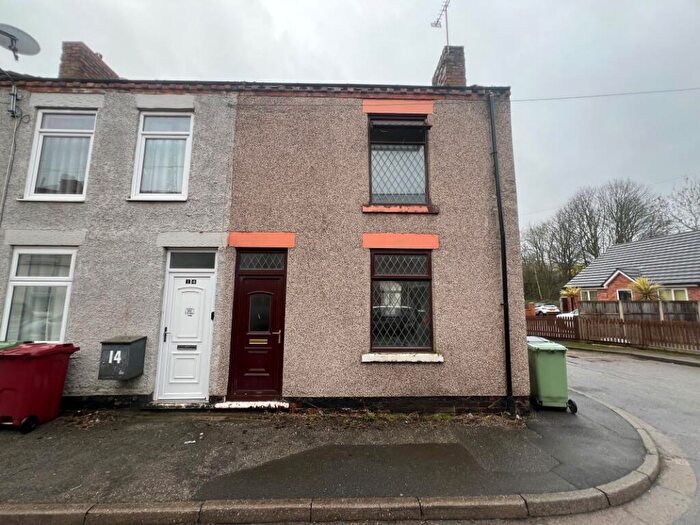
Properties for sale in Clay Cross South
Roads and Postcodes in Clay Cross South
Navigate through our locations to find the location of your next house in Clay Cross South, Chesterfield for sale or to rent.
| Streets | Postcodes |
|---|---|
| Appian Way | S45 9BD |
| Back Croft | S45 9SZ |
| Beech Way | S45 9SQ |
| Bennison Gardens | S45 9HR |
| Beresford Close | S45 9TB |
| Bevan Road | S45 9RT |
| Biggin Close | S45 9TF |
| Birch Rise | S45 9DR |
| Brackendale Avenue | S45 9SR |
| Bradwell Grove | S45 9TA |
| Brockway Close | S45 9RX |
| Carlton Close | S45 9RP |
| Cavell Drive | S45 9SD |
| Cemetery Road | S45 9DA S45 9RL S45 9RN S45 9RS S45 9RZ S45 9SF S45 9DD S45 9SJ |
| Clay Fields View | S45 9FT |
| Clay Lane | S45 9AW S45 9EN S45 9EW |
| Commonpiece Road | S45 9HF |
| Coniston Drive | S45 9ET |
| Cowsell Drive | S45 9SX |
| Denham Street | S45 9GY S45 9HQ |
| Dunvegan Avenue | S45 9SP |
| Flaxpiece Road | S45 9HB S45 9HD |
| Garrett Green | S45 9DJ S45 9DL |
| Gentshill | S45 9SW |
| Grasmere Avenue | S45 9ES |
| Harport Drive | S45 9SS |
| High Street | S45 9EL |
| Kenmere Close | S45 9RW |
| Lathkill Grove | S45 9TE |
| Lime Tree Grove | S45 9SH |
| Linacre Avenue | S45 9SU |
| Linden Avenue | S45 9HE |
| Linden Court | S45 9HU |
| Middle Lane | S45 9DH |
| Mill Lane | S45 9AN |
| Nethercroft Lane | S45 9DE |
| Nightingale Close | S45 9SE |
| Oakdale Close | S45 9RY |
| Park House Court | S45 9FH |
| Penistone Gardens | S45 9ST |
| Penncroft Drive | S45 9SL S45 9SN |
| Penncroft Lane | S45 9DN S45 9HN S45 9HP S45 9DF |
| Pilsley Road | S45 9BN S45 9BU S45 9BX S45 9BY |
| Pine View | S45 9DB |
| Princess Place | S45 9EJ |
| Queen Street | S45 9EQ |
| Rydal Way | S45 9ER |
| Rye Court | S45 9HL |
| Rye Crescent | S45 9HH S45 9HJ |
| Rykneld Court | S45 9HT |
| Slater Street | S45 9HG |
| Springvale Close | S45 9SA |
| Springvale Gardens | S45 9FY |
| Springvale Road | S45 9SB |
| Stoneholes Drive | S45 9SY |
| Stretton Road | S45 9AJ S45 9AQ |
| Thanet Street | S45 9JS S45 9JT S45 9JU |
| The Crescent | S45 9EH |
| The Fairways | S45 9BG |
| The Square | S45 9BZ |
| Upper Croft | S45 9DQ |
| Vicarage Gardens | S45 9BB |
| Viola Villas | S45 9AL |
| Watercress Lane | S45 9RR |
| Wheatcroft Close | S45 9HW |
| Wilson Close | S45 9RU |
| Windermere Road | S45 9EP |
| Wolfscote Close | S45 9TD |
Transport near Clay Cross South
-
Alfreton Station
-
Chesterfield Station
-
Matlock Station
-
Whatstandwell Station
-
Matlock Bath Station
-
Cromford Station
-
Sutton Parkway Station
-
Ambergate Station
-
Kirkby in Ashfield Station
-
Mansfield Woodhouse Station
- FAQ
- Price Paid By Year
- Property Type Price
Frequently asked questions about Clay Cross South
What is the average price for a property for sale in Clay Cross South?
The average price for a property for sale in Clay Cross South is £171,074. This amount is 20% lower than the average price in Chesterfield. There are 637 property listings for sale in Clay Cross South.
What streets have the most expensive properties for sale in Clay Cross South?
The streets with the most expensive properties for sale in Clay Cross South are Vicarage Gardens at an average of £450,000, Stretton Road at an average of £423,333 and Biggin Close at an average of £325,000.
What streets have the most affordable properties for sale in Clay Cross South?
The streets with the most affordable properties for sale in Clay Cross South are Slater Street at an average of £97,800, Flaxpiece Road at an average of £103,307 and The Square at an average of £120,000.
Which train stations are available in or near Clay Cross South?
Some of the train stations available in or near Clay Cross South are Alfreton, Chesterfield and Matlock.
Property Price Paid in Clay Cross South by Year
The average sold property price by year was:
| Year | Average Sold Price | Price Change |
Sold Properties
|
|---|---|---|---|
| 2025 | £181,111 | -5% |
38 Properties |
| 2024 | £190,272 | 20% |
33 Properties |
| 2023 | £152,278 | -18% |
54 Properties |
| 2022 | £180,348 | 4% |
43 Properties |
| 2021 | £173,970 | 3% |
75 Properties |
| 2020 | £169,303 | 19% |
41 Properties |
| 2019 | £136,945 | 4% |
64 Properties |
| 2018 | £131,890 | 3% |
61 Properties |
| 2017 | £127,475 | -7% |
42 Properties |
| 2016 | £136,341 | 11% |
41 Properties |
| 2015 | £120,774 | -6% |
38 Properties |
| 2014 | £128,206 | 24% |
44 Properties |
| 2013 | £97,737 | -16% |
39 Properties |
| 2012 | £113,581 | -23% |
24 Properties |
| 2011 | £139,799 | 30% |
32 Properties |
| 2010 | £97,731 | -23% |
31 Properties |
| 2009 | £120,062 | 18% |
28 Properties |
| 2008 | £98,670 | -23% |
43 Properties |
| 2007 | £121,488 | 13% |
85 Properties |
| 2006 | £106,226 | 3% |
48 Properties |
| 2005 | £102,665 | 8% |
39 Properties |
| 2004 | £94,565 | 25% |
49 Properties |
| 2003 | £70,480 | 12% |
43 Properties |
| 2002 | £61,986 | 21% |
62 Properties |
| 2001 | £49,066 | -5% |
63 Properties |
| 2000 | £51,476 | -17% |
61 Properties |
| 1999 | £60,016 | 32% |
47 Properties |
| 1998 | £40,857 | -3% |
35 Properties |
| 1997 | £42,233 | 17% |
49 Properties |
| 1996 | £34,998 | -17% |
32 Properties |
| 1995 | £40,863 | - |
29 Properties |
Property Price per Property Type in Clay Cross South
Here you can find historic sold price data in order to help with your property search.
The average Property Paid Price for specific property types in the last three years are:
| Property Type | Average Sold Price | Sold Properties |
|---|---|---|
| Semi Detached House | £166,390.00 | 46 Semi Detached Houses |
| Detached House | £269,921.00 | 32 Detached Houses |
| Terraced House | £108,357.00 | 47 Terraced Houses |

