
Houses for sale & to rent in Pilsley And Morton, Chesterfield
House Prices in Pilsley And Morton
Properties in Pilsley And Morton have an average house price of £183k and had 137 Property Transactions within the last 3 years¹.
Pilsley And Morton is an area in Chesterfield, Derbyshire with 1,483 households², where the most expensive property was sold for £561k.
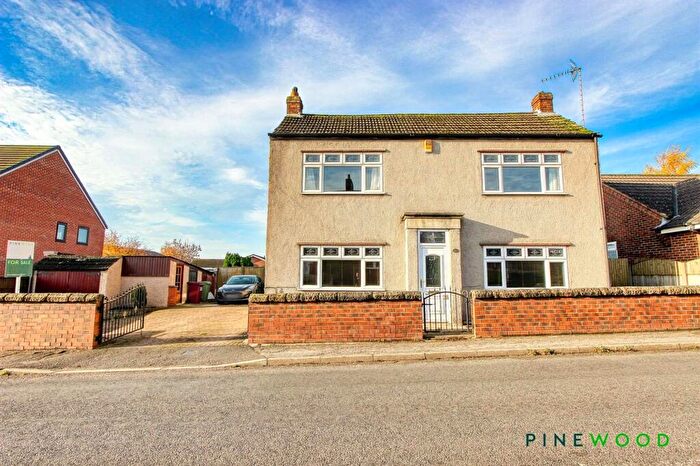
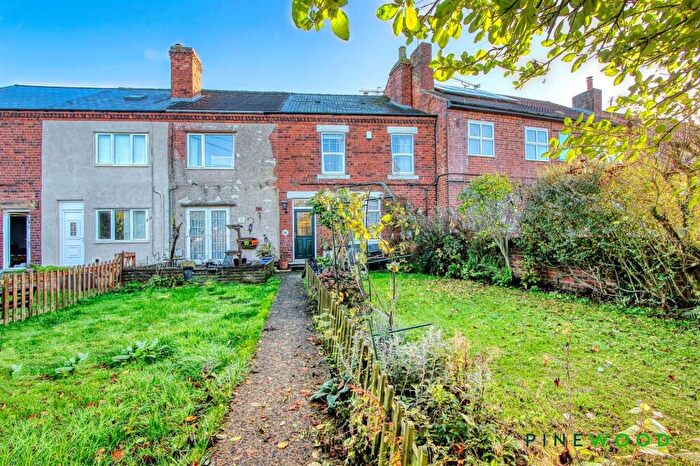
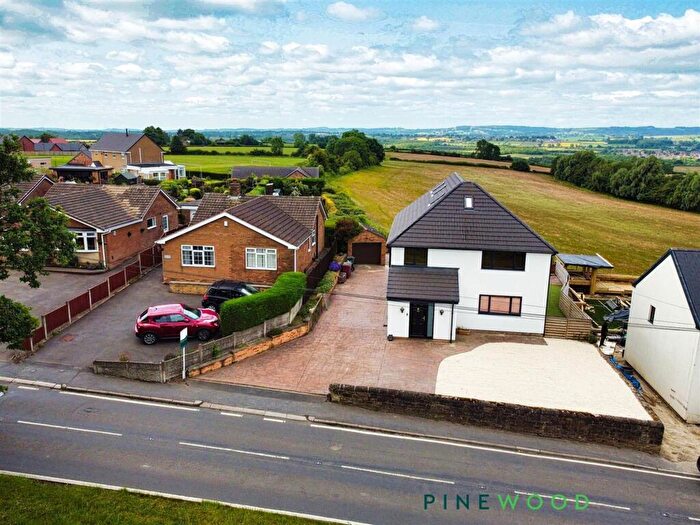
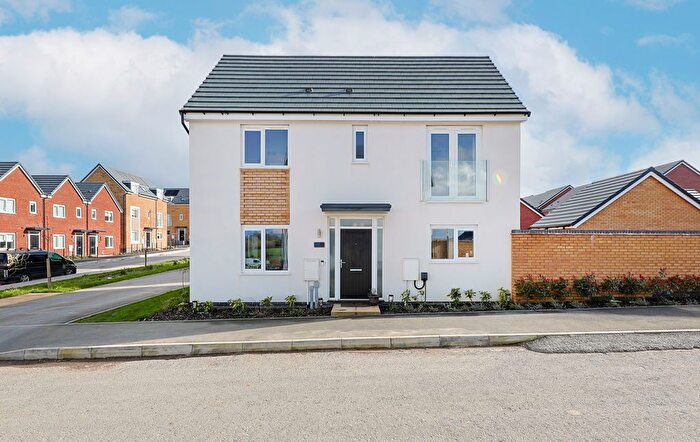
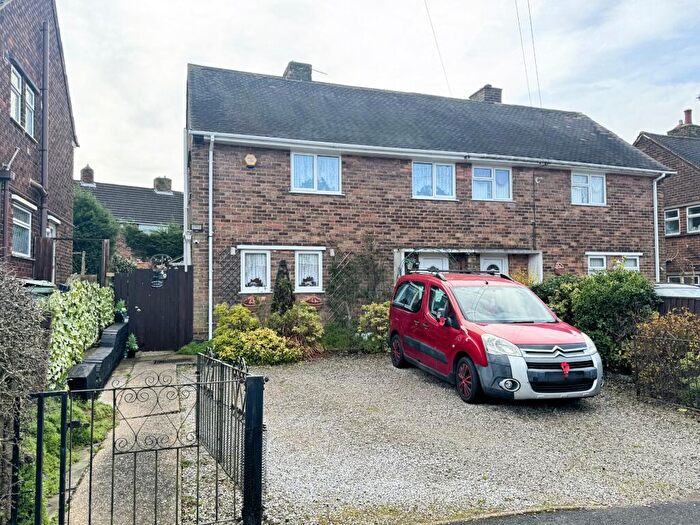
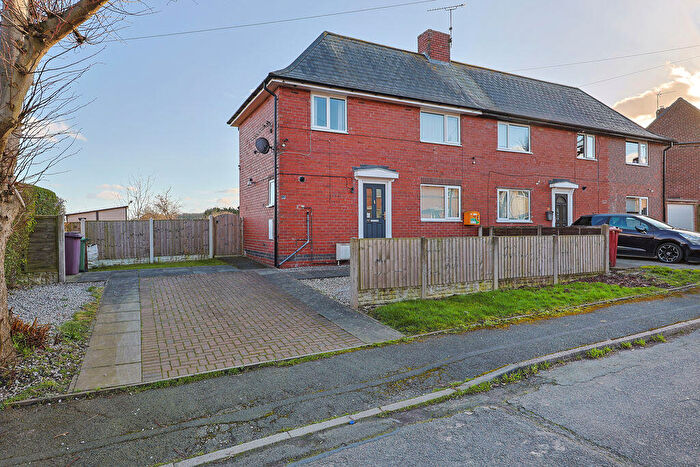
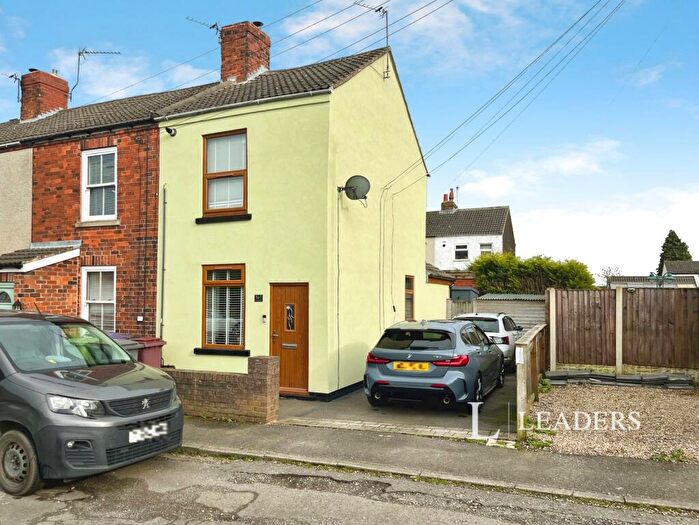
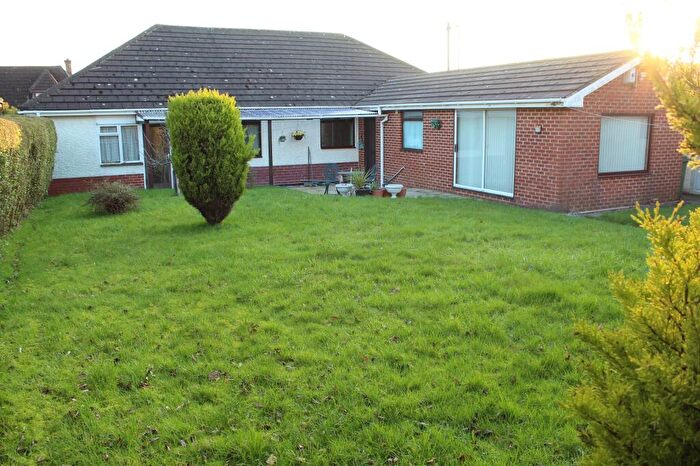
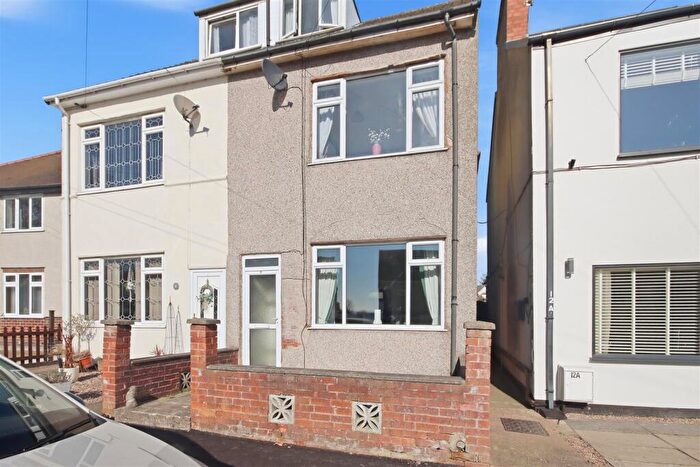
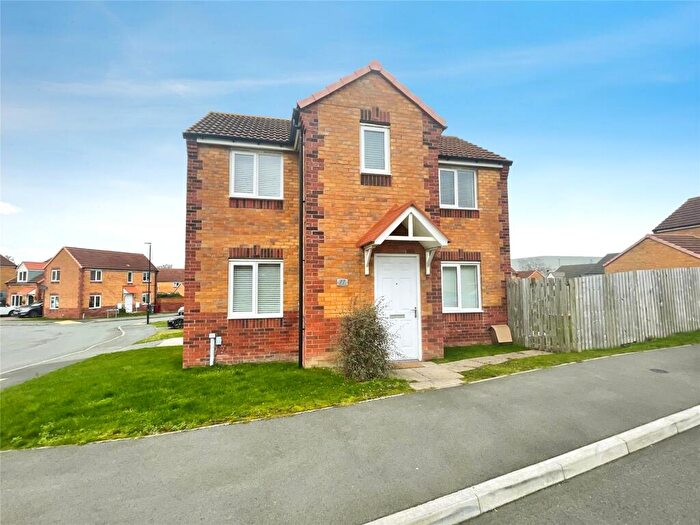
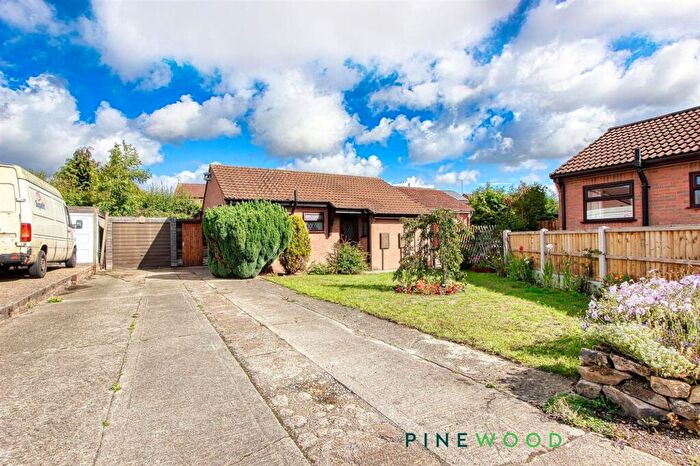
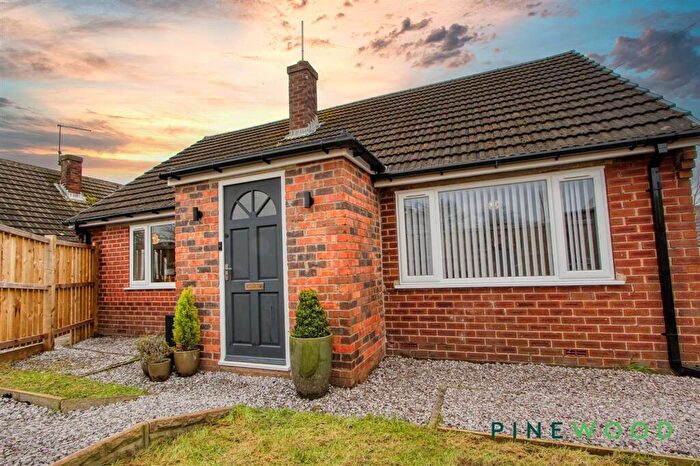
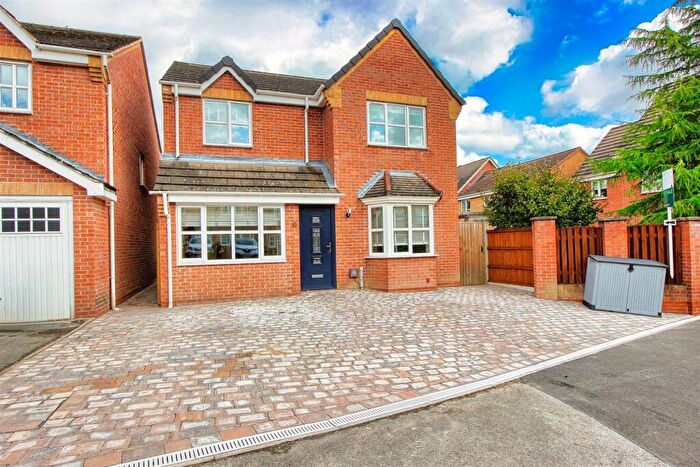
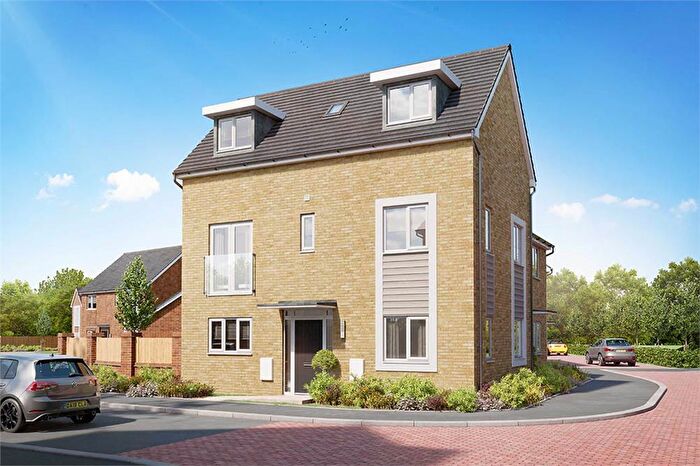
Properties for sale in Pilsley And Morton
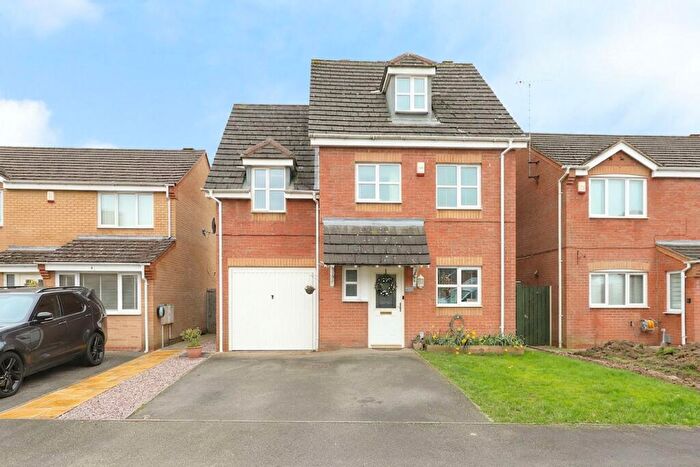
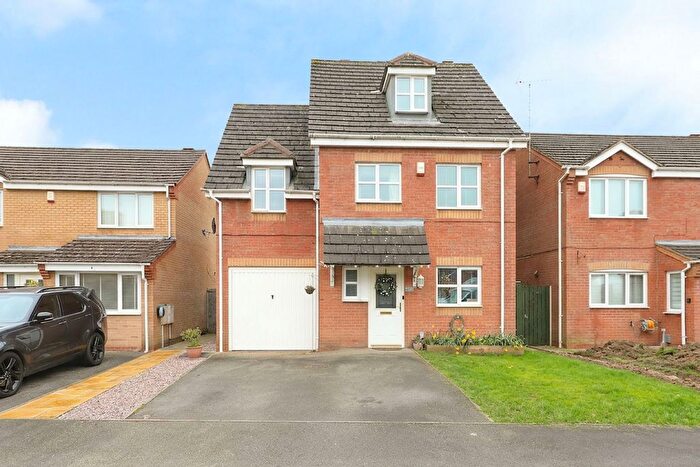

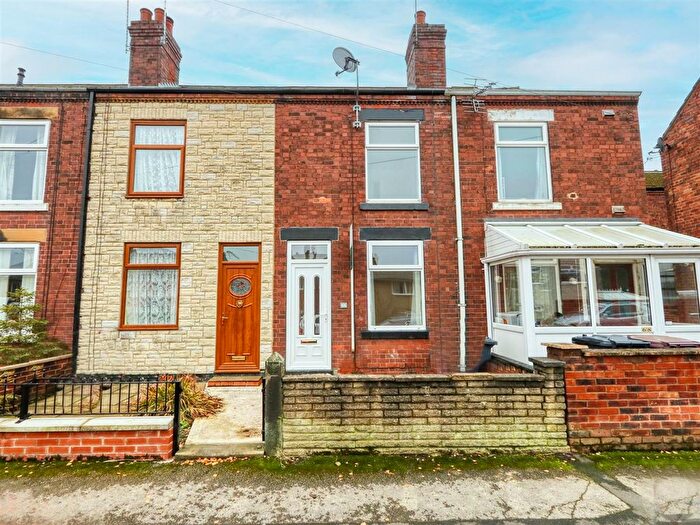
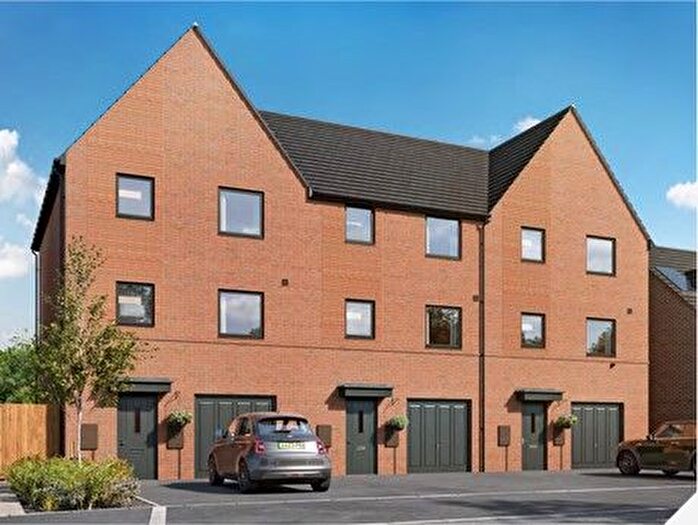
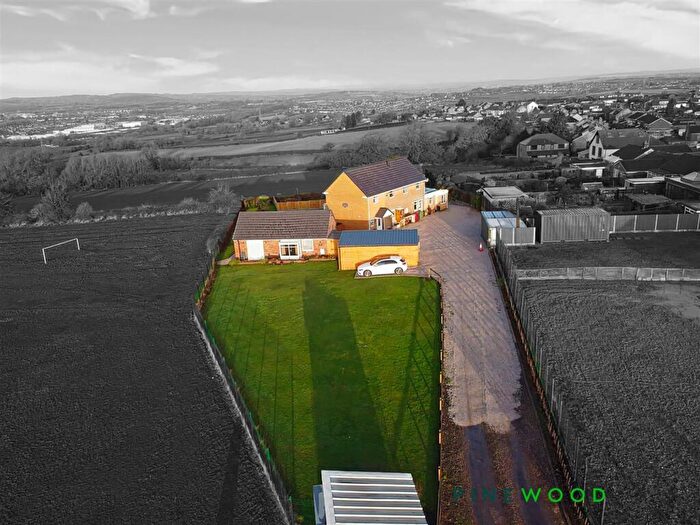
![]()
If you are looking to sell your house, let it out, or receive a property valuation, an expert can help you.
Click the button below to get started.


Roads and Postcodes in Pilsley And Morton
Navigate through our locations to find the location of your next house in Pilsley And Morton, Chesterfield for sale or to rent.
| Streets | Postcodes |
|---|---|
| Acacia Drive | S45 8DY |
| Acres Road | S45 8DU |
| Back Lane | S45 8HJ |
| Bridge Street | S45 8HE S45 8HQ |
| Broom Avenue | S45 8HS |
| Brunswick Street | S45 8HB |
| Church Street | S45 8EX |
| Crow Croft Road | S45 8HY |
| Dale View Close | S45 8DZ |
| Dale View Road | S45 8DR |
| Damon Close | S45 8ER |
| Elm Walk | S45 8EG |
| Forest Drive | S45 8EA |
| Granby Close | S45 8JB |
| Grange Road | S45 8HZ |
| Green Lane | S45 8AR |
| Hallgate Lane | S45 8HL S45 8HN |
| Handley Lane | S45 9AT S45 9AU |
| Hardstoft Road | S45 8AA S45 8BL |
| Hazel Avenue | S45 8DX |
| Lansbury Avenue | S45 8EH |
| Locko Road | S45 8DN S45 8DS S45 8DW |
| Lonsdale Road | S45 8HR |
| Manor Close | S45 8BB |
| Morton Road | S45 8EE S45 8EF |
| New Street | S45 8BJ |
| Old Hall Close | S45 8JD |
| Padley Wood Lane | S45 8EL |
| Padley Wood Road | S45 8HX |
| Park House Road | S45 8DA S45 8DG S45 8DJ |
| Peak Close | S45 8JF |
| Peartree Road | S45 8HU |
| Pilsley Road | S45 8DL |
| Prospect Road | S45 8EY |
| Queen Street | S45 8HA |
| Queensway | S45 8EJ S45 8HT |
| Reeves Avenue | S45 8JE |
| Rother Street | S45 8HG |
| Rouse Street | S45 8BE |
| Rupert Street | S45 8DB S45 8DD S45 8DE |
| Seanor Lane | S45 8DH S45 8DQ |
| Sitwell Grange Lane | S45 8EN |
| Slacks Lane | S45 8HH |
| South Street | S45 8BQ |
| Station Road | S45 8BA S45 8BD S45 8BG S45 8BH S45 8EZ |
| The Acres | S45 8DT |
| The Paddocks | S45 8ET |
| Valley Close | S45 8DP |
| Warren Close | S45 8ES |
| Waterloo Court | S45 8BP |
| Willow Close | S45 8JA |
| Woodhead Lane | S45 9AX |
Transport near Pilsley And Morton
-
 Alfreton Station
 -
Chesterfield Station
-
Sutton Parkway Station
-
Kirkby in Ashfield Station
-
Mansfield Woodhouse Station
-
Mansfield Town Station
-
Whatstandwell Station
-
Shirebrook (Derbys) Station
-
Matlock Station
-
Cromford Station
- FAQ
- Price Paid By Year
- Property Type Price
Frequently asked questions about Pilsley And Morton
What is the average price for a property for sale in Pilsley And Morton?
The average price for a property for sale in Pilsley And Morton is £182,649. This amount is 14% lower than the average price in Chesterfield. There are 2,978 property listings for sale in Pilsley And Morton.
What streets have the most expensive properties for sale in Pilsley And Morton?
The streets with the most expensive properties for sale in Pilsley And Morton are Handley Lane at an average of £505,250, Pilsley Road at an average of £403,750 and Sitwell Grange Lane at an average of £317,500.
What streets have the most affordable properties for sale in Pilsley And Morton?
The streets with the most affordable properties for sale in Pilsley And Morton are Broom Avenue at an average of £85,000, Bridge Street at an average of £85,500 and Waterloo Court at an average of £92,000.
Which train stations are available in or near Pilsley And Morton?
Some of the train stations available in or near Pilsley And Morton are Alfreton, Chesterfield and Sutton Parkway.
Property Price Paid in Pilsley And Morton by Year
The average sold property price by year was:
| Year | Average Sold Price | Price Change |
Sold Properties
|
|---|---|---|---|
| 2025 | £180,118 | 11% |
38 Properties |
| 2024 | £161,007 | -34% |
58 Properties |
| 2023 | £215,609 | 1% |
41 Properties |
| 2022 | £213,439 | 8% |
59 Properties |
| 2021 | £197,184 | 3% |
70 Properties |
| 2020 | £191,240 | 22% |
49 Properties |
| 2019 | £149,163 | -3% |
56 Properties |
| 2018 | £154,113 | 16% |
54 Properties |
| 2017 | £130,182 | -11% |
65 Properties |
| 2016 | £144,228 | 5% |
58 Properties |
| 2015 | £136,969 | 5% |
65 Properties |
| 2014 | £129,891 | 0,4% |
51 Properties |
| 2013 | £129,419 | 3% |
38 Properties |
| 2012 | £125,071 | 10% |
41 Properties |
| 2011 | £112,370 | -5% |
30 Properties |
| 2010 | £118,098 | -2% |
33 Properties |
| 2009 | £120,637 | -1% |
28 Properties |
| 2008 | £122,387 | -4% |
45 Properties |
| 2007 | £126,870 | 3% |
72 Properties |
| 2006 | £123,056 | 1% |
113 Properties |
| 2005 | £121,922 | 29% |
61 Properties |
| 2004 | £87,078 | 2% |
57 Properties |
| 2003 | £85,470 | 23% |
72 Properties |
| 2002 | £66,207 | 16% |
92 Properties |
| 2001 | £55,326 | 24% |
110 Properties |
| 2000 | £42,204 | -7% |
79 Properties |
| 1999 | £45,220 | -2% |
47 Properties |
| 1998 | £46,050 | -5% |
59 Properties |
| 1997 | £48,552 | 16% |
56 Properties |
| 1996 | £40,872 | 10% |
40 Properties |
| 1995 | £36,784 | - |
40 Properties |
Property Price per Property Type in Pilsley And Morton
Here you can find historic sold price data in order to help with your property search.
The average Property Paid Price for specific property types in the last three years are:
| Property Type | Average Sold Price | Sold Properties |
|---|---|---|
| Semi Detached House | £162,367.00 | 59 Semi Detached Houses |
| Detached House | £310,169.00 | 28 Detached Houses |
| Terraced House | £141,056.00 | 44 Terraced Houses |
| Flat | £92,000.00 | 6 Flats |